

In the world of financial trading, the ability to decipher and make sense of market signals is an art form in its own right. Candlestick patterns, time-honored visual representations of market dynamics and human psychology, stand as some of the most potent tools in a trader’s toolkit. Through these patterns, traders gain unique insights into market sentiment, granting them a glimpse into the tug-of-war between buyers and sellers.
Our exploration commences with the pursuit of mastery over these intricate candlestick patterns. Along this journey, we will unveil the strategies that pave the way for consistent success in the ever-shifting landscape of financial markets. We delve deep into the nuances of reading and deciphering these patterns, providing you with the knowledge and skills necessary to elevate your trading performance. Whether you are a newcomer eager to gain an edge or a seasoned trader seeking to refine your expertise, this article serves as your compass for conquering the art of candlestick patterns and realizing success in the trading arena.
Top 13 Candlestick Patterns Indicators. Mastering the Art of Candlestick Patterns.
- Candle Patterns Indicator
- 1-2-3 Pattern Indicator
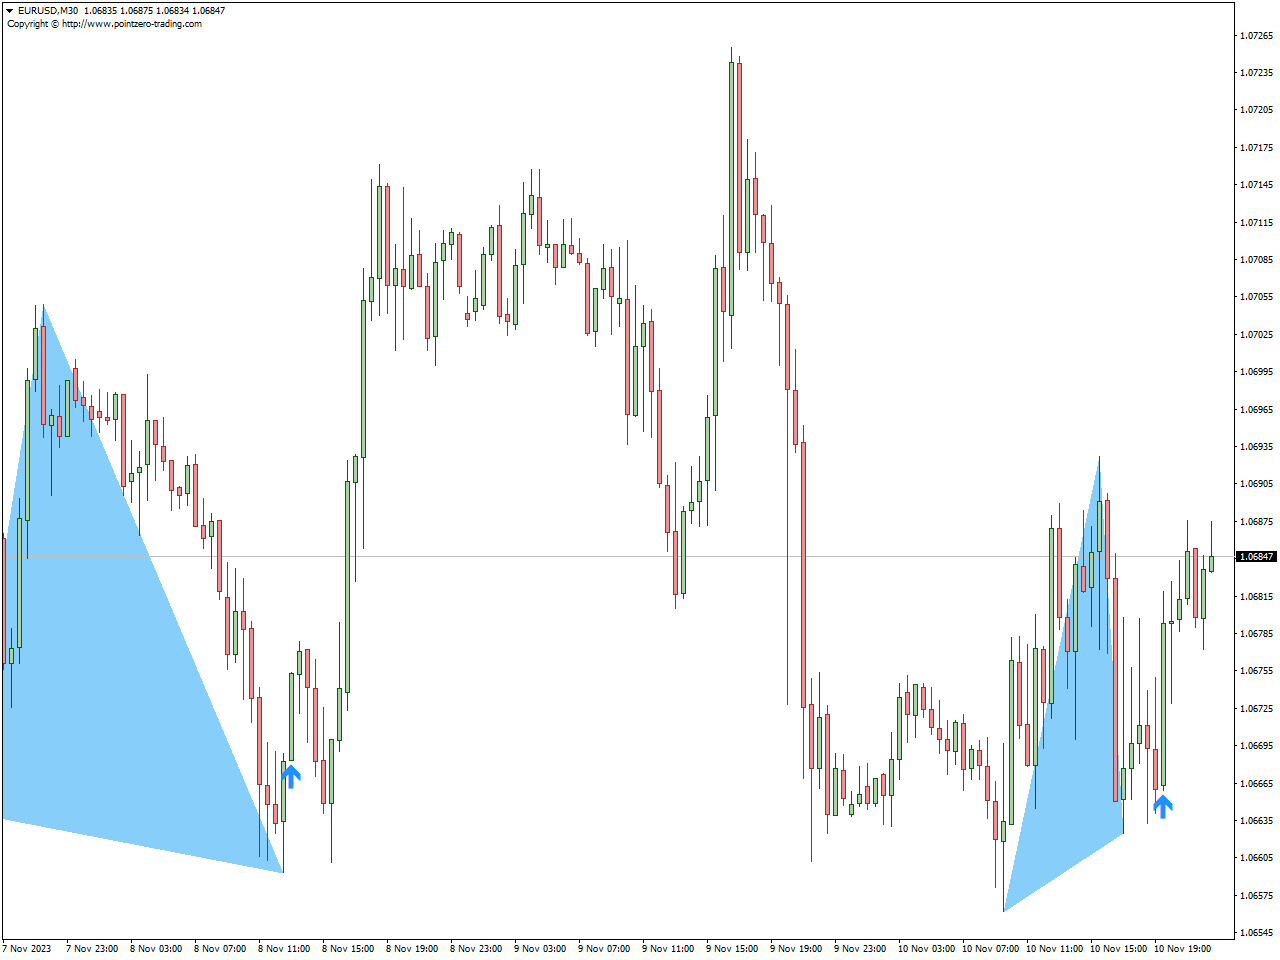
- Basic Harmonic Pattern Indicator
- Big Candle Alert Indicator
- Breakout Pattern Indicator
- Inside Bar Indicator
- Pattern Recognition Master Indicator
- Engulfing Indicator
- James16 Patterns Indicator
- Candlestick Pattern Indicator
- VolumeCandlesticks Indicator
- Cypher Pattern Indicator
- Double Top Bottom Patterns Indicator
Candle Patterns Indicator
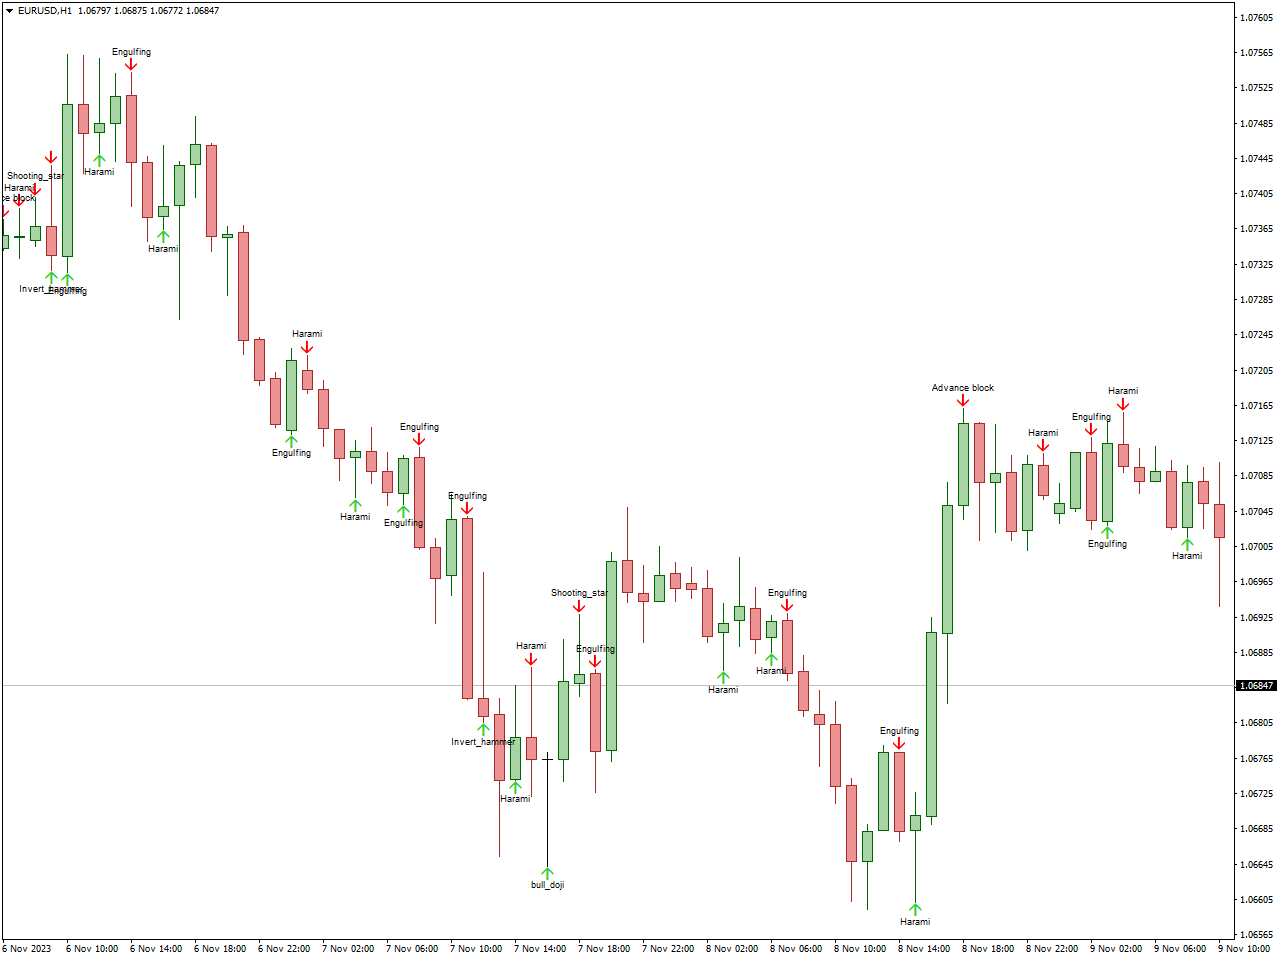
The Candle Patterns Indicator plays a pivotal role in technical analysis, providing traders with a valuable tool to identify various candlestick patterns depicted on price charts. These patterns serve as visual representations of price movements and market sentiment, offering crucial insights to guide well-informed trading decisions.
This indicator adeptly highlights patterns such as doji, hammer, shooting star, engulfing patterns, and more. Through the recognition of these patterns, traders can decipher potential reversals, continuations, or the strength of prevailing trends. The Candle Patterns Indicator consistently portrays these formations with visual cues on the price chart, facilitating traders in identifying pivotal moments for entry or exit points.
Applied across diverse financial markets, spanning stocks, forex, and cryptocurrencies, the Candle Patterns Indicator stands as a potent ally for traders aiming to elevate their analytical prowess and fine-tune their strategies. Nonetheless, like any tool, its effective utilization hinges on a comprehensive understanding and seamless integration into a trader’s overarching approach.
1-2-3 Pattern Indicator
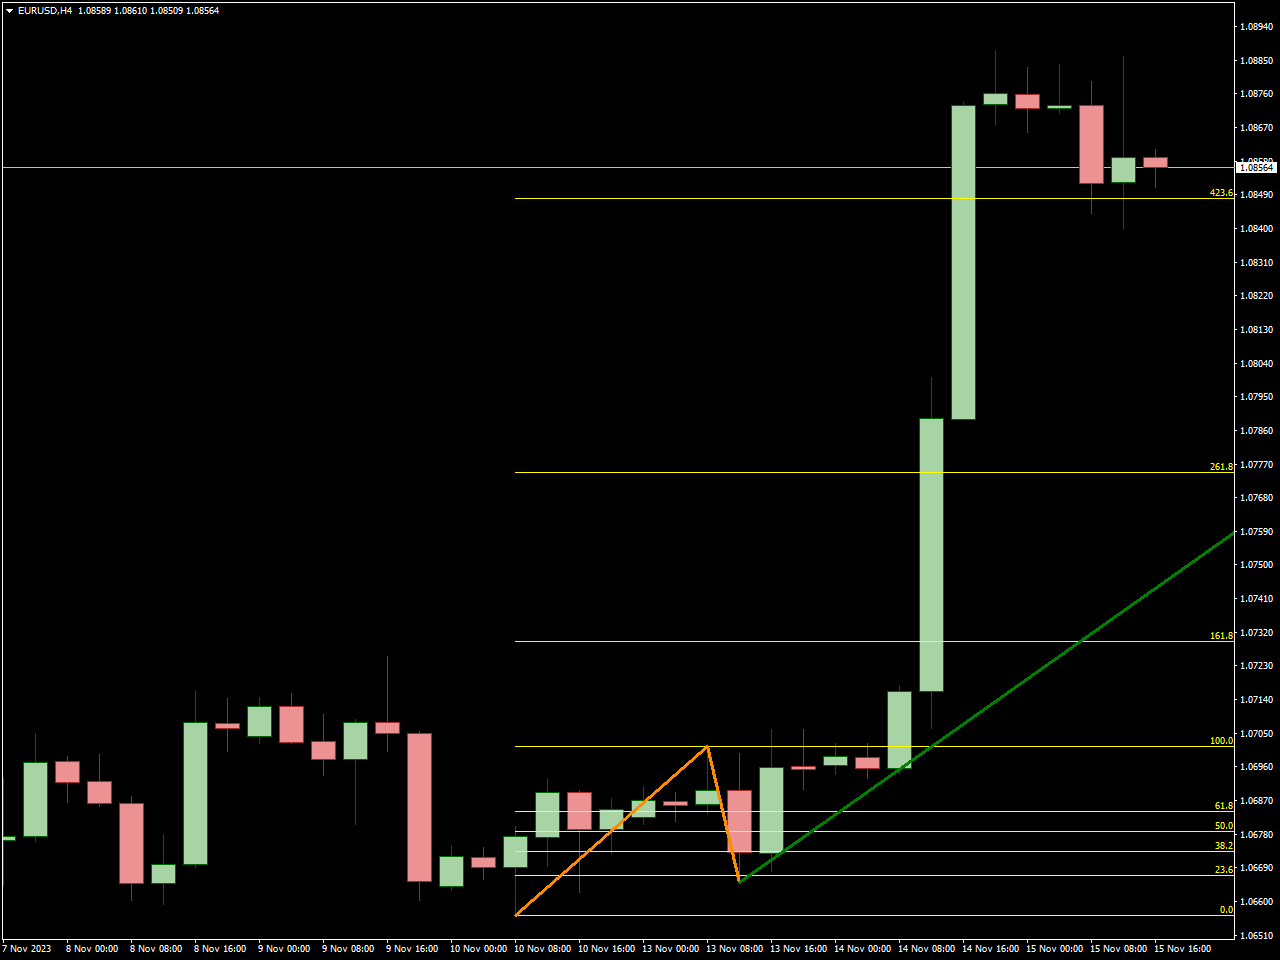
The 1-2-3 Pattern Indicator serves as a technical analysis tool employed by traders to pinpoint distinct chart patterns signaling potential trend reversals or continuations. Renowned for their simplicity and efficacy, these patterns prove instrumental in detecting shifts in market sentiment.
Whether bullish, indicating an uptrend continuation, or bearish, signaling a downtrend continuation, the 1-2-3 Pattern Indicator visually underscores these patterns on price charts. This visual aid enhances the ease of identifying potential trade opportunities for traders.
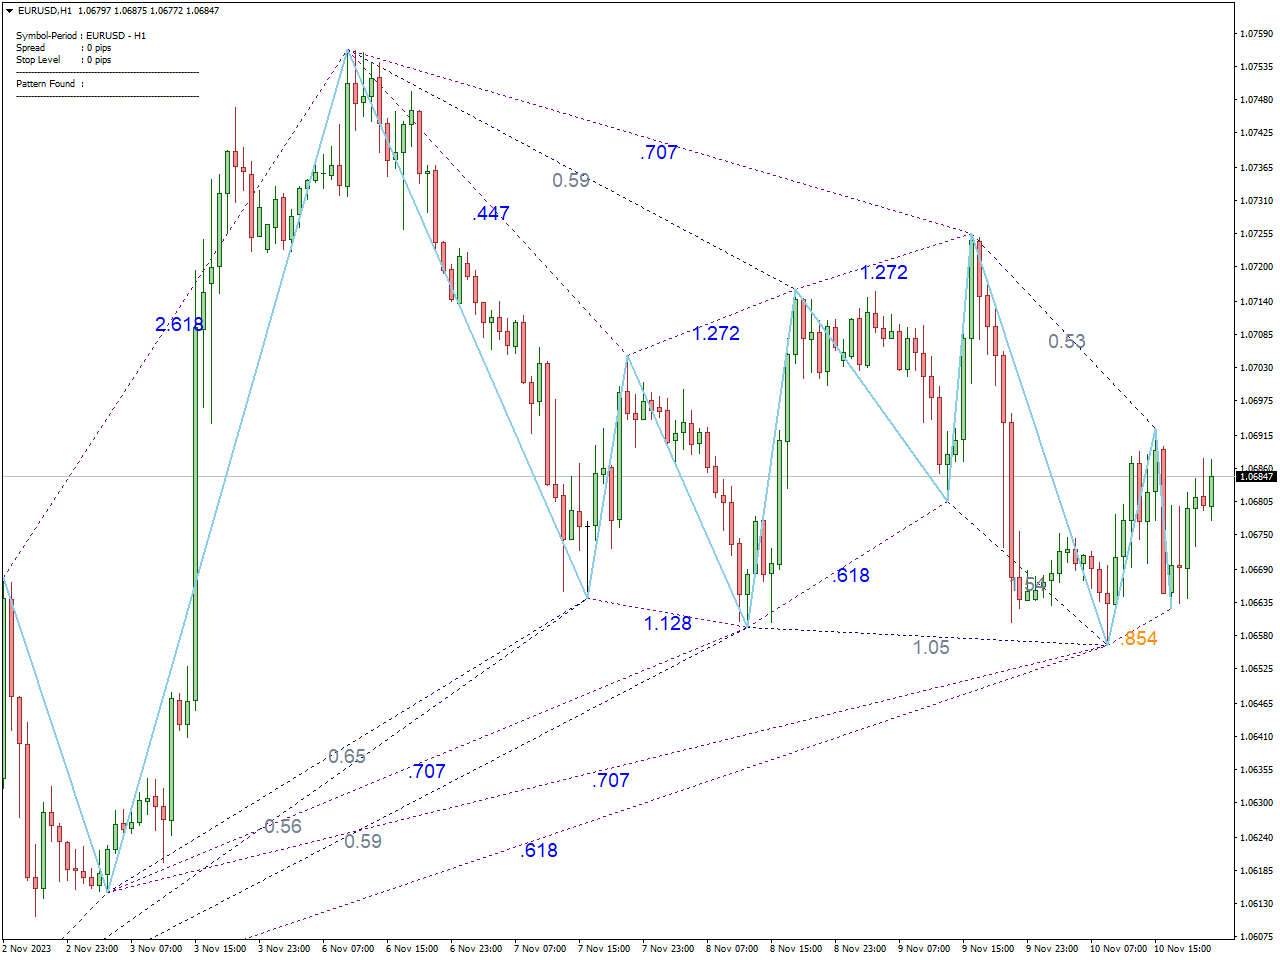
Basic Harmonic Pattern Indicator
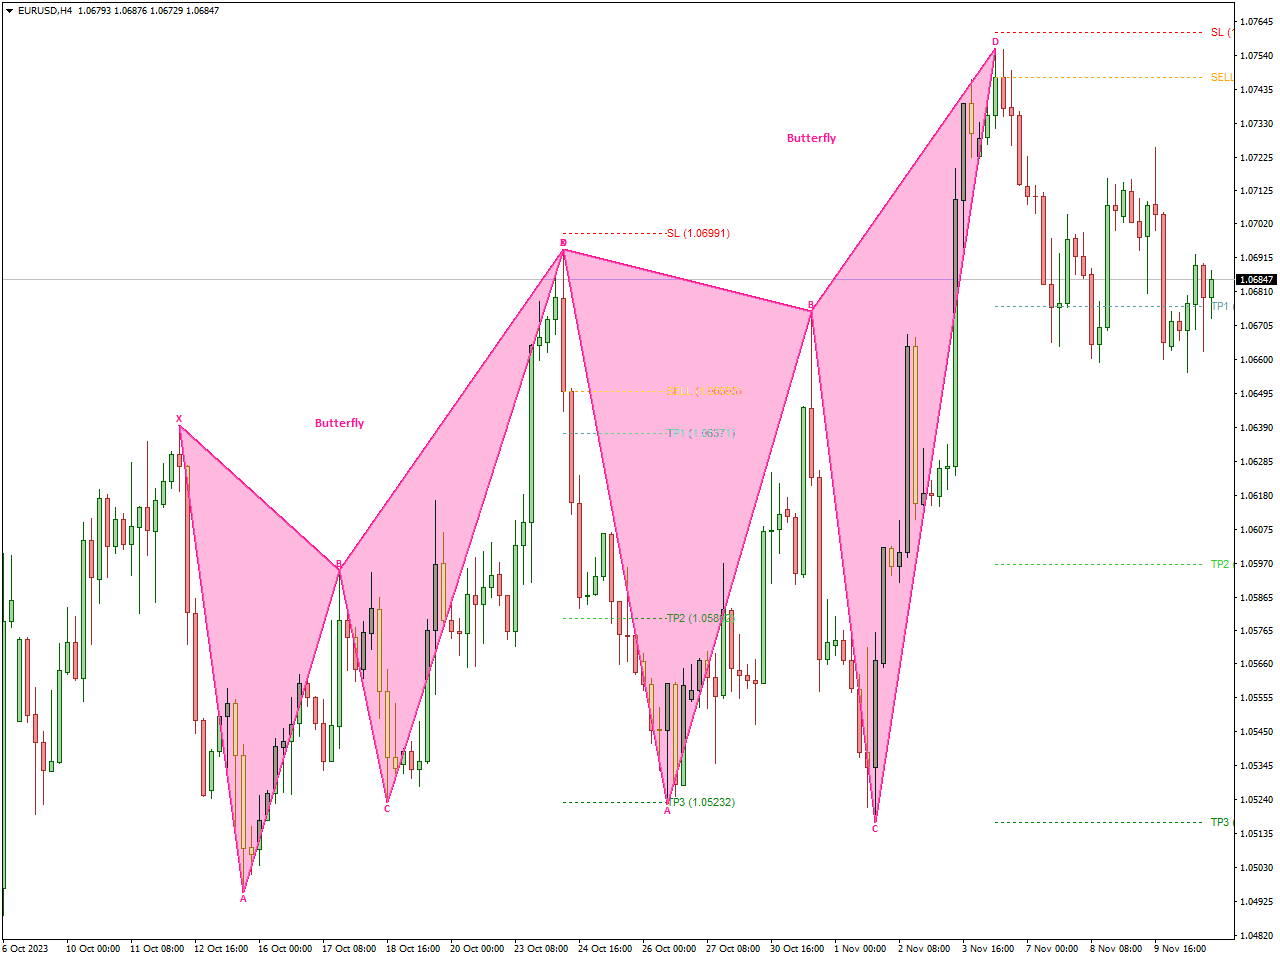
The Basic Harmonic Pattern Indicator is an essential tool in technical analysis, assisting traders in identifying harmonic patterns on price charts. Harmonic patterns, such as the Butterfly, Gartley, and Bat patterns, provide insights into potential trend reversals or continuations, offering traders valuable information for making informed decisions.
By employing the Basic Harmonic Pattern Indicator, traders can visually identify these harmonic formations on price charts, making it easier to recognize crucial moments for entry or exit points. Widely used across diverse financial markets, including stocks, forex, and cryptocurrencies, this indicator serves as a valuable asset for traders seeking to enhance their analytical skills and refine their trading strategies. However, like any tool, its optimal effectiveness requires a comprehensive understanding and integration into a trader’s overall approach.
Big Candle Alert Indicator
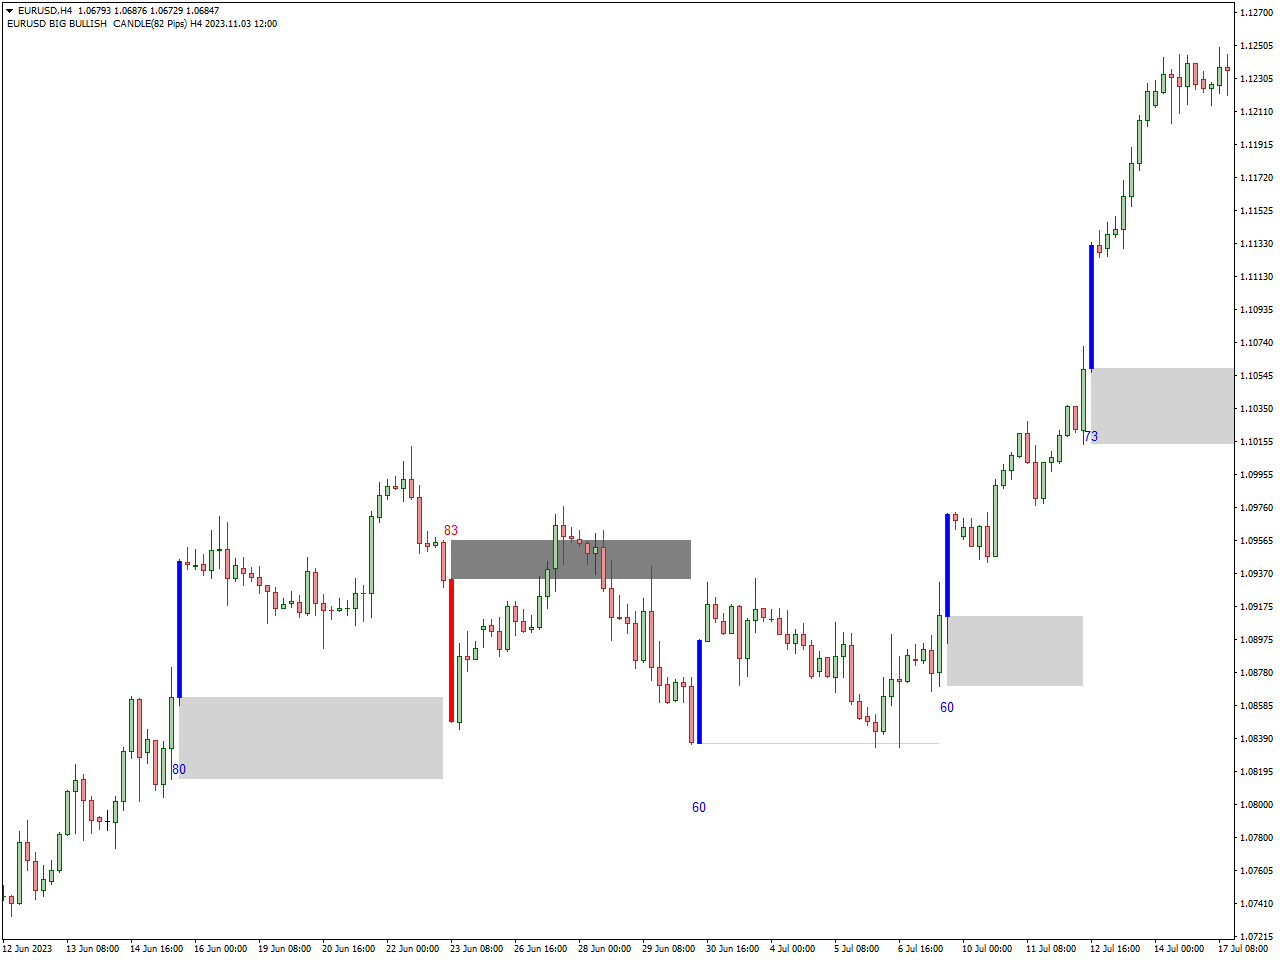
The Big Candle Alert Indicator is a tool used by traders to detect substantial price movements depicted by large candlesticks on price charts, often indicative of increased market volatility or robust buying/selling momentum.
This indicator is programmed to issue alerts or signals when a candle’s size surpasses a predetermined threshold, suggesting potential trading opportunities. Traders may interpret these alerts as potential signals of trend strength, reversal points, or breakout scenarios.
Breakout Pattern Indicator
The Breakout Pattern Indicator serves as a technical analysis instrument, employed by traders to detect breakout patterns on price charts. These patterns indicate instances where the price breaches crucial support or resistance levels, suggesting potential changes in market dynamics.
Specifically crafted to visually emphasize breakout patterns, this indicator aids traders in identifying strategic entry or exit points. Breakouts are frequently linked to heightened volatility, signaling the possibility of significant price movements.
Inside Bar Indicator
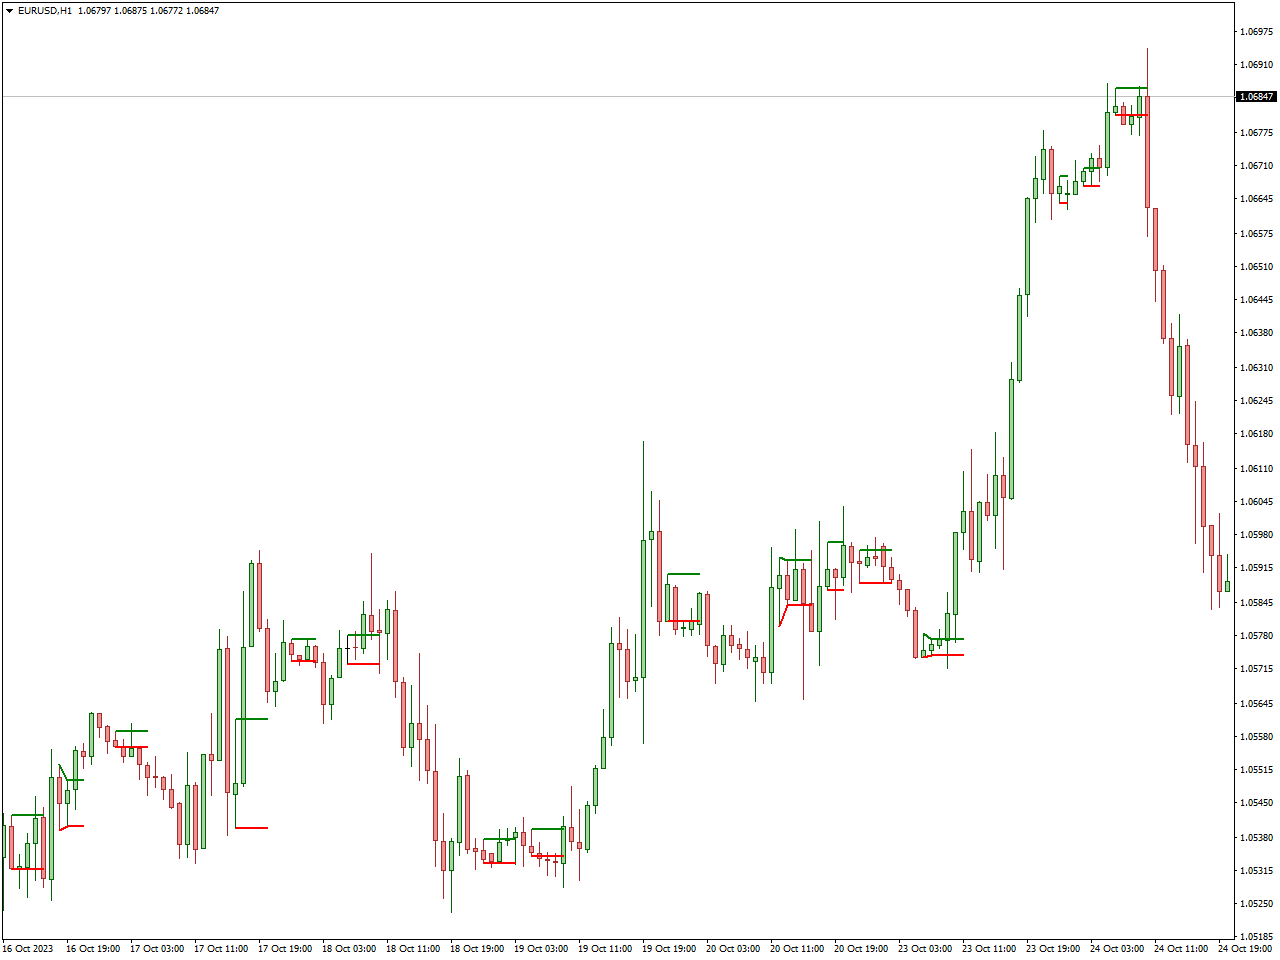
The Inside Bar Indicator serves as a technical analysis tool adopted by traders to pinpoint inside bars on price charts. Inside bars manifest as candlestick patterns where the current bar’s price range stays within the high and low limits of the preceding bar. This pattern typically signals a phase of consolidation or potential market indecision.
Traders leverage the Inside Bar Indicator to visually emphasize these patterns, aiding in the identification of scenarios where the market pauses, hinting at an imminent breakout or the continuation of the prevailing trend. Applied across diverse financial markets, this indicator proves valuable for traders aiming to discern potential shifts in market sentiment.
Pattern Recognition Master Indicator
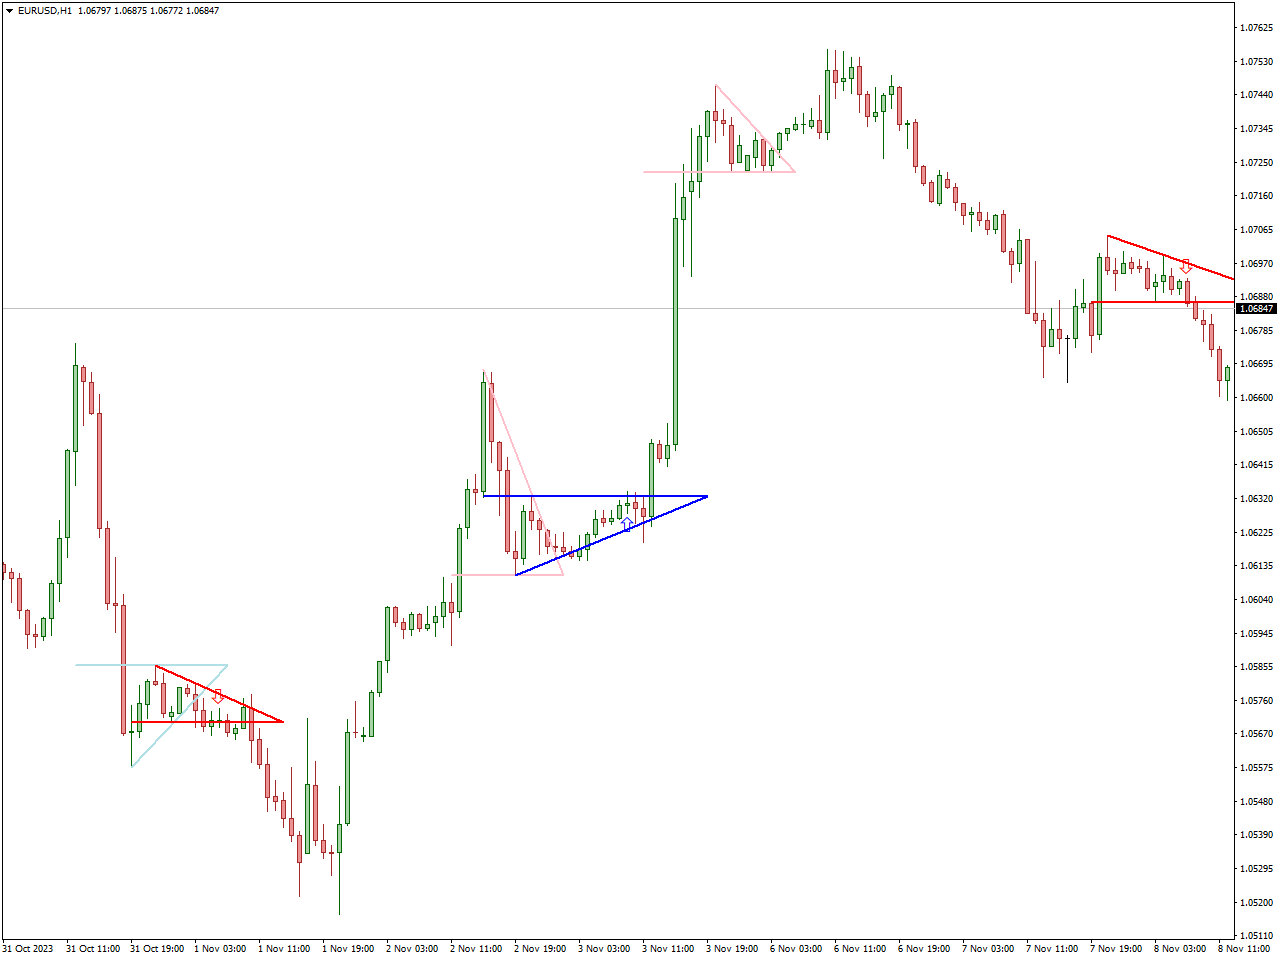
The Pattern Recognition Master Indicator serves as a valuable tool in technical analysis, aiding traders in the identification of diverse chart patterns on price charts. This indicator is crafted to discern and emphasize patterns like triangles, rectangles, and other formations, offering insights into potential trend reversals, continuations, or breakout scenarios.
Traders depend on the Pattern Recognition Master Indicator to visually pinpoint these patterns, thereby enhancing their capacity to make well-informed decisions regarding entry and exit points. Widely deployed across various financial markets, encompassing stocks, forex, and cryptocurrencies, this tool provides traders with a comprehensive perspective on the evolving dynamics of the market. However, successful utilization necessitates a profound understanding of the indicator’s parameters and its seamless integration into an overarching trading strategy.
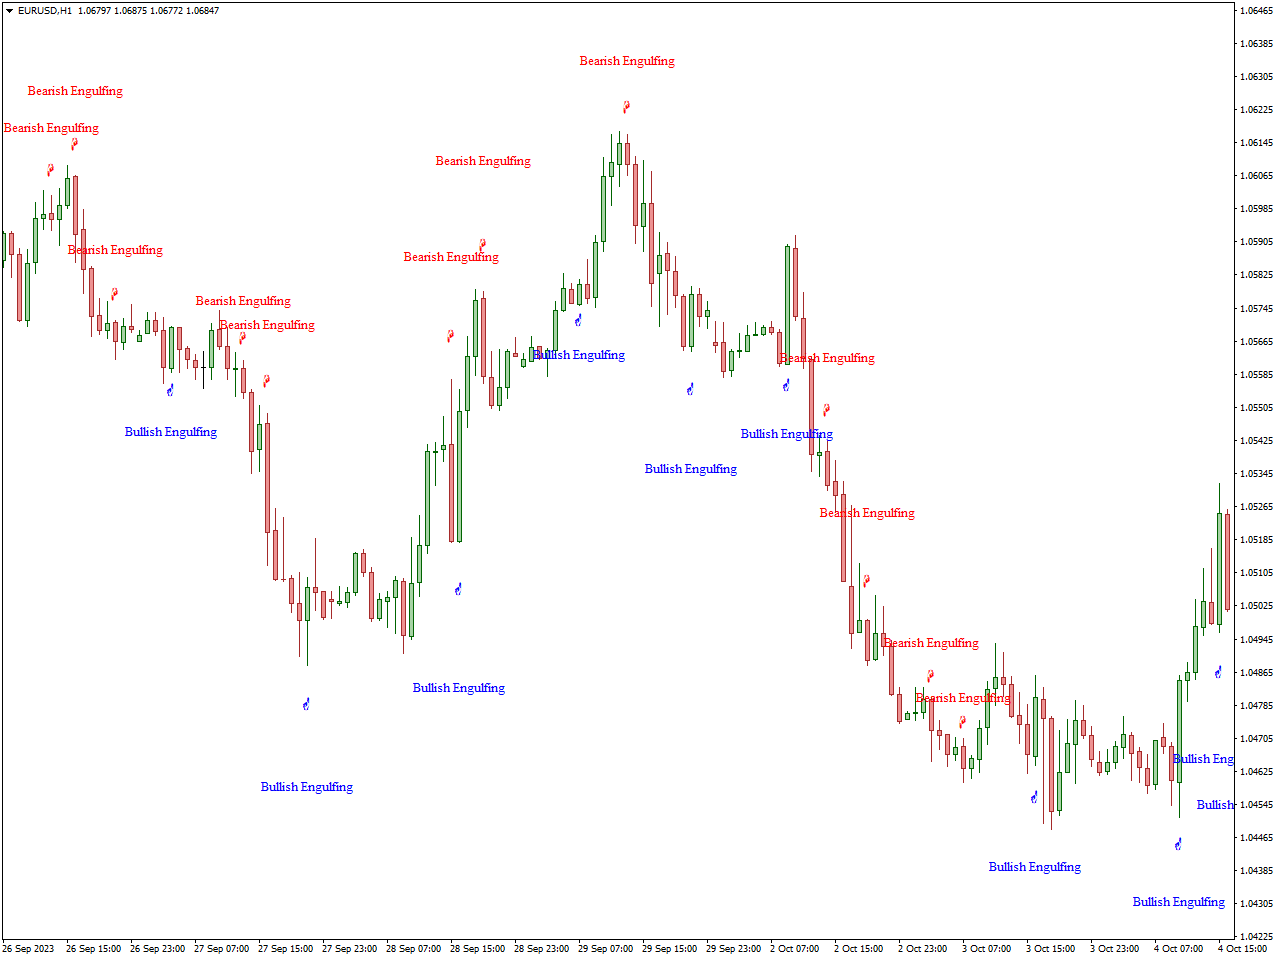
Engulfing Indicator
The Engulfing Indicator proves essential for traders, aiding in the identification of engulfing candlestick patterns on price charts. These patterns manifest when a single candlestick entirely engulfs the body of the preceding one, signaling possible trend reversals or continuations.
Traders leverage the Engulfing Indicator to visually emphasize these patterns, making it easier to spot crucial moments for entry or exit points. Given that engulfing patterns often indicate shifts in market sentiment, this indicator becomes invaluable for those seeking insights into potential changes in trend direction.
Used across diverse financial markets, the Engulfing Indicator enhances traders’ analytical prowess. However, its effective use demands a comprehensive understanding of its parameters and integration into a well-rounded trading strategy.
James16 Patterns Indicator
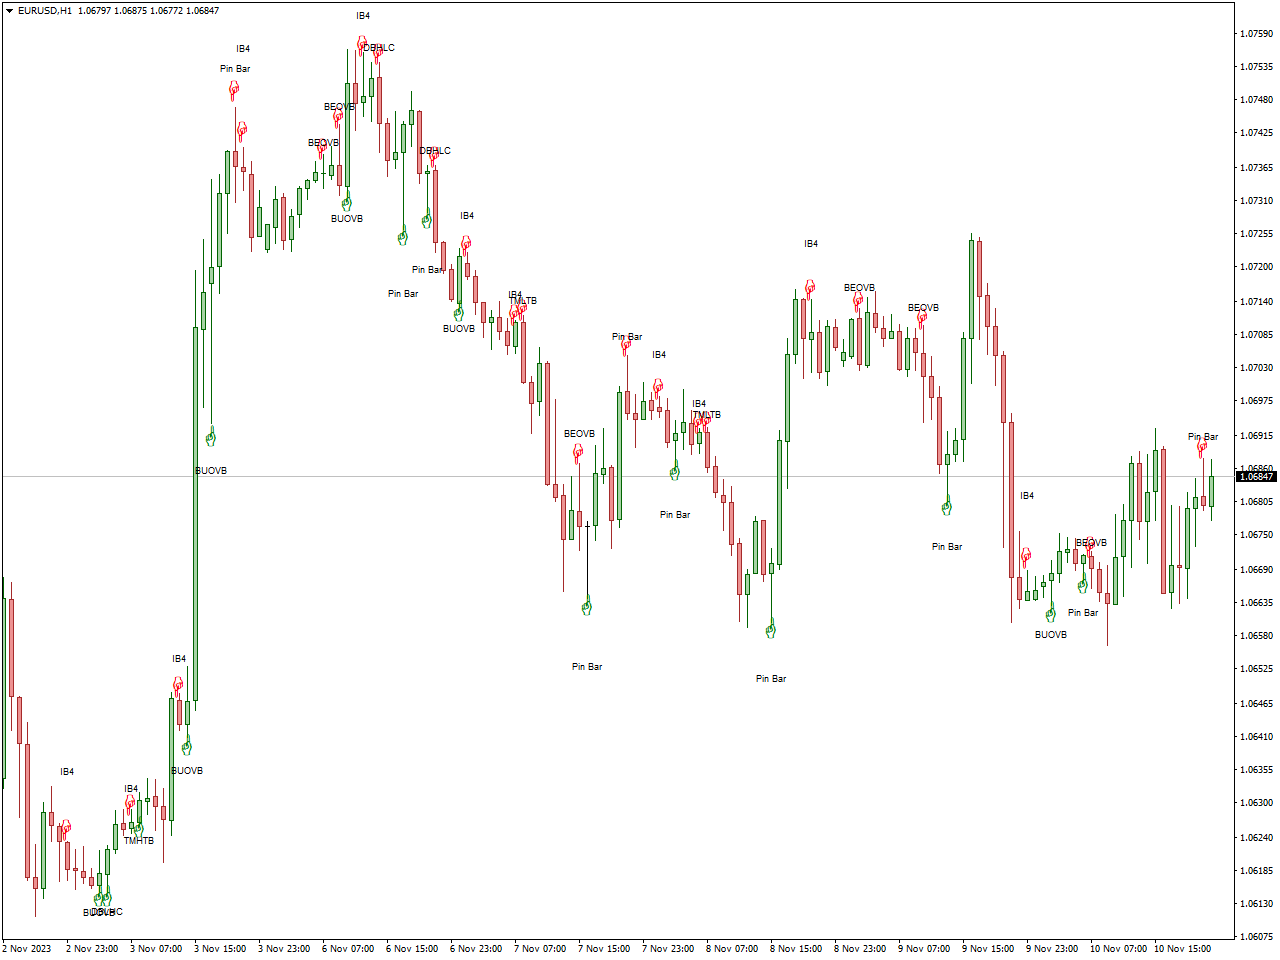
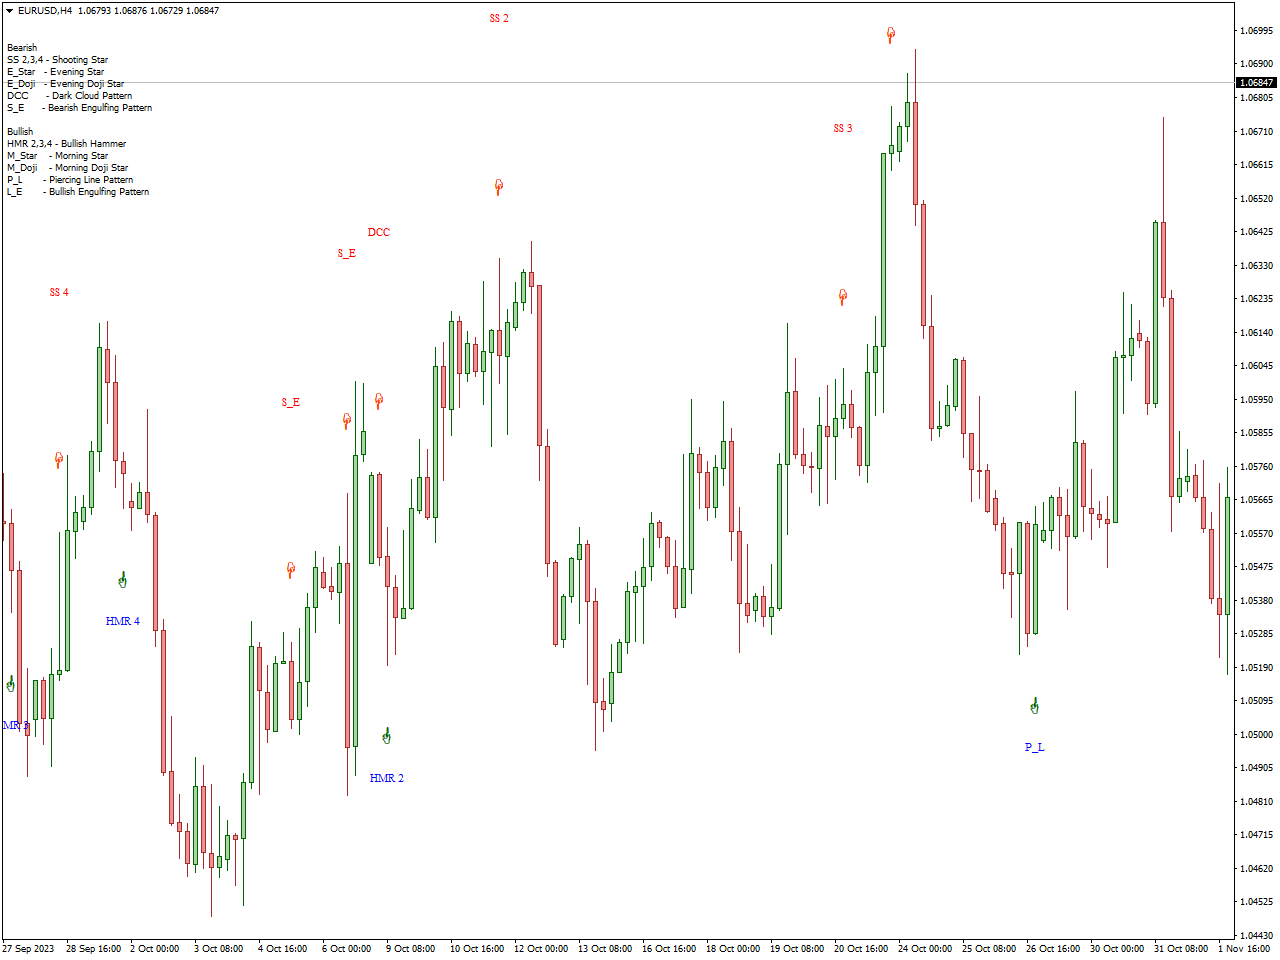
The MT4 James 16 Patterns indicator identifies and exhibits bearish, bullish, and non-directional price patterns directly on the chart. It appears in the primary MT4 window, showcasing all detected patterns, with the flexibility to toggle them ON/OFF. Bullish patterns are highlighted in green, while bearish patterns are displayed in red.
This versatile James 16 Patterns indicator serves dual purposes—assisting in trade entry and exit decisions and acting as a supplementary confirmation filter for other trading strategies and systems. Its effectiveness extends across all currency pairs, including majors, minors, and exotic pairs, yielding promising outcomes when applied judiciously.
Candlestick Pattern Indicator
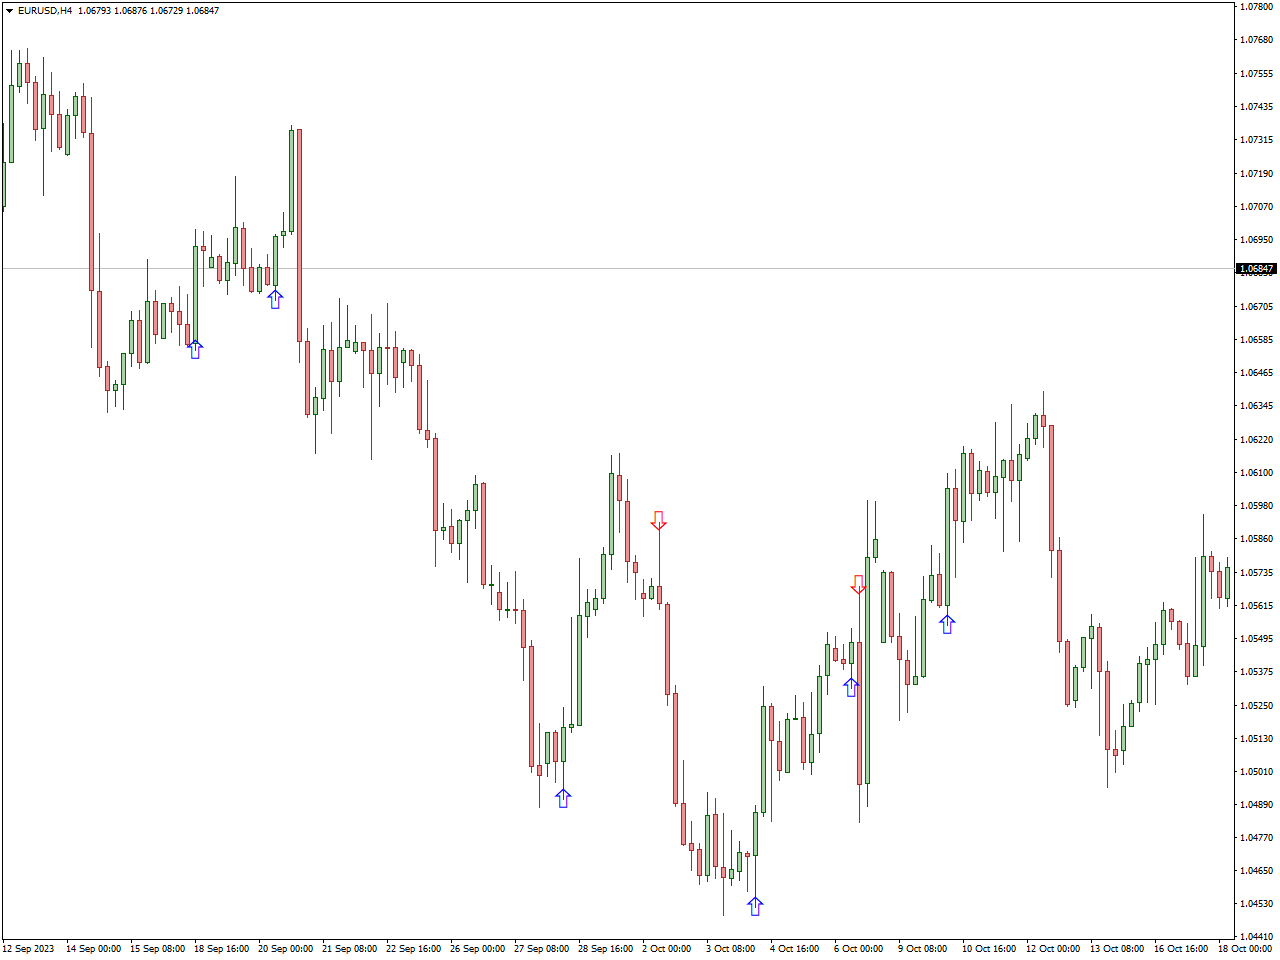
The Candlestick Pattern Indicator serves as a crucial tool in technical analysis, assisting traders in identifying and interpreting diverse candlestick patterns on price charts. Candlestick patterns, visual representations of price movements and market sentiment, provide valuable insights for informed trading decisions.
This indicator highlights patterns like doji, hammer, shooting star, engulfing patterns, and more. Traders can interpret these patterns to gauge potential reversals, continuations, or trend strength. The Candlestick Pattern Indicator usually presents these formations with visual cues on the price chart, aiding traders in identifying pivotal moments for entry or exit points.
VolumeCandlesticks Indicator
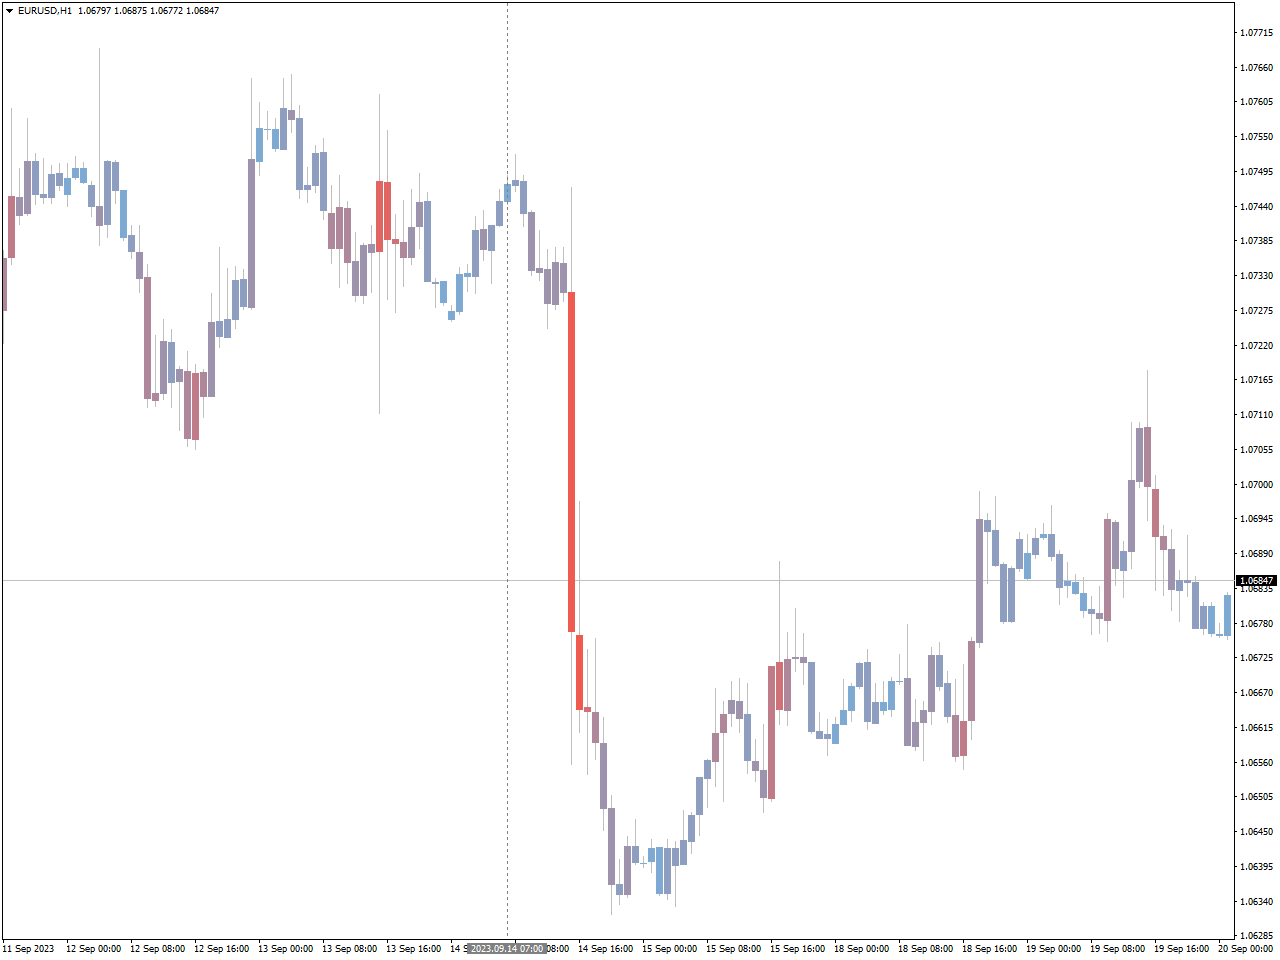
The VolumeCandlesticks Indicator proves to be a robust asset in technical analysis, crafted to assist traders in comprehending market dynamics by integrating price movements and trading volume. Presenting candlesticks on price charts, this indicator assigns significance to each candlestick’s size, reflecting the volume of trades at specific price levels during designated timeframes.
As traders merge candlestick patterns with volume insights through the VolumeCandlesticks Indicator, they unlock a deeper understanding of the vigor and endurance of price shifts. Elevated volume amid a price trend suggests robust market conviction, whereas disparities between volume and price movements can hint at potential reversals.
Applicable across diverse financial markets, including stocks, forex, and cryptocurrencies, the VolumeCandlesticks Indicator serves as a valuable ally for traders aiming for a comprehensive grasp of market activity. However, effective utilization mandates a thorough comprehension of the indicator’s parameters and seamless integration into a trader’s overarching strategy.
Cypher Pattern Indicator
The Cypher Pattern Indicator serves as an essential technical analysis tool for traders aiming to pinpoint distinct chart patterns indicative of potential trend reversals or continuations. Acknowledged for its unique structure, the Cypher Pattern falls under the category of harmonic patterns in the realm of technical analysis.
Comprising four legs, the Cypher Pattern Indicator is employed by traders to visually emphasize and validate these patterns on price charts. Identifying the Cypher Pattern offers traders valuable insights into potential entry and exit points, making it a valuable asset for those looking to leverage harmonic price movements. Like any technical indicator, effectively utilizing the Cypher Pattern Indicator necessitates a thorough understanding of its intricacies and integration into a trader’s overarching strategy.
Double Top Bottom Patterns Indicator
The Double Top Bottom Patterns Indicator stands as a crucial tool in technical analysis, employed by traders to identify specific chart patterns indicating potential trend reversals or continuations. These patterns, recognized as double tops and double bottoms, play a significant role in evaluating shifts in market sentiment.
Traders depend on the Double Top Bottom Patterns Indicator to visually emphasize and authenticate these patterns on price charts. A double top typically signals a potential reversal from an uptrend to a downtrend, while a double bottom suggests a potential reversal from a downtrend to an uptrend. Recognizing these patterns empowers traders to make informed decisions regarding entry and exit points in their trades. Like any technical indicator, the effective utilization of the Double Top Bottom Patterns Indicator necessitates a thorough understanding and seamless integration into a trader’s overall strategy.
Conlusion
Embarking on the path to mastering candlestick patterns is a transformational journey, one that unveils a profound understanding of market behavior and unlocks the potential for greater success in trading. These intricate patterns provide a distinct vantage point on market dynamics, and when paired with the right strategies, they can become a formidable asset in your trading arsenal. It’s important to remember that expertise in this realm is cultivated through dedicated practice, a continuous quest for knowledge, and the adaptability to navigate the ever-evolving market landscape.
As you set forth on your quest to master the art of candlestick patterns, we encourage you to put into practice what you’ve learned, refine your skills, and maintain an unwavering commitment to expanding your knowledge. With perseverance and a steadfast dedication to honing your craft, you can proudly stand among the ranks of successful traders who have harnessed the art of candlestick patterns to unlock the doors to financial accomplishment in the world of trading.