

In the ever-evolving world of financial markets, beginners are always on the lookout for tools and techniques to gain an advantage and navigate the complexities of price fluctuations. Among the plethora of technical indicators available, the Relative Strength Index (RSI) stands out as a robust tool for assessing the strength of price movements and identifying potential trend reversals. Developed by J. Welles Wilder Jr. in the late 1970s, the RSI has since become a staple in the arsenal of traders worldwide.
Understanding the RSI goes beyond mere computation and interpretation of its values. It entails grasping the underlying dynamics of market sentiment, capturing the ebb and flow of buying and selling pressure that influence currency pairs prices. Armed with this understanding, traders can decipher market sentiment, pinpoint optimal entry and exit points, and confidently navigate the turbulent waters of financial markets.
RSI indicators offer significant utility for various trading styles, from day trading to swing trading, across different asset classes. Whether applied to stocks, forex, commodities, or cryptocurrencies, traders can harness the power of RSI indicators alongside other technical analysis tools to enhance decision-making and improve trading outcomes.
How RSI Works
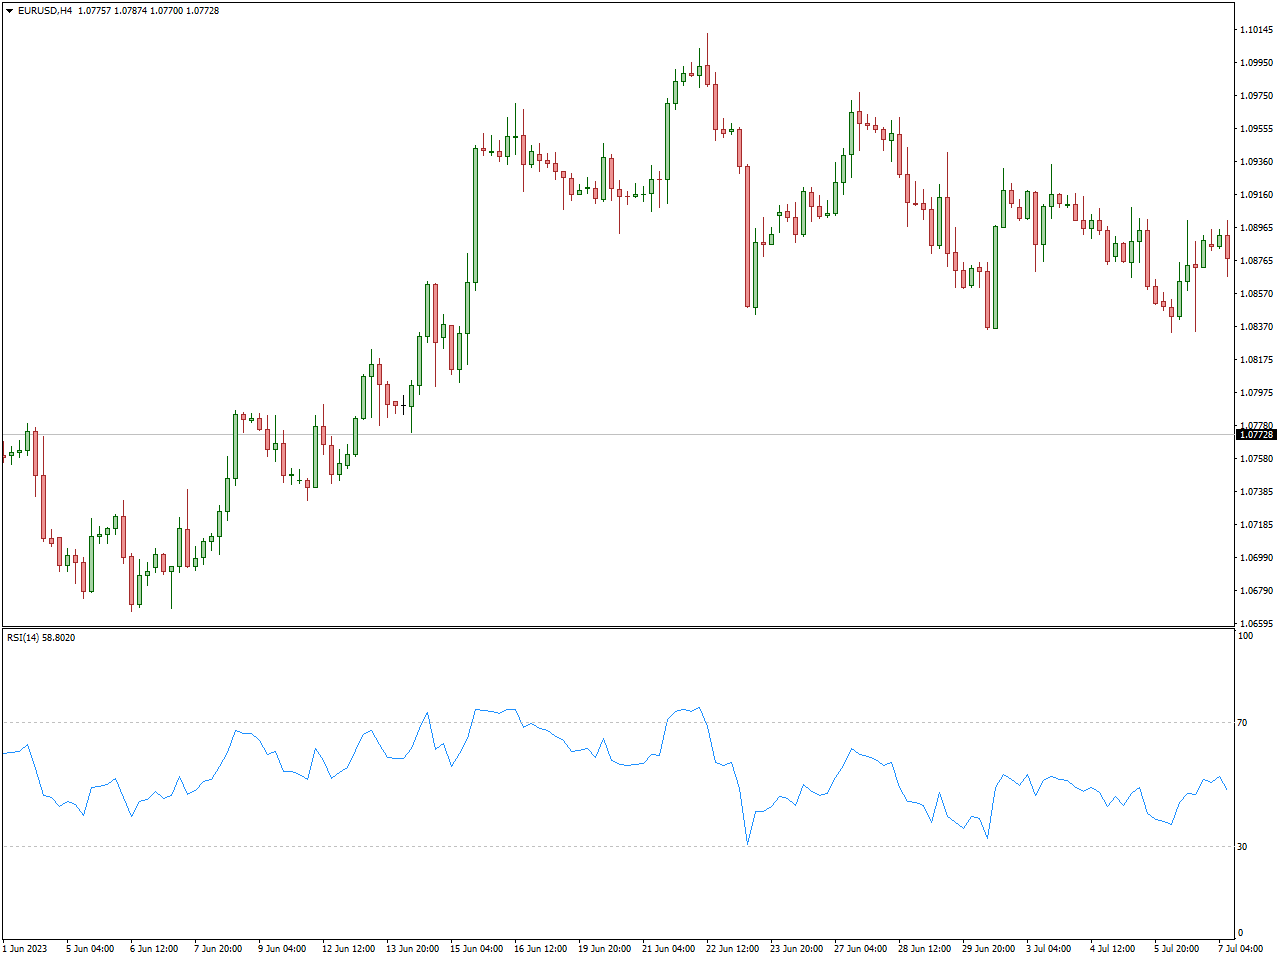
The Relative Strength Index is a momentum oscillator that measures the speed and change of price movements. It oscillates between 0 and 100 and is typically calculated using the closing prices of an asset over a specified period, commonly 14 periods. The RSI is based on the principle that during uptrends, prices tend to close higher, while during downtrends, prices tend to close lower.
The RSI calculation involves comparing the magnitude of recent gains to recent losses over the selected period. This calculation results in a single line that oscillates between 0 and 100, with readings above 70 typically considered overbought and readings below 30 considered oversold.
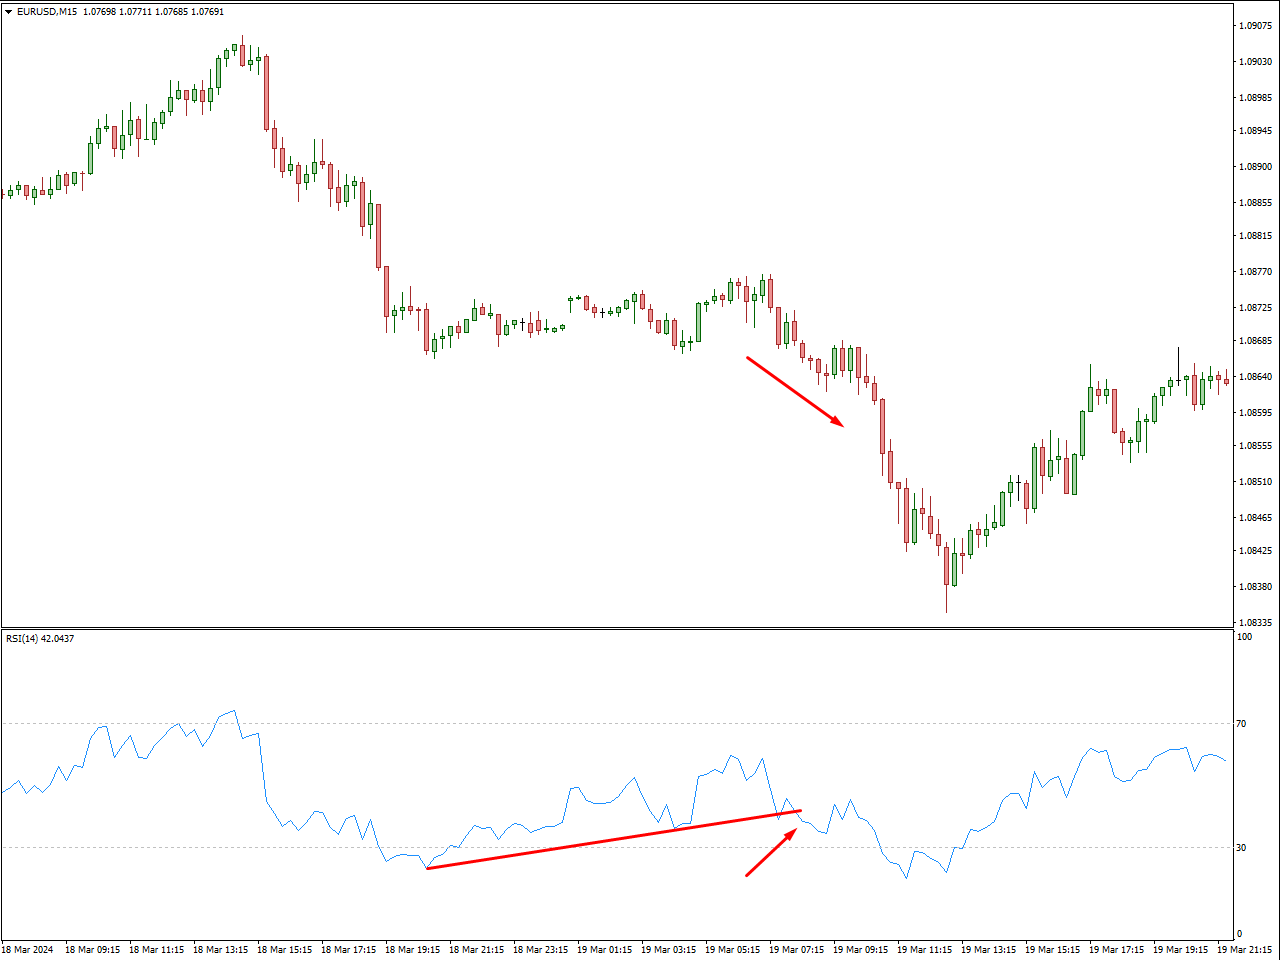
Interpreting RSI involves identifying overbought and oversold conditions, as well as potential bullish or bearish divergences. Overbought conditions suggest that the asset may be due for a price correction or reversal, while oversold conditions may indicate a buying opportunity. Bullish divergence occurs when the price makes a lower low while the RSI makes a higher low, potentially signaling a bullish reversal. Conversely, bearish divergence occurs when the price makes a higher high while the RSI makes a lower high, potentially signaling a bearish reversal.
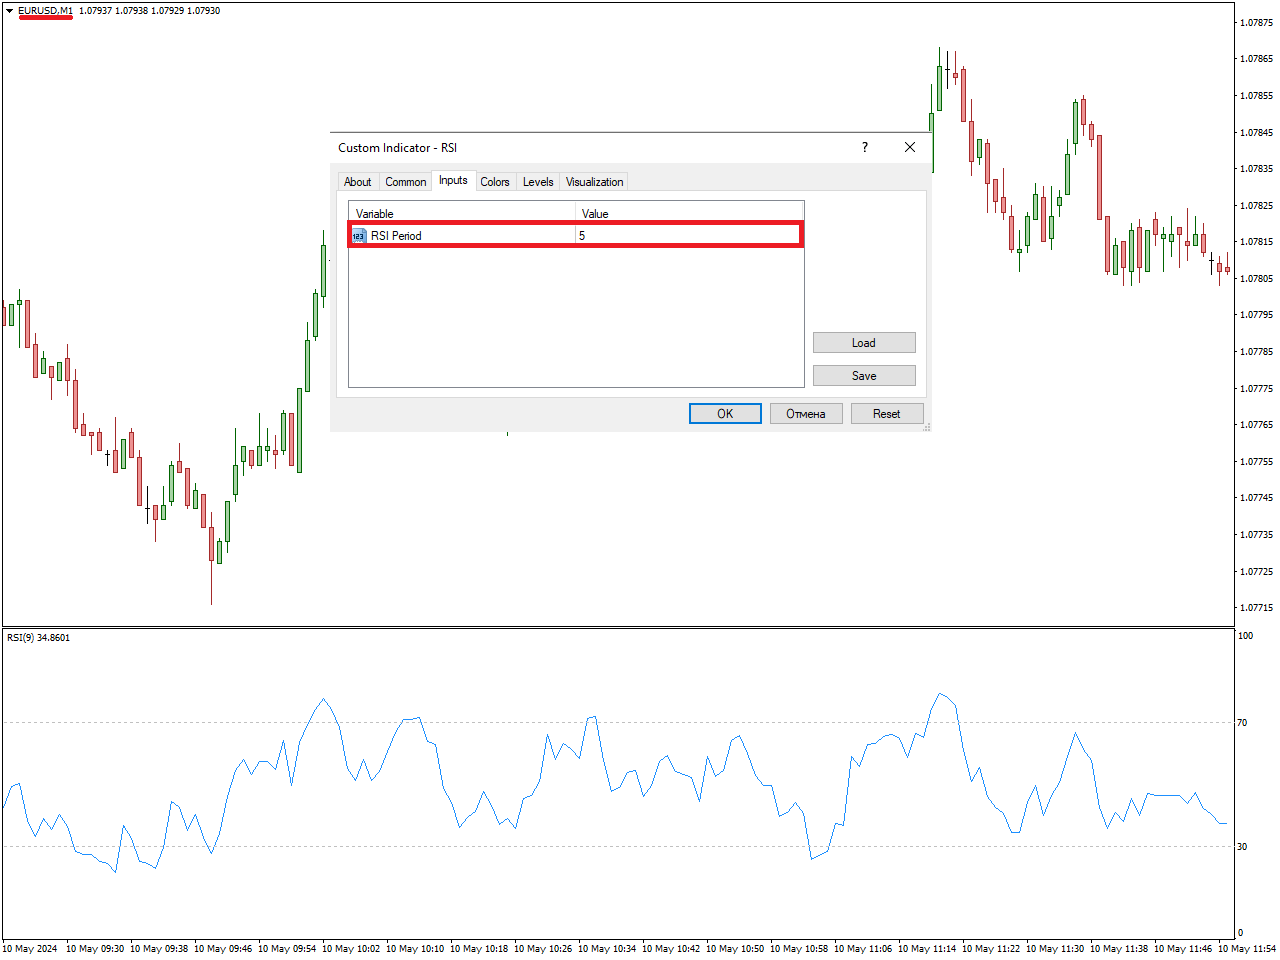
Best RSI Settings for Scalping
Time Frame: 1-Minute Chart (or even tick charts for ultra-short-term scalping)
RSI Period: 5 or even lower
Overbought Threshold: 70
Oversold Threshold: 30
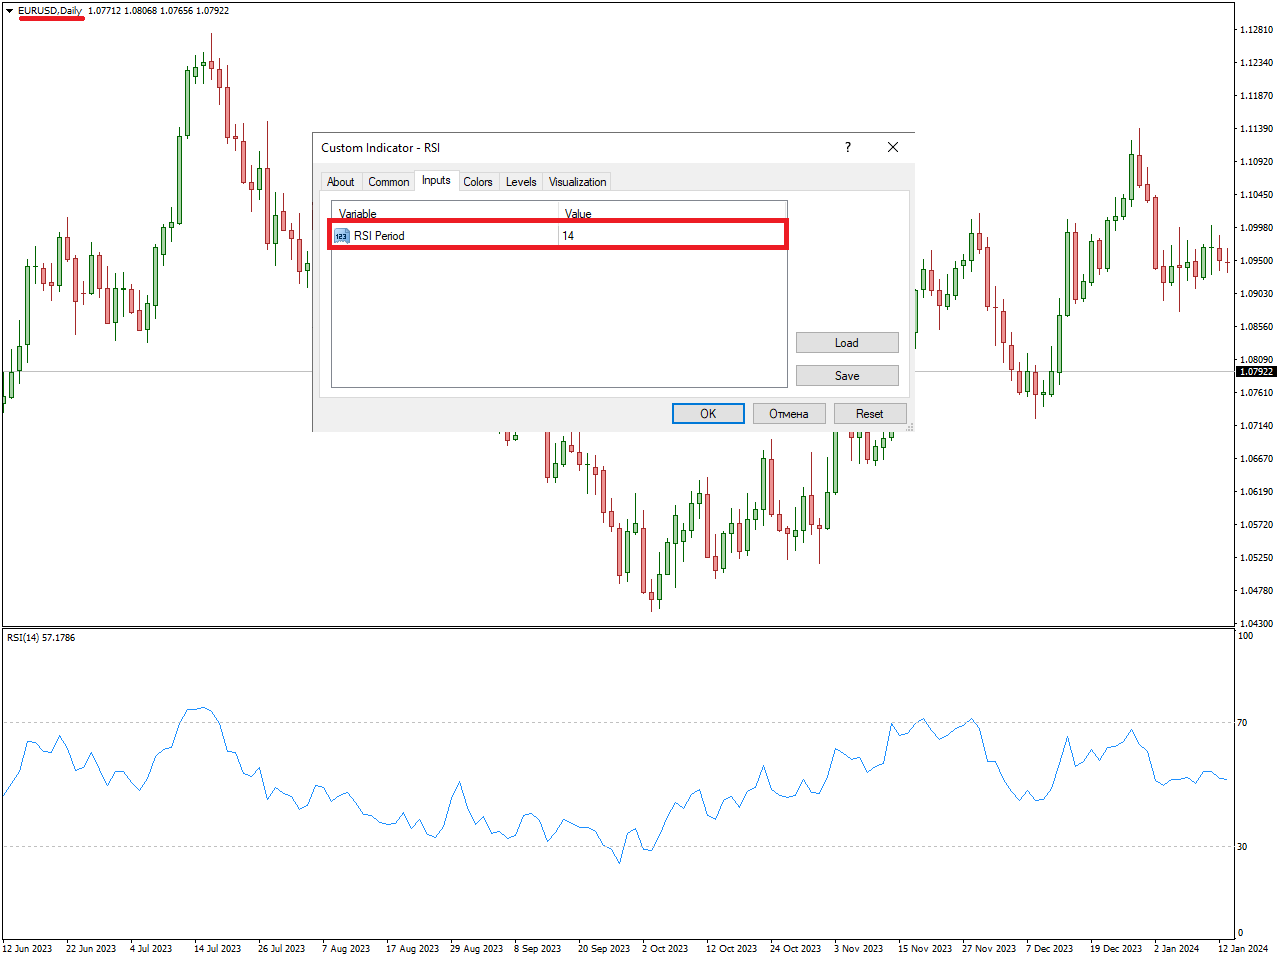
Best RSI Settings for Swing Trading
Optimizing RSI settings for swing trading involves tailoring the indicator to identify medium-term trends and reversals. Here’s a recommended set of RSI settings:
Time Frame: Daily and Weekly Charts
RSI Period: 14
Overbought Threshold: 70
Oversold Threshold: 30
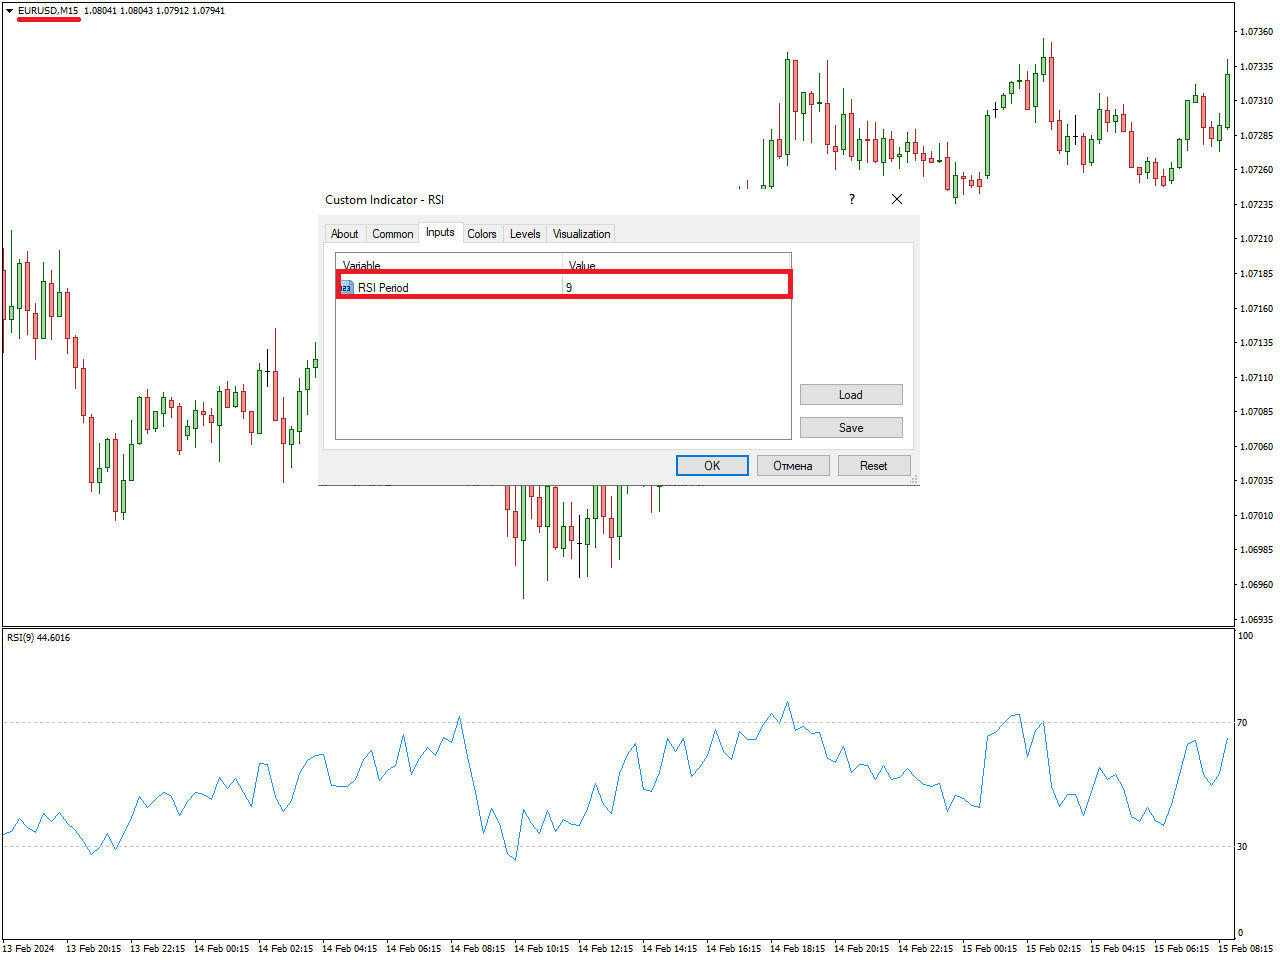
Best RSI Settings for Intraday Trading
For intraday trading, where precise timing is crucial, adjustments to RSI settings are necessary. Here’s a suggested set of RSI settings:
Time Frame: 15-Minute Chart
RSI Period: 9
Overbought Threshold: 70
Oversold Threshold: 30
RSI Divergence Strategy
Time Frame: Any
RSI Period: 14
Look for divergences between price action and RSI.
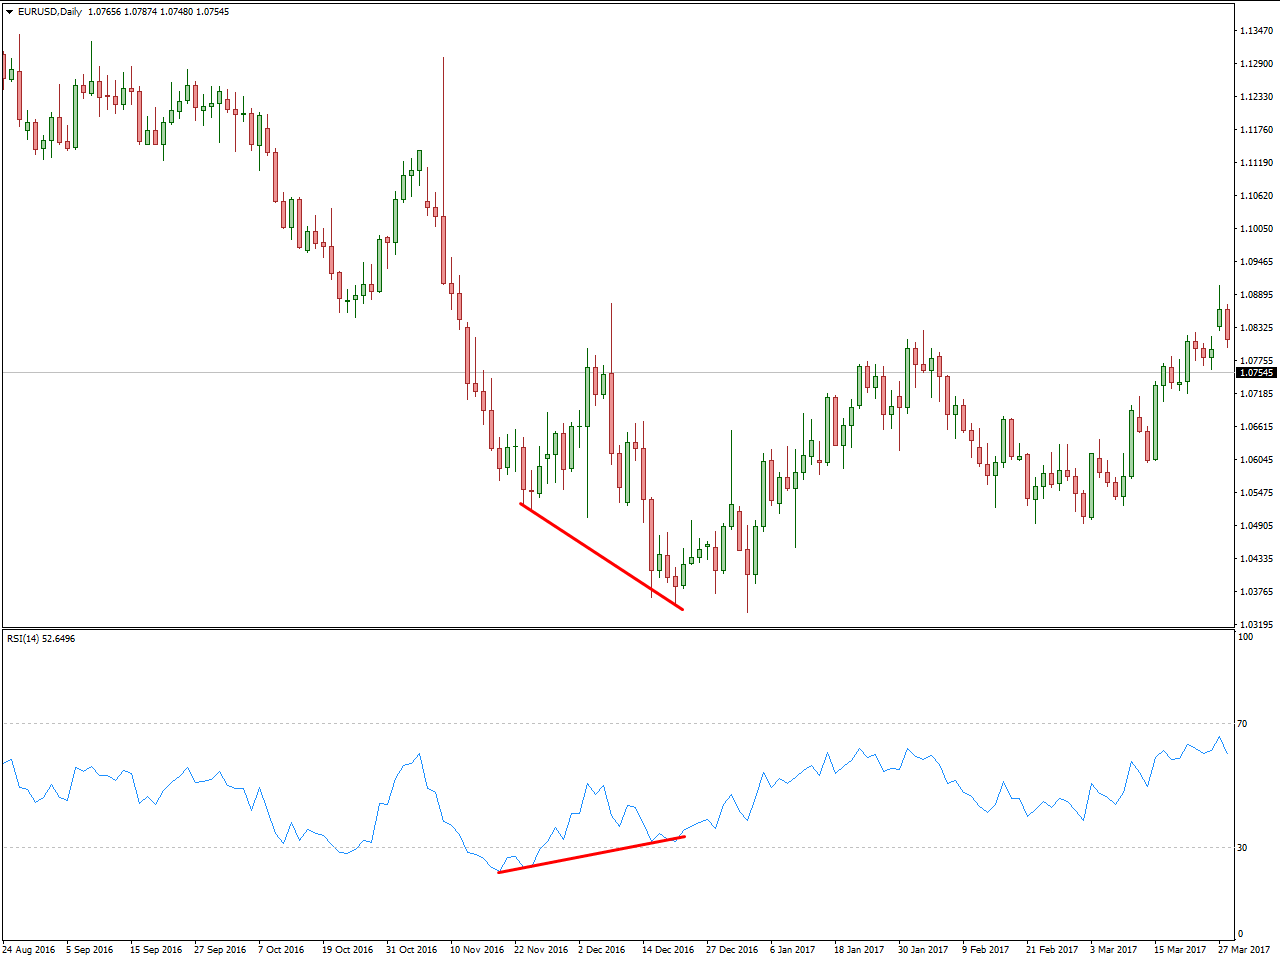
Buy when the price makes a lower low, but the RSI makes a higher low (bullish divergence), and vice versa for bearish divergence.
Confirm with other technical indicators or price patterns.
RSI Trendline Break Strategy
Time Frame: Any
RSI Period: 14
Draw trendlines on RSI connecting highs and lows.
Buy when RSI breaks above a downward trendline, and sell when RSI breaks below an upward trendline.
Confirm with price action and volume.
RSI Overbought/Oversold
Time Frame: Any
RSI Period: 14
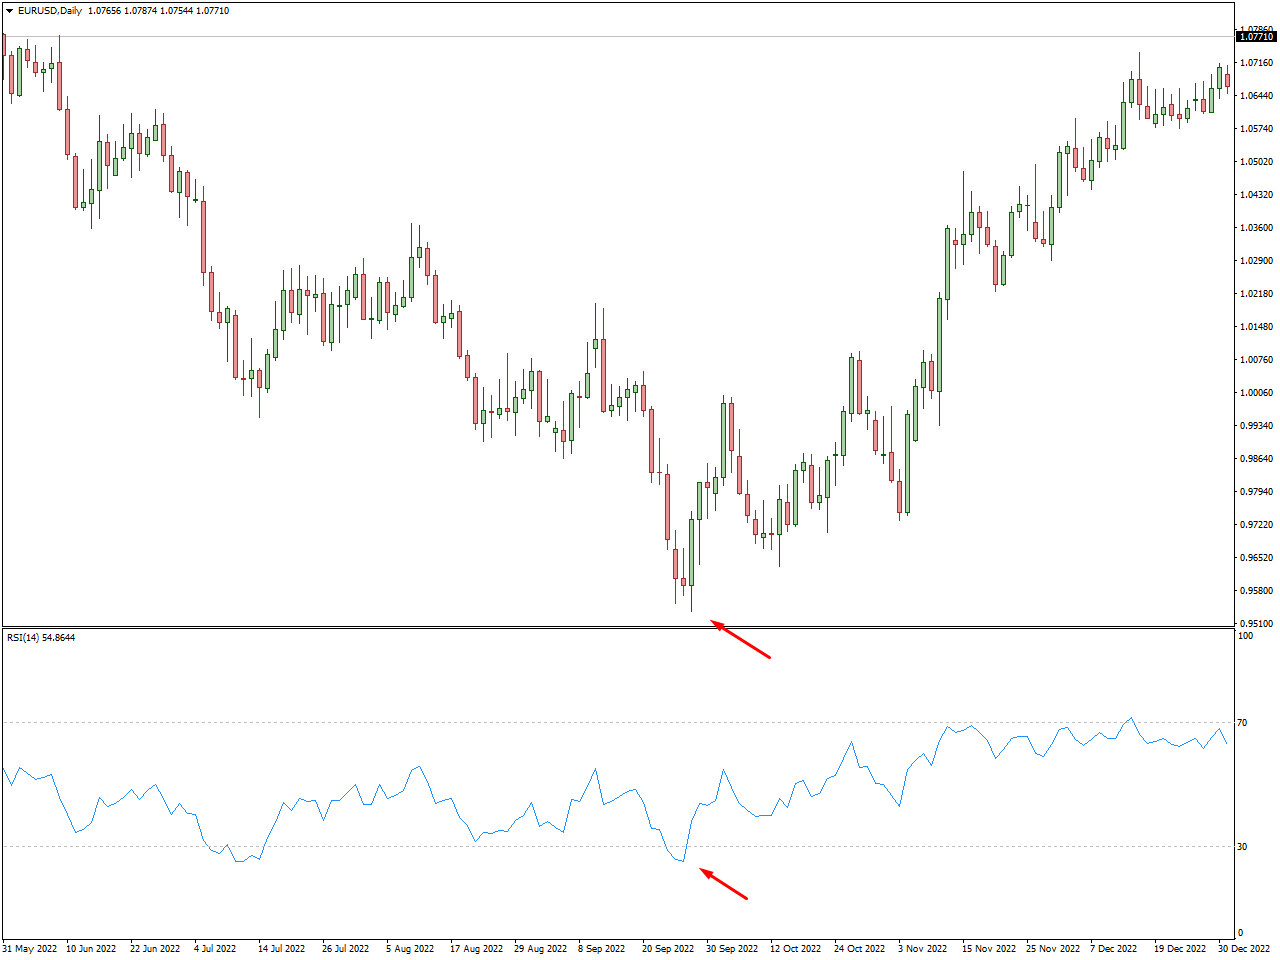
Use RSI overbought/oversold levels (e.g., 70/30) as a signal to enter trades.
Wait for price confirmation such as a candlestick pattern or a trend reversal confirmation before entering a trade.
Helps filter out false signals and increases the probability of successful trades.
Advantages of Using RSI Indicator
Identifying Overbought and Oversold Conditions: The RSI indicator provides traders with a clear signal when an asset’s price has reached extreme levels, either being overbought or oversold. By highlighting these conditions, it helps traders anticipate potential trend reversals or corrections, enabling them to make informed trading decisions. This aspect of the RSI indicator allows traders to capitalize on market inefficiencies and exploit price action resulting from shifts in market sentiment.
Divergence Signals: RSI divergence signals provide traders with early warnings of potential trend reversals, allowing them to position themselves ahead of the crowd and capitalize on emerging trends. Bullish divergence occurs when the price makes a lower low while the RSI makes a higher low, suggesting potential upward momentum. Bearish divergence occurs when the price makes a higher high while the RSI makes a lower high, suggesting potential downward momentum. By recognizing these divergence signals, traders can adjust their trading strategies accordingly and maximize profit potential.
Confirmation Tool: The RSI indicator can be used to confirm signals generated by other technical analysis tools, providing traders with additional confidence in their trading decisions. By integrating RSI analysis into their trading strategy, traders can enhance the validity and reliability of their trade setups, reducing the likelihood of false signals and increasing the probability of successful trades. This confirmation aspect adds an extra layer of assurance to trading decisions, contributing to improved trading performance.
Ease of Use: The RSI indicator is relatively simple to understand and implement, making it accessible to traders of all experience levels. Unlike more complex technical indicators, the RSI can be easily interpreted, allowing traders to quickly assess market conditions and make timely trading decisions. This ease of use facilitates efficient and effective trading, enabling traders to focus on analyzing price action and developing profitable trading strategies without getting bogged down by complicated technical concepts.
Disadvantages of Using RSI Indicator
False Signals: Despite its effectiveness in identifying overbought and oversold conditions, the RSI indicator is not immune to generating false signals, especially in choppy or range-bound markets. These false signals can lead to trading losses if not validated or filtered out using additional technical indicators or confirmation techniques. Traders should exercise caution and avoid relying solely on RSI signals without considering other factors or corroborating evidence to support their trading decisions.
Lagging Indicator: Like many other technical indicators, the RSI is a lagging indicator, meaning it relies on past price charts to generate signals. During fast-moving or volatile market conditions, the RSI may lag behind price action, resulting in delayed or untimely signals. This lagging nature of the RSI can lead to missed opportunities or late entries/exits, diminishing its effectiveness in capturing short-term price movements and potentially impacting trading performance.
Market Suitability: While the RSI indicator can be effective in certain market conditions, such as range-bound or consolidating markets, its performance may vary in trending or volatile markets. In trending markets, the RSI may generate false signals as price trends continue to strongly move in one direction, leading to trading losses for traders attempting to fade the trend based on RSI readings.
Similarly, in highly volatile markets, the RSI may produce erratic signals with little reliability, making it challenging for traders to identify actionable trading opportunities.
Subjectivity in Interpretation: Interpretation of RSI signals can vary among traders, leading to subjective analysis and potential misinterpretation of market conditions. Due to its customizable parameters and various interpretation techniques, different traders may derive different conclusions from RSI readings, resulting in conflicting signals and trading biases. To mitigate this disadvantage, traders should develop a clear and consistent methodology for interpreting RSI signals and incorporate objective criteria for validating trade setups, thereby reducing the influence of subjective biases on their trading decisions.
Conclusion
In conclusion, the Relative Strength Index offers traders a powerful tool for assessing market momentum and identifying potential trend reversals. By understanding the mechanics of the RSI indicator and optimizing settings for swing or intraday trading, traders can unlock new dimensions of profitability and confidence in their trading endeavors.
However, successful trading with the RSI indicator requires more than just following predefined settings and signals. It demands intuition, experience, and a deep understanding of market dynamics. Traders must continuously refine their skills, adapt to changing market conditions, and maintain discipline in their trading approach.
As you embark on your journey with the RSI indicator, remember that trading success is not guaranteed by any single indicator or strategy. It is the result of continuous learning, practice, and perseverance. May the insights gained from this exploration of the RSI indicator serve as a guiding beacon in your quest for trading mastery.
In addition, traders ought to factor in elements like stop-loss order, take-profit order, risk management strategies, risk-reward ratio, market volatility and liquidity, economic events, and overarching market trends to bolster their trading efficacy and attain enduring success in the ever-changing realm of financial markets.