

Navigating the fluctuations of financial markets demands adept strategies, especially in the realm of volatility. Volatility indicators serve as essential tools for traders, offering insights into market dynamics and potential currency pairs price movements. In this comprehensive guide, we delve into the world of the best volatility indicators, exploring their significance, functionality, and application in different trading scenarios. Whether you’re a seasoned trader or just starting out, understanding these indicators can enhance your ability to navigate volatile market conditions with precision and confidence.
Traders and analysts depend on an array of indicators to monitor volatility and identify ideal entry or exit points for trades. Although elevated volatility can deter risky trading, heightened apprehension during extreme market shifts can also unveil buying opportunities, presenting a fertile trading environment for seasoned investors.
Conversely, phases of subdued volatility, coupled with investor complacency, may signal frothy market conditions and potential forex market peaks.
- Moving Average Indicator
- RSI Indicator
- MACD Indicator
- Bollinger Bands Indicator
- VWAP Bands Indicator
- Ichimoku Signal Cloud
- Stochastic Oscillator
List of The Best Volatility Indicators
- Average True Range (ATR): ATR measures the average range between high and low prices over a specified period, providing insights into market volatility by accounting for gaps and limit moves. It’s particularly useful for setting stop-loss levels and determining position sizes.
- Bollinger Bands: Bollinger Bands consist of a simple moving average (SMA) with upper and lower bands plotted at a certain standard deviation from the SMA. While they typically use standard deviation in their calculation, you can still use Bollinger Bands visually without explicitly relying on standard deviation values to gauge volatility and identify potential day trading opportunities.
- Candle Volatility Index Averages : VIX measures the market’s expectation of future volatility implied by options prices on the S&P 500 index. It’s a powerful indicator of market sentiment and can help traders anticipate potential market movements. While VIX indirectly reflects standard deviation through options pricing, it provides a straightforward measure of volatility without directly using standard deviation.
- Chaikin Volatility: Chaikin Volatility calculates volatility based on the difference between a high and low price over a specific period, adjusted for volume. It reflects the rate of change of price charts and can help traders anticipate potential breakouts or reversals without relying on standard deviation.
- Average Directional Index (ADX): ADX is a technical analysis indicator used to measure the strength of a trend, not necessarily its direction. It does this by quantifying the strength of the trend regardless of whether it is up or down. Higher ADX values typically indicate a strong trend, while lower values suggest a weak trend or sideways movement. ADX doesn’t directly measure volatility but can indirectly reflect it by showing the strength of price movements.
- Keltner Channels: Keltner Channels consist of an exponential moving average (EMA) and upper and lower bands based on the average true range. They help traders identify potential trend reversals and volatility expansions. When prices move outside the Keltner Channels, it can signal potential trading opportunities.
- Chandelier Exit: Chandelier Exit is a volatility-based indicator used to set trailing stop-loss levels. It adjusts the stop-loss level based on the average true range, allowing traders to stay in a trend while also protecting their profits from excessive volatility-induced price swings.
Average True Range (ATR)
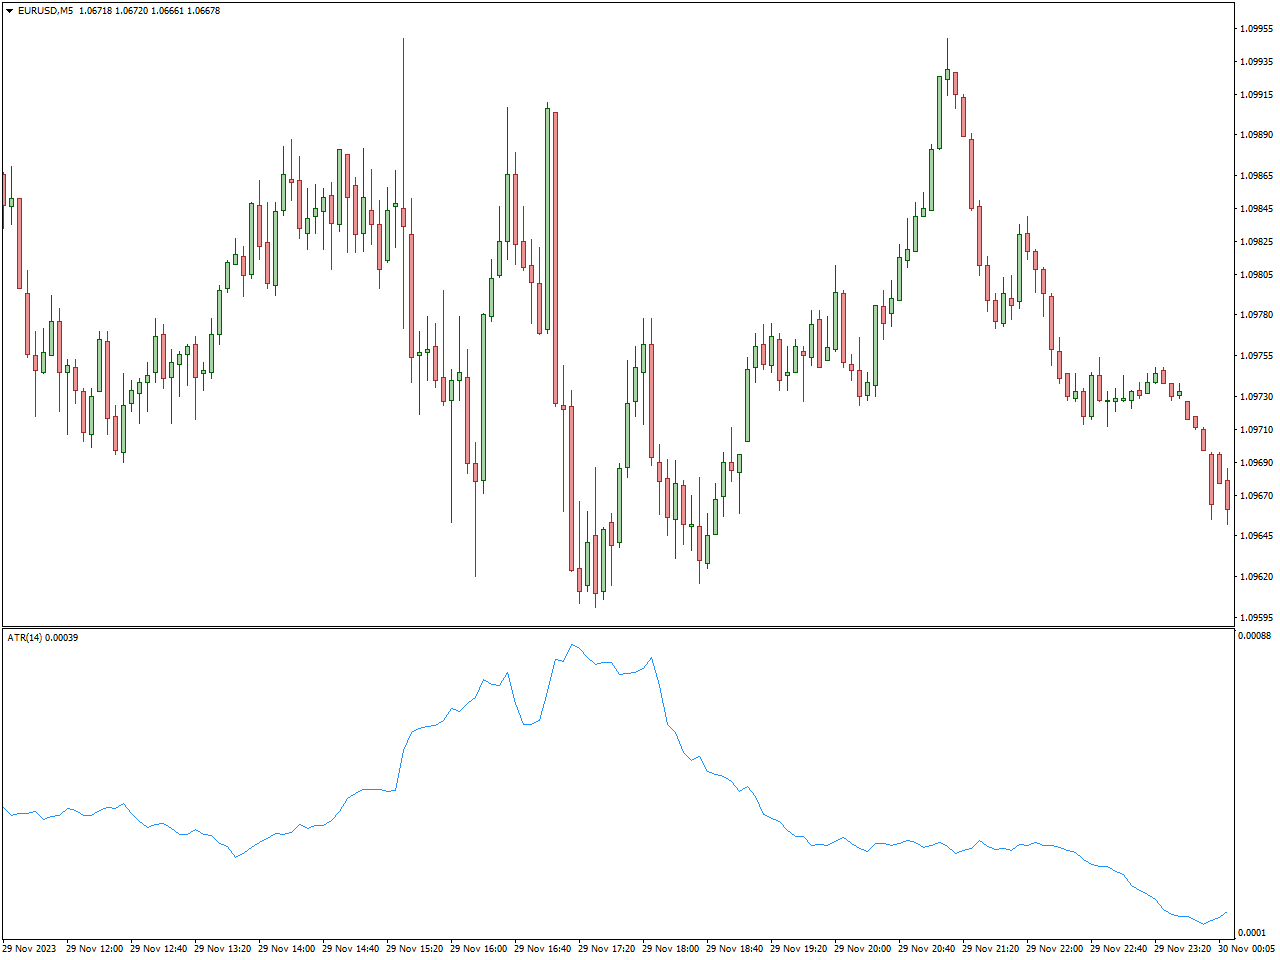
Average True Range (ATR): ATR is calculated as the exponential moving average (EMA) of the true range over a specified period. The most common period used is 14, but traders can adjust this period to suit their trading style and preferences.
ATR provides traders with insights into the level of price volatility in the forex market. Higher ATR values indicate greater volatility, while lower values suggest calmer market conditions. Traders often use ATR in conjunction with other technical indicators to confirm trends, set appropriate stop-loss levels based on volatility, and manage risk-reward ratio in their trading strategy.
For example, if the ATR value for a currency is 2.50, it means that on average, the price of the currency moves $2.50 per day. If a trader is looking to set a stop-loss level for a trade, they might use multiples of the ATR value (e.g., 1x ATR or 2x ATR) to ensure that the stop-loss level accounts for the volatility of the asset.
Overall, ATR is a valuable tool for traders seeking to assess and navigate market volatility effectively.
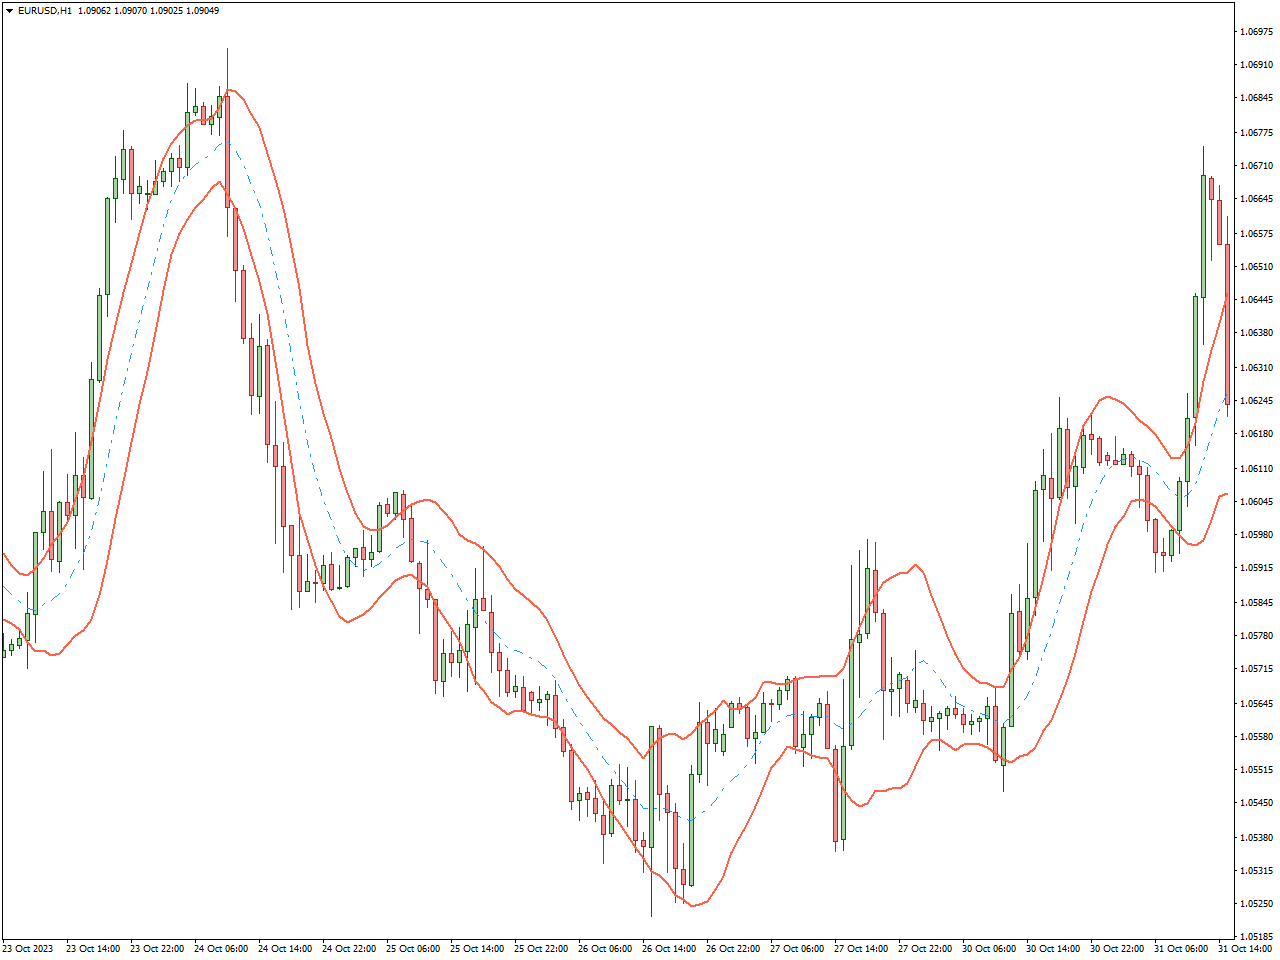
Bollinger Bands
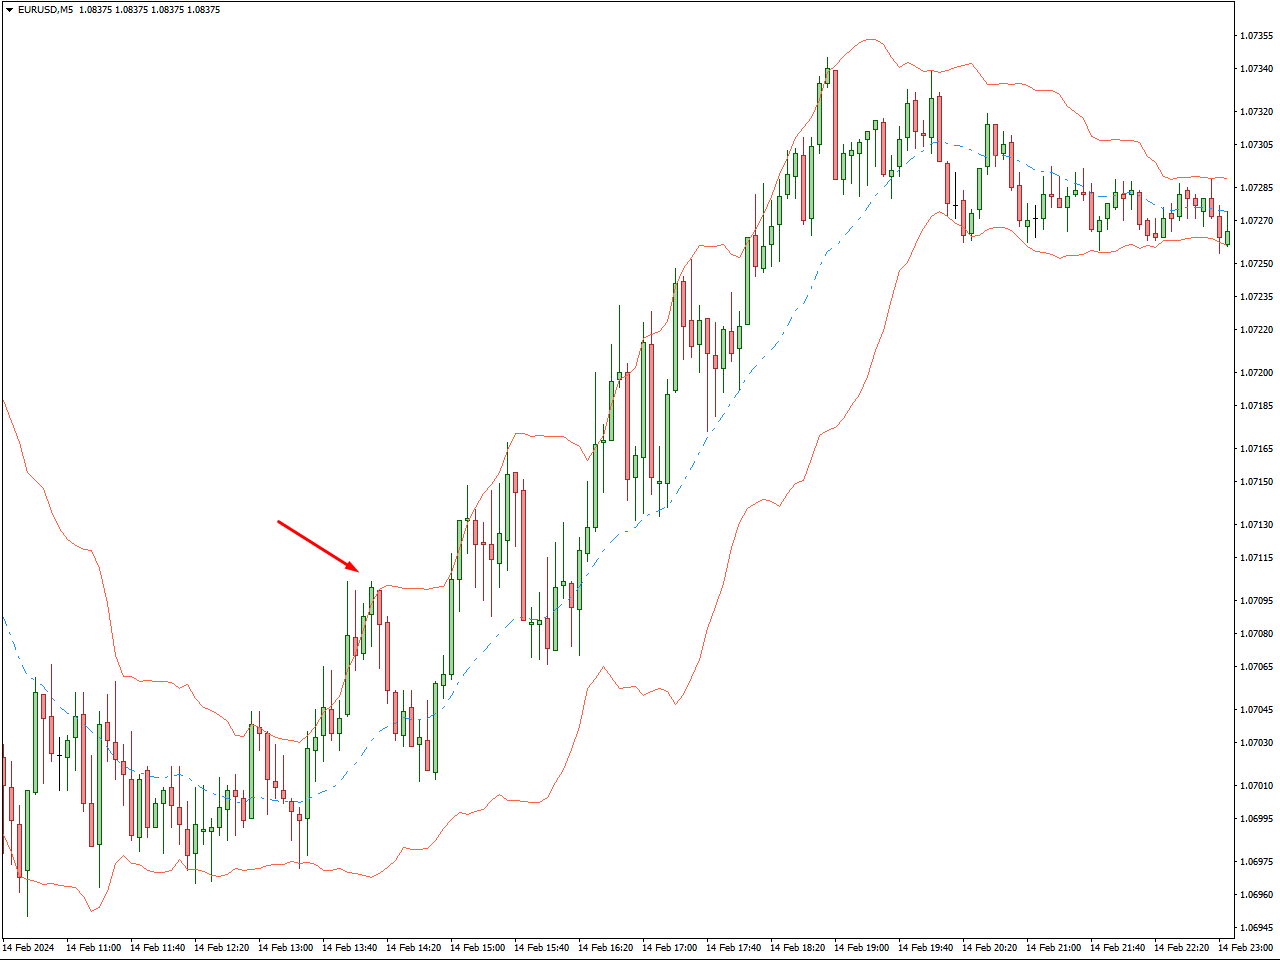
Bollinger Bands are a versatile technical analysis tool used by traders to gauge market volatility and identify potential price trends. They consist of three bands: the middle band, an upper band, and a lower band. The middle band is typically a 20-period simple moving average, while the upper and lower bands are calculated based on standard deviations from the middle band.
Traders utilize Bollinger Bands in various ways:
Volatility Assessment: Bollinger Bands visually represent volatility. Wider bands suggest higher volatility, while narrower bands indicate lower volatility.
Overbought and Oversold Conditions: When the price touches or exceeds the upper band, it may signal that the asset is overbought, potentially indicating a reversal. Conversely, when the price touches or falls below the lower band, it may suggest oversold conditions and a possible bounce back.
Trend Identification: Bollinger Bands can help traders identify trends. Consistent trading above the middle band may indicate an uptrend, while trading below the middle band may suggest a downtrend.
Breakout Confirmation: Breakouts occur when the price moves outside the bands, indicating a potential continuation or reversal of the trend. Traders often look for confirmation signals, such as increased volume, to validate breakouts.
Candle Volatility Index Averages
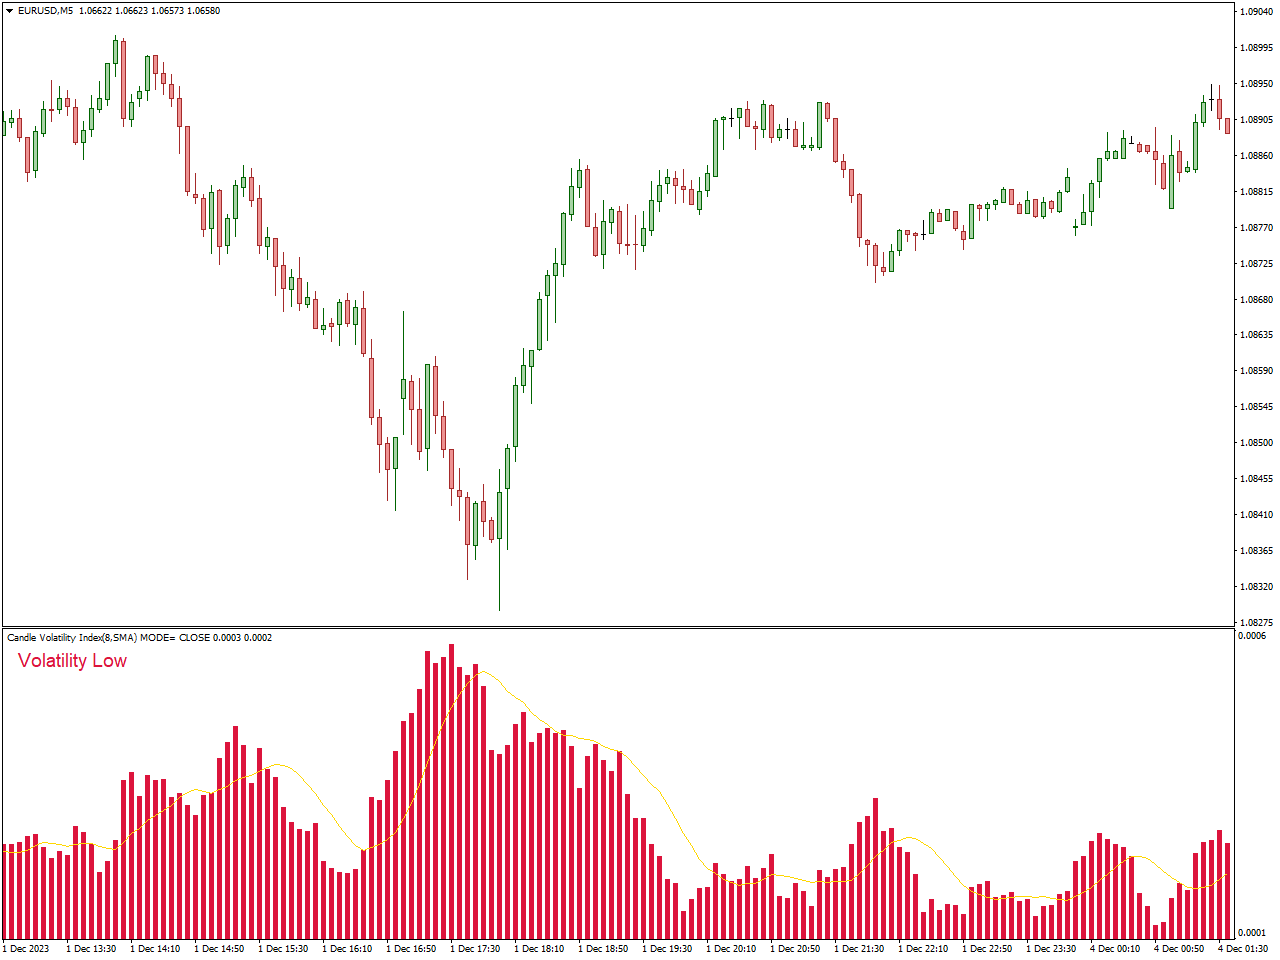
The Candle Volatility Index Averages (CVIA) is a metric used in financial analysis to assess the average volatility of candlestick patterns within a designated time frame. It provides a quantitative measure of the price fluctuations observed in an asset over a specific period. Calculating CVIA involves determining the range of price movements for each candlestick within the chosen timeframe and then averaging these ranges to derive the overall volatility index.
Traders utilize CVIA to gain insights into market volatility, aiding in the identification of potential trading opportunities, setting money management parameters such as stop-loss orders, and determining optimal position sizes. A higher CVIA suggests increased market volatility, while a lower value indicates relatively stable market conditions.
By incorporating CVIA into their analysis, traders can better adapt to changing market environments and make more informed trading decisions based on the prevailing level of price volatility.
Chaikin Volatility
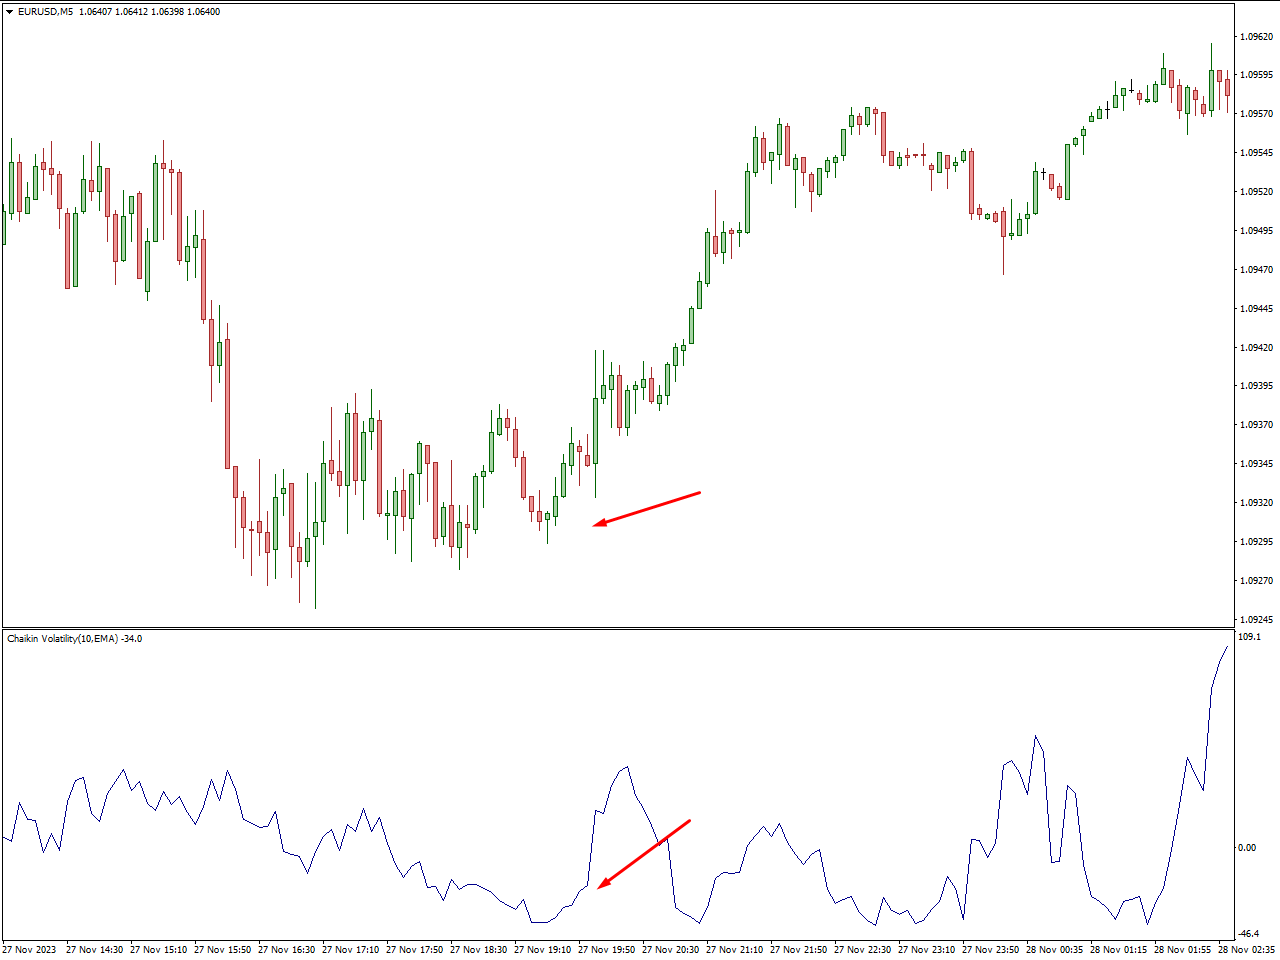
Chaikin Volatility, developed by Marc Chaikin, is a technical indicator utilized by traders to evaluate intraday market volatility. Unlike some other measures, it incorporates both price action and trading volume in its analysis, providing a more comprehensive view of market dynamics.
Traders rely on Chaikin Volatility to:
Assess Volatility: It helps gauge the level of market volatility, with higher values indicating increased price variability and lower values suggesting calmer conditions.
Confirm Trends: Changes in Chaikin Volatility can confirm trends, with rising volatility potentially signaling the continuation or initiation of a trend, while decreasing volatility may hint at a trend reversal or consolidation.
Confirm Breakouts: Traders use Chaikin Volatility to validate breakouts, with a significant increase in volatility accompanying a breakout indicating its strength and potential for further movement.
Chaikin Volatility serves as a valuable tool for traders seeking deeper insights into market behavior and making well-informed trading decisions based on changes in volatility.
Average Directional Index (ADX)
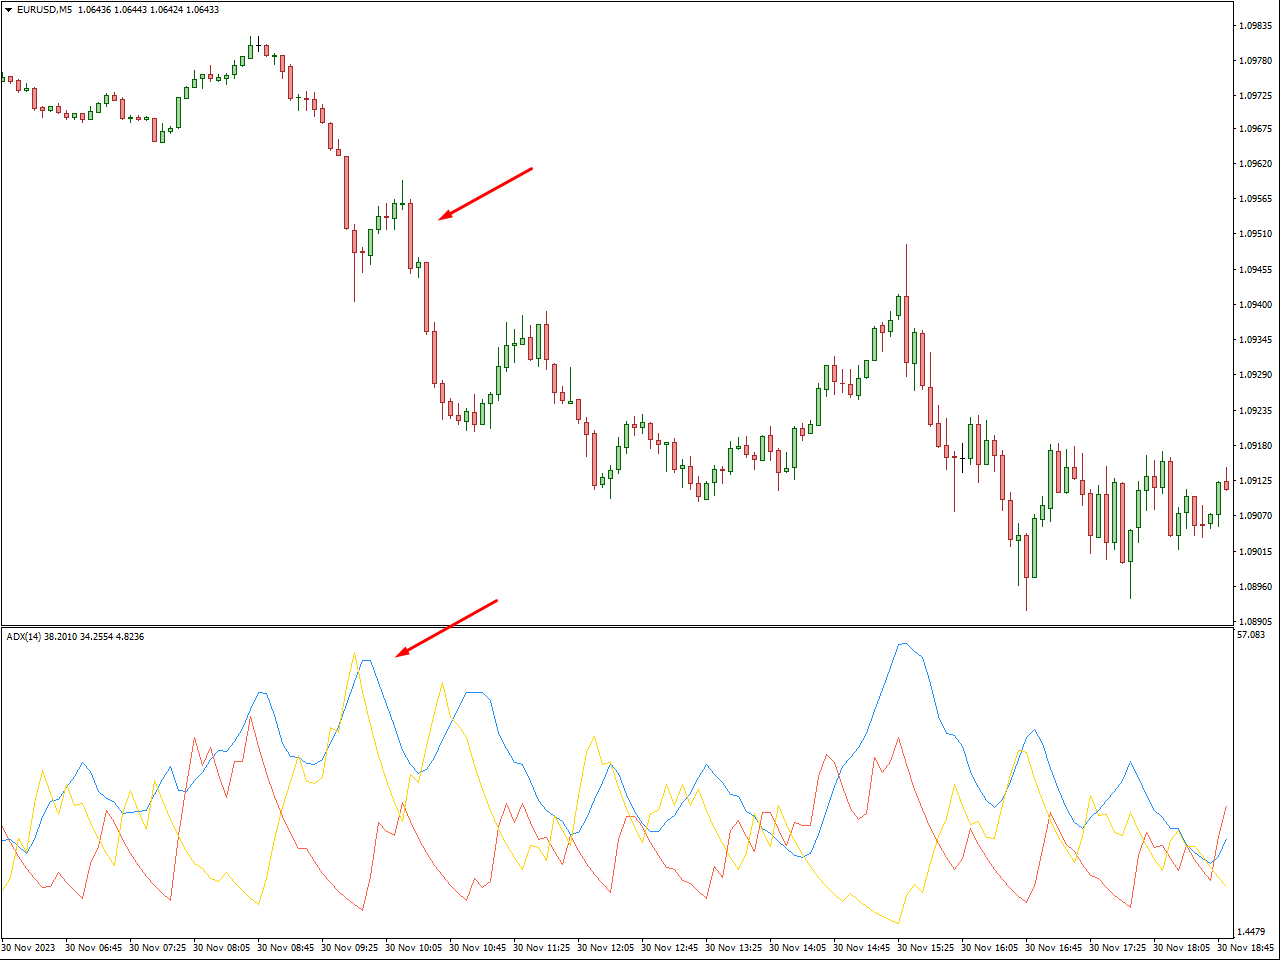
The Average Directional Index (ADX) is a technical indicator that traders use to assess the strength and direction of a daily market trend. Developed by J. Welles Wilder, it’s a vital component of technical analysis.
Traders utilize the ADX in various ways:
Trend Strength Assessment: ADX values range from 0 to 100, with higher values indicating stronger trends. Traders typically consider an ADX above 25 or 30 as significant, signaling a robust trend.
Trend Direction Determination: The ADX helps traders identify the direction of the trend. A rising ADX indicates increasing trend strength, regardless of whether it’s an bullish or bearish trend.
Trend Confirmation: Traders often use the ADX alongside other indicators to confirm the presence of a trend. For example, a rising ADX alongside higher highs in prices during an uptrend reinforces confidence in the trend.
Identification of Rangebound Markets: Besides trend analysis, the ADX can identify periods of consolidation or sideways movement. A low and flat ADX suggests a lack of a strong trend, indicating a sideways market.
Keltner Channels
Keltner Channels, developed by Chester W. Keltner, are a technical analysis tool used by traders to assess market trends, volatility, and potential trading opportunities. They consist of three lines: the middle line, upper channel line, and lower channel line.
The middle line is typically an exponential moving average (EMA) of the asset’s price over a specified period. The upper channel line is calculated by adding a multiple of the Average True Range (ATR) to the middle line, representing potential resistance levels. Conversely, the lower channel line is calculated by subtracting a multiple of the ATR from the middle line, indicating potential support levels.
Traders utilize Keltner Channels to identify trends by observing the slope of the middle line, with an upward slope suggesting an uptrend and a downward slope indicating a downtrend. They also use Keltner Channels to identify overbought and oversold conditions, as prices moving outside the channel lines may signal potential reversals. Additionally, breakouts occur when prices move outside the channel lines, providing traders with potential trading opportunities.
Chandelier Exit
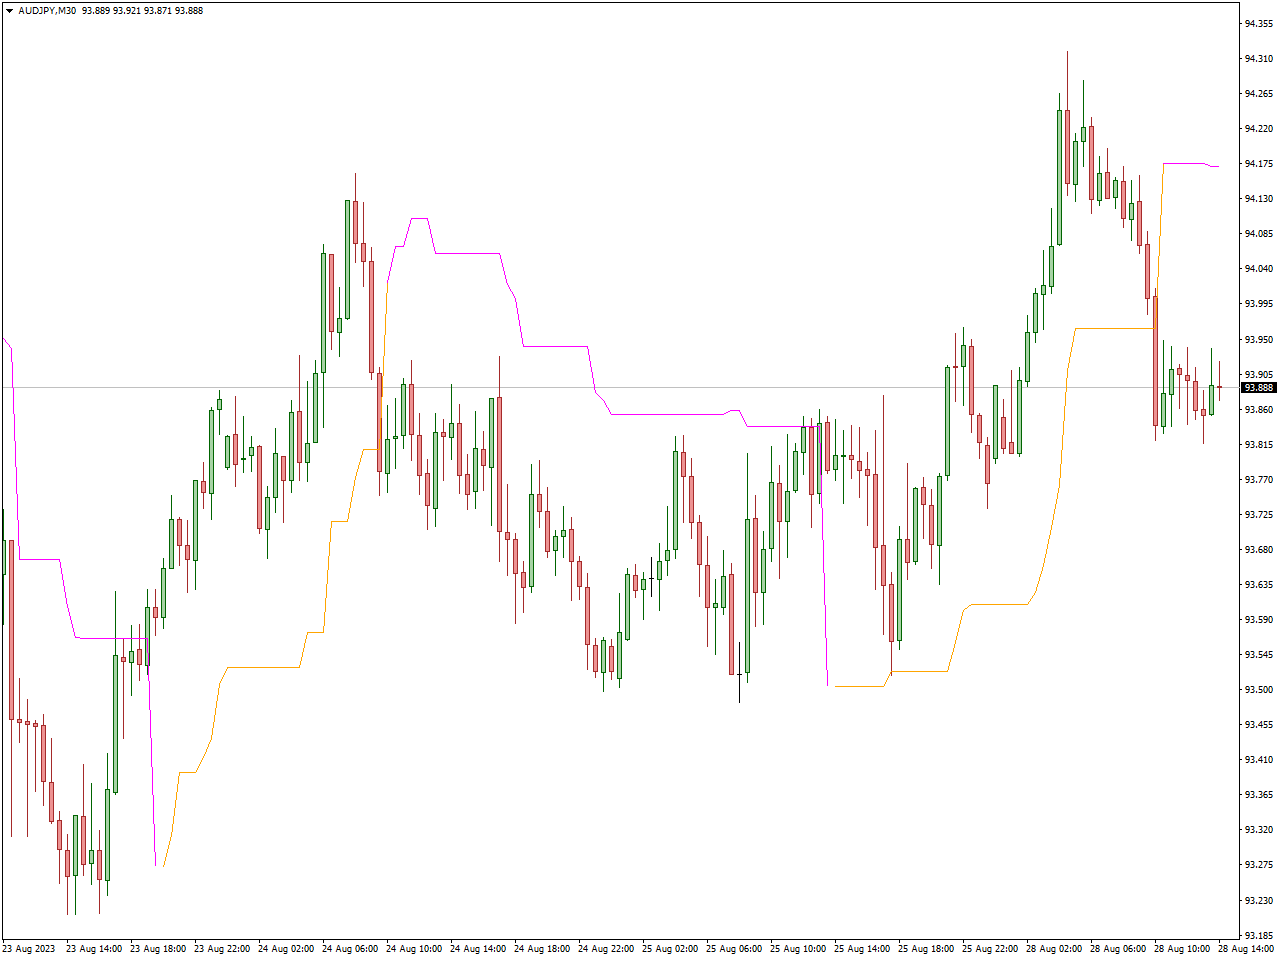
The Chandelier Exit is a volatility-based indicator developed by Chuck LeBeau. It’s primarily used to set trailing stop-loss orders for long and short position based on market volatility.
Rather than using a fixed percentage or point-based stop-loss, the Chandelier Exit adjusts the stop-loss level dynamically according to the recent high or low prices and a multiple of the Average True Range (ATR).
For long position, the Chandelier Exit is calculated by subtracting a multiple of the ATR from the highest high observed during a specified lookback period. This level serves as the trailing stop-loss, moving higher as the price increases but remaining below recent highs.
Conversely, for short positions, the Chandelier Exit is calculated by adding a multiple of the ATR to the lowest low observed during the lookback period. This level acts as the trailing stop-loss order, moving lower as the price decreases but staying above recent lows.
Conclusion
In the ever-shifting landscape of financial markets, volatility indicators emerge as invaluable allies for traders seeking to navigate uncertainty and capitalize on price movements. By incorporating the best volatility indicators highlighted in this guide into your trading arsenal, you gain a deeper understanding of market dynamics and enhance your ability to identify profitable opportunities. Remember, mastering volatility requires a combination of knowledge, experience, and adaptability. Continuously refine your skills, experiment with different indicators, and remain vigilant in monitoring market conditions to maximize your trading success in volatile environments.