
Navigating the world of scalping trading demands precision and effective decision-making. The right indicators can make all the difference, offering insights into market movements and trends within these short timeframes. In this comprehensive guide, we delve into the realm of the best indicators tailored specifically for 5-minute charts. Whether you’re a seasoned trader or just starting out, understanding these indicators can enhance your trading strategy and potentially boost your success in this dynamic market environment.
5-minute price charts provide traders with a snapshot of an asset’s market activity every 5 minutes during a specific trading session. With the main market session lasting 6.5 hours per day, a 5-minute chart typically encompasses 70 five-minute bars for a complete trading session. Intraday traders favor 5-minute charts because they allow for precise identification of short-term trends, facilitating the execution of their preferred trading strategies.
Moreover, 5-minute charts cater to momentum traders who anticipate significant price action to capitalize on favorable directional shifts. These traders closely monitor market momentum and exit positions when signs of weakening emerge to safeguard their profits. The 5-minute chart serves as a crucial tool for implementing reliable exit strategies, ensuring momentum traders can effectively manage their trades.
- Moving Average Indicator
- RSI Indicator
- MACD Indicator
- Bollinger Bands Indicator
- VWAP Bands Indicator
- Ichimoku Signal Cloud
- Stochastic Oscillator
Top 7 indicators optimized for 5-minute charts
These indicators play a crucial role in identifying bullish or bearish signals, determining optimal entry and exit points for both long positions and short positions. Also do not forget about risk management strategies, including the implementation of stop-loss and take-profit orders, essential tools for safeguarding capital and maximizing profitability in the fast-paced environment of forex daily trading.
- Moving Averages (MA): Moving averages, especially shorter-term ones like the 5-period or 10-period MA, can help identify trends and potential entry or exit points. Traders often use crossovers between different MAs to signal changes in trend direction.
- Relative Strength Index (RSI): RSI is a momentum oscillator that measures the speed and change of price movements. It’s useful for identifying overbought or oversold conditions, which can signal potential reversals or continuation of trends.
- MACD (Moving Average Convergence Divergence): MACD combines moving averages to identify changes in trend momentum. Traders look for MACD line crossovers and divergences between MACD and price to signal potential buy or sell opportunities.
- Bollinger Bands: Bollinger Bands consist of a middle band (typically a 20-period simple moving average) and upper and lower bands that represent volatility levels. Traders use Bollinger Bands to identify potential overbought or oversold conditions and anticipate price reversals or breakouts.
- VWAP Bands Indicator: VWAP Bands is a powerful tool for analyzing intraday price chart, including on 5-minute charts. VWAP calculates the average price weighted by trading volume over a specified period, typically the trading day.
- Ichimoku Cloud: This indicator offers insights into support/resistance, trend direction, and momentum. The standard parameters include Conversion Line (9), Base Line (26), and Leading Span A and B (52). Adjustments may be necessary for quicker signals on a 5-minute chart.
- Stochastic Oscillator: Similar to RSI, the stochastic oscillator identifies overbought and oversold levels. Parameters like 5, 3, 3 can be suitable for 5-minute charts.
Moving Average Indicator
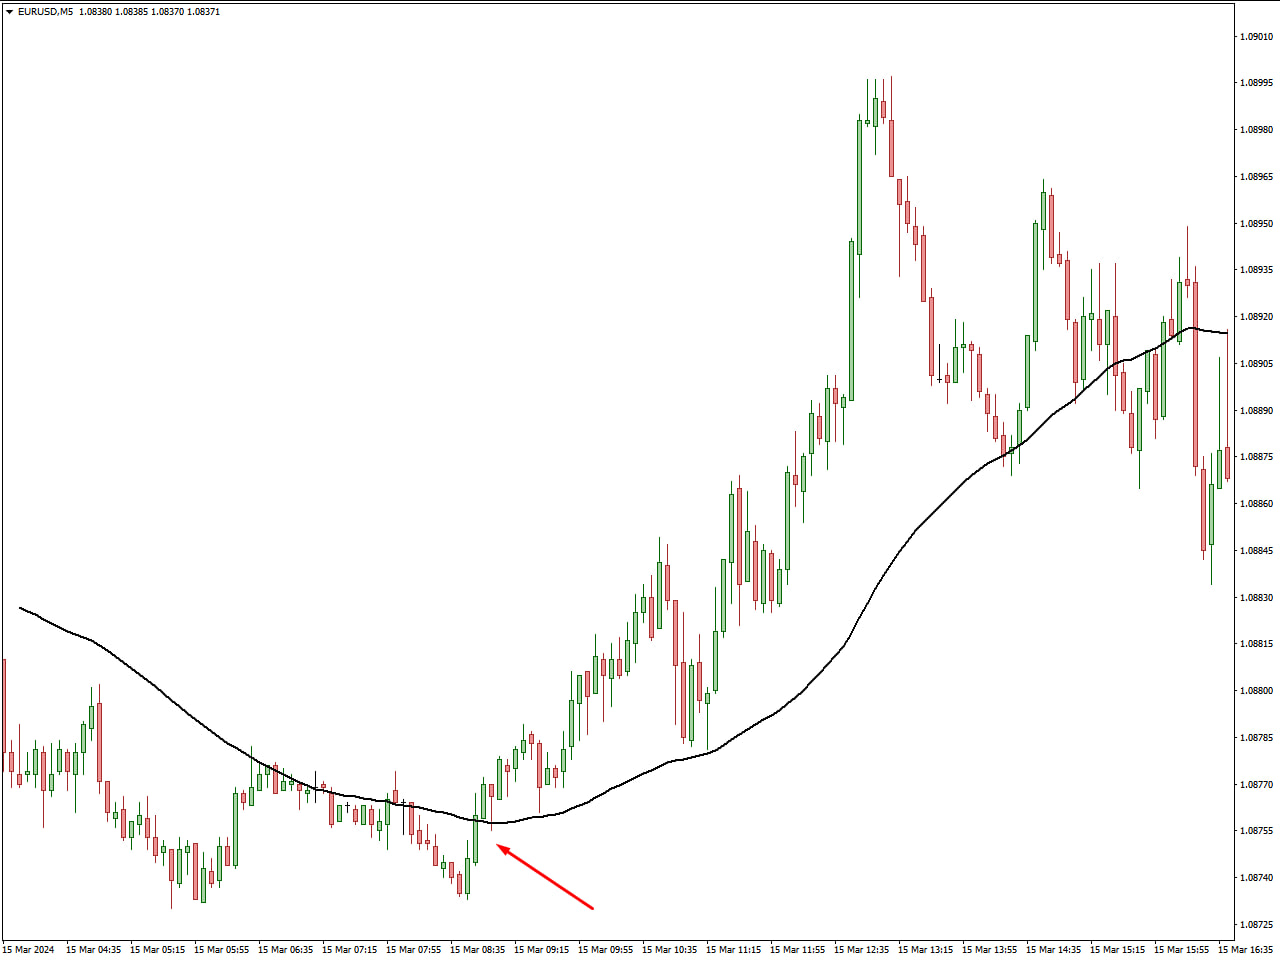
Utilizing moving averages on a 5-minute chart is a common strategy employed by traders to identify trends and potential entry or exit points within short timeframes. Moving averages, which smooth out price data over a specified period, offer valuable insights into the direction and strength of price movements. On a 5-minute chart, traders often employ shorter-term moving averages, such as the 5-period or 10-period moving averages, to capture rapid price changes and fluctuations.
The moving average on a 5-minute chart serves as a dynamic trend-following tool, helping traders discern the prevailing market direction amid the noise of intraday price action. When the price is above the moving average, it suggests a bullish trend, indicating potential buying opportunities. Conversely, when the price falls below the moving average, it signals a bearish trend, prompting traders to consider selling or shorting opportunities. By aligning trades with the direction of the moving average, traders aim to capitalize on short-term price movements and maximize profitability.
In addition to identifying trend direction, moving averages on a 5-minute chart can also act as dynamic support and resistance levels. During uptrends, the moving average may serve as a level of support, where price tends to bounce off and continue its upward trajectory. Conversely, in downtrends, the moving average can act as a resistance level, capping upward price movements. By incorporating moving averages into their trading strategy on a 5-minute chart, traders can effectively manage risk, identify optimal entry and exit points, and enhance their overall trading performance in the fast-paced environment of intraday trading.
RSI Indicator
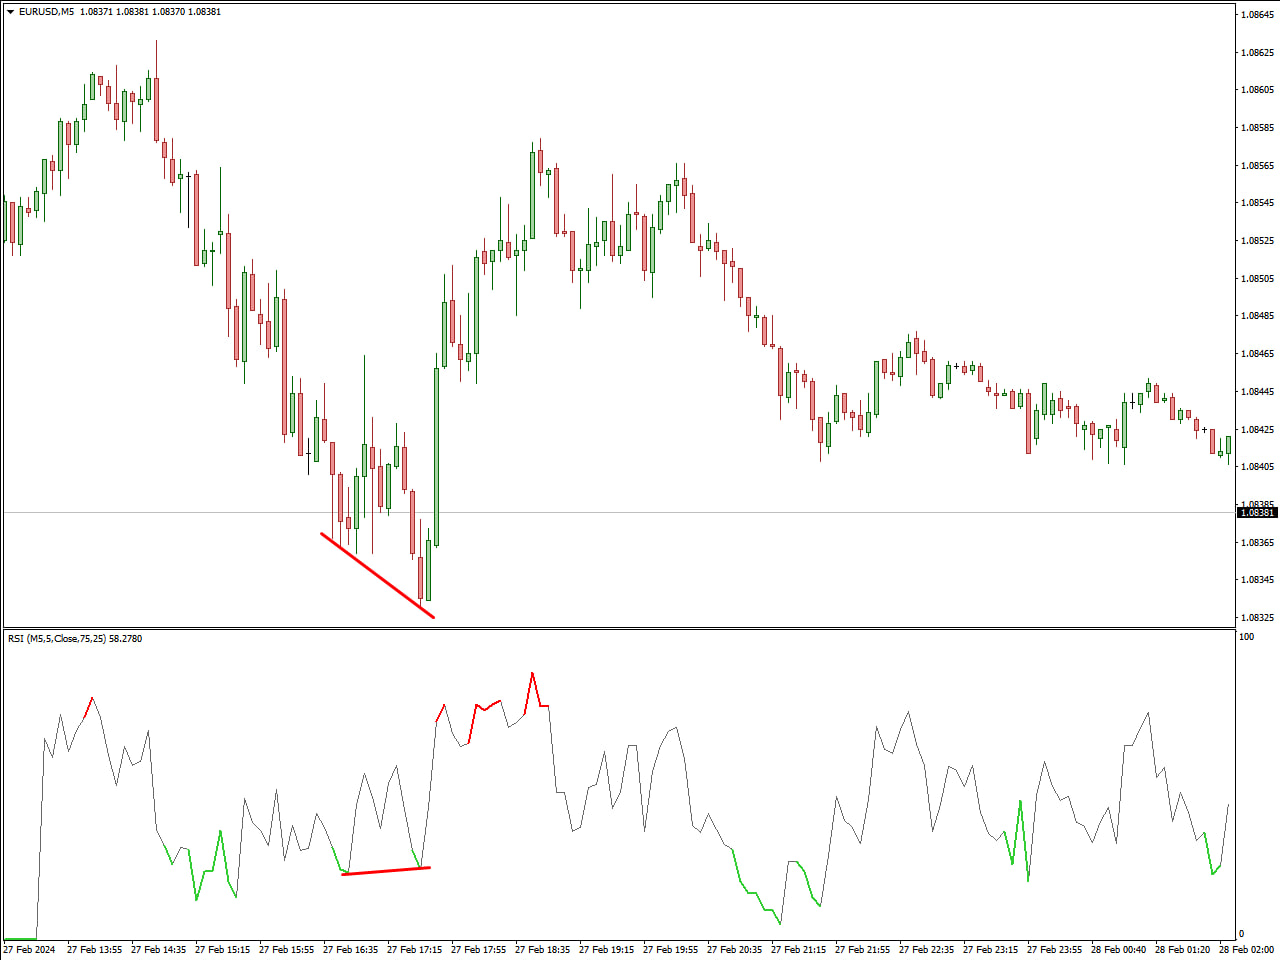
Employing the Relative Strength Index (RSI) on a 5-minute chart is a prevalent technique among traders seeking to gauge overbought and oversold conditions within short timeframes. RSI, a momentum oscillator, measures the speed and change of price movements, providing insights into the strength of price momentum. On a 5-minute chart, traders typically utilize RSI to identify potential reversal points and anticipate shifts in market sentiment.
When the RSI indicates an overbought condition, usually above 75, it suggests that the asset may be due for a pullback or reversal. Conversely, an oversold condition, typically below 25, indicates that the asset may be undervalued and poised for a rebound. By incorporating RSI signals into their trading strategy on a 5-minute chart, traders can identify opportune moments to enter or exit trades, capitalizing on short-term price movements.
Furthermore, RSI on a 5-minute chart can serve as a valuable confirmation tool when combined with other technical indicators. For instance, traders may look for divergence between RSI and price movements to validate potential trend reversals. Additionally, RSI can complement moving averages or trendlines, providing additional confirmation of trend strength or weakness. By integrating RSI analysis into their trading approach on a 5-minute chart, traders can enhance their decision-making process, manage risk effectively, and optimize their trading outcomes in the dynamic world of intraday trading.
MACD Indicator
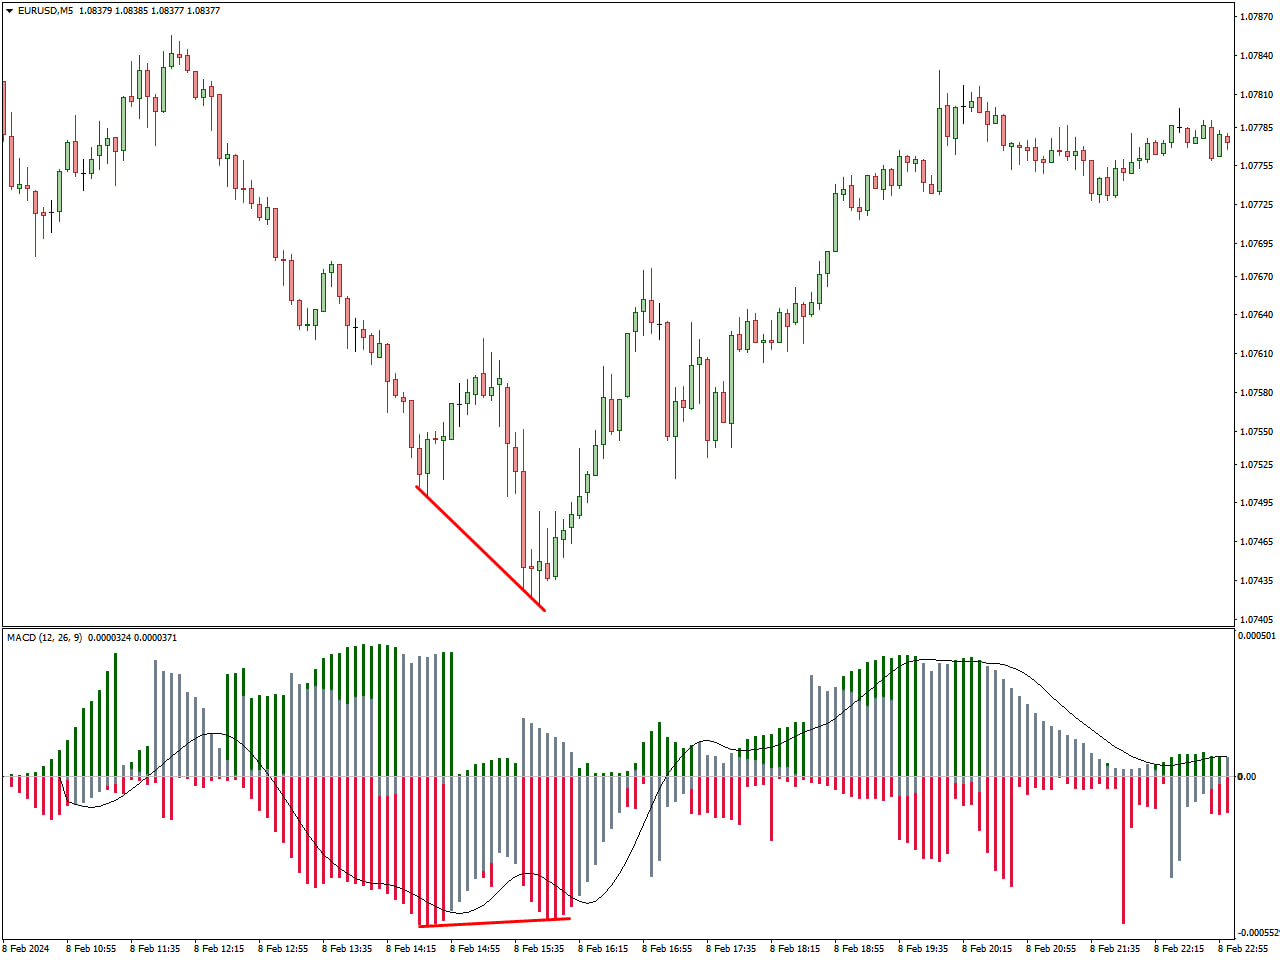
Applying the Moving Average Convergence Divergence (MACD) indicator on a 5-minute chart is a popular method among traders for identifying changes in momentum and potential entry or exit points within short timeframes. MACD, a versatile trend-following indicator, consists of two main components: the MACD line and the Signal line. Traders often look for crossovers between these lines to generate buy or sell signals.
On a 5-minute chart, traders typically adjust the settings of the MACD indicator to suit the rapid price fluctuations characteristic of short-term trading. Common settings may include a 12-period fast Exponential Moving Average (EMA) for the MACD line, a 26-period slow EMA for the Signal line, and a 9-period EMA for the Signal line smoothing.
When the MACD line crosses above the Signal line, it indicates bullish momentum, suggesting potential buying opportunities. Conversely, when the MACD line crosses below the Signal line, it signals bearish momentum, prompting traders to consider selling or shorting opportunities. Additionally, traders often monitor the distance between the MACD line and the Signal line to assess the strength of momentum shifts.
Moreover, traders can use the MACD histogram, which represents the difference between the MACD line and the Signal line, to visualize changes in momentum more clearly. Positive histogram bars indicate increasing bullish momentum, while negative bars signify increasing bearish momentum. By integrating MACD analysis into their trading strategy on a 5-minute chart, traders can identify trends, anticipate reversals, and make informed decisions to capitalize on short-term price movements effectively.
Bollinger Bands Indicator
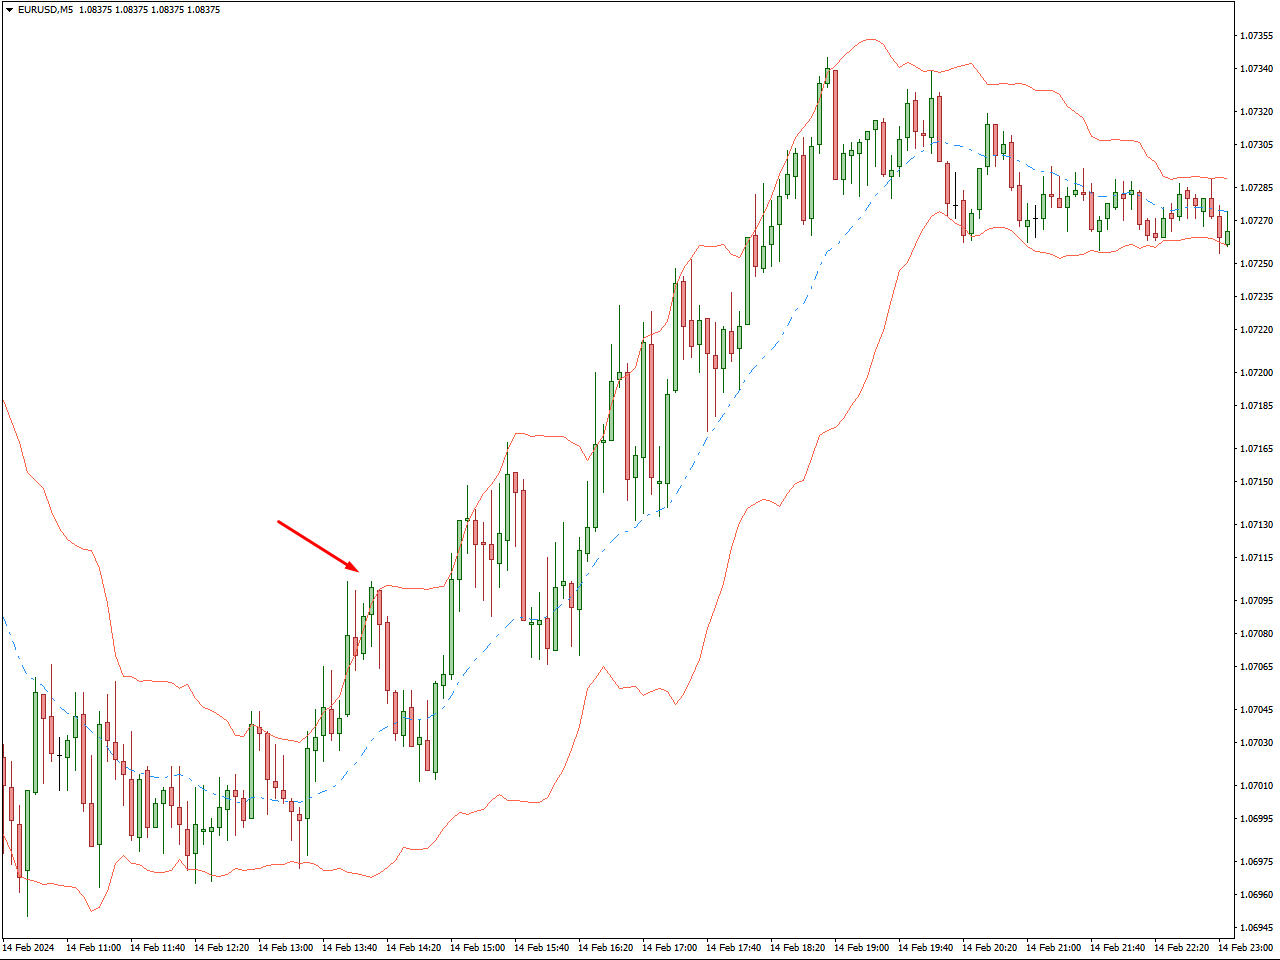
Implementing the Bollinger Bands indicator on a 5-minute chart is a widely embraced approach among traders seeking to discern volatility and potential price reversals within short timeframes. Developed by John Bollinger, this indicator consists of three bands: a middle band representing a simple moving average (typically calculated over a 20-period), and upper and lower bands that are derived from adding and subtracting a certain multiple of the standard deviation from the middle band.
On a 5-minute chart, traders typically adjust the parameters of the Bollinger Bands to accommodate the rapid price fluctuations inherent in intraday trading. Common settings may involve using a 20-period moving average for the middle band and setting the standard deviation multiplier to 2, indicating that the upper and lower bands are two standard deviations away from the middle band.
Bollinger Bands offer traders insights into the volatility and potential overbought or oversold conditions of an asset. When prices move closer to the upper band, it may suggest overbought conditions, while prices nearing the lower band may indicate oversold conditions. Additionally, traders often observe periods of price consolidation when the bands contract and anticipate potential breakout opportunities when the bands expand.
Furthermore, traders may use Bollinger Bands in conjunction with other technical indicators, such as the Relative Strength Index (RSI) or Moving Average Convergence Divergence (MACD), to validate trading signals and enhance decision-making. By incorporating Bollinger Bands analysis into their strategy on a 5-minute chart, traders can effectively identify price extremes, anticipate trend reversals, and optimize their trading outcomes in the dynamic environment of intraday trading.
VWAP Bands Indicator
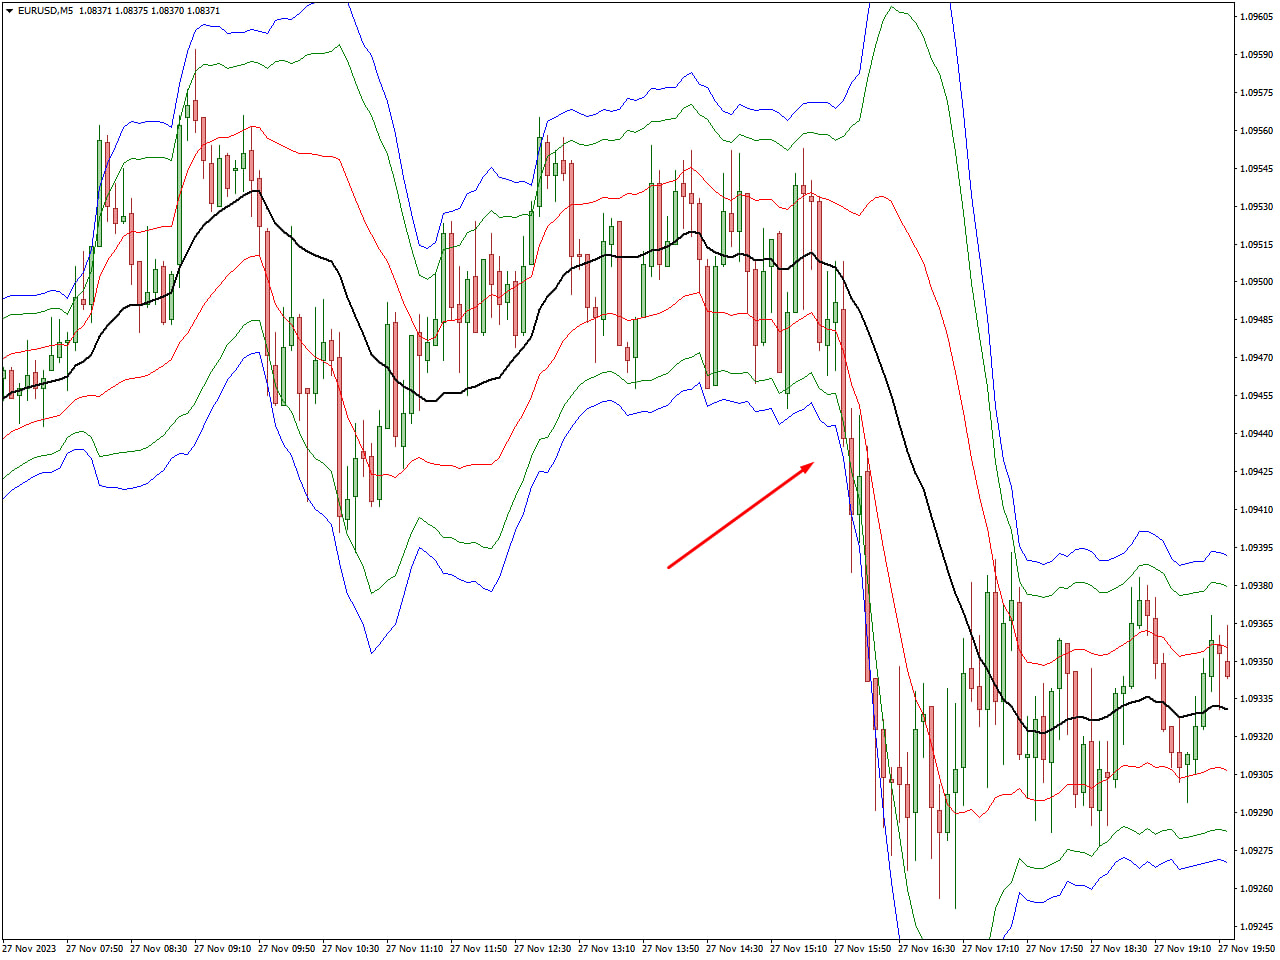
Integrating the VWAP Bands Indicator into a 5-minute chart is a widely practiced technique among traders aiming to assess price trends in relation to trading volume within short timeframes. VWAP, or Volume Weighted Average Price, serves as the cornerstone of this indicator, enabling traders to scrutinize price movements with respect to the volume traded.
VWAP Bands consist of seven lines plotted on a price chart: the VWAP line itself, an upper bands denoting a certain multiple of the standard deviation above the VWAP, and a lower bands indicating a certain multiple of the standard deviation below the VWAP. These bands function as indicators for pinpointing potential overbought or oversold conditions and evaluating the resilience of a price trend.
Traders commonly leverage VWAP Bands to make well-informed decisions regarding potential trend reversals, market entry or exit points, and to assess prevailing market sentiment. The dynamic interaction between price and VWAP Bands yields valuable insights into the market’s perception of value, rendering it an invaluable tool for technical analysis, particularly in the realm of intraday trading on a 5-minute chart.
Ichimoku Signal Cloud
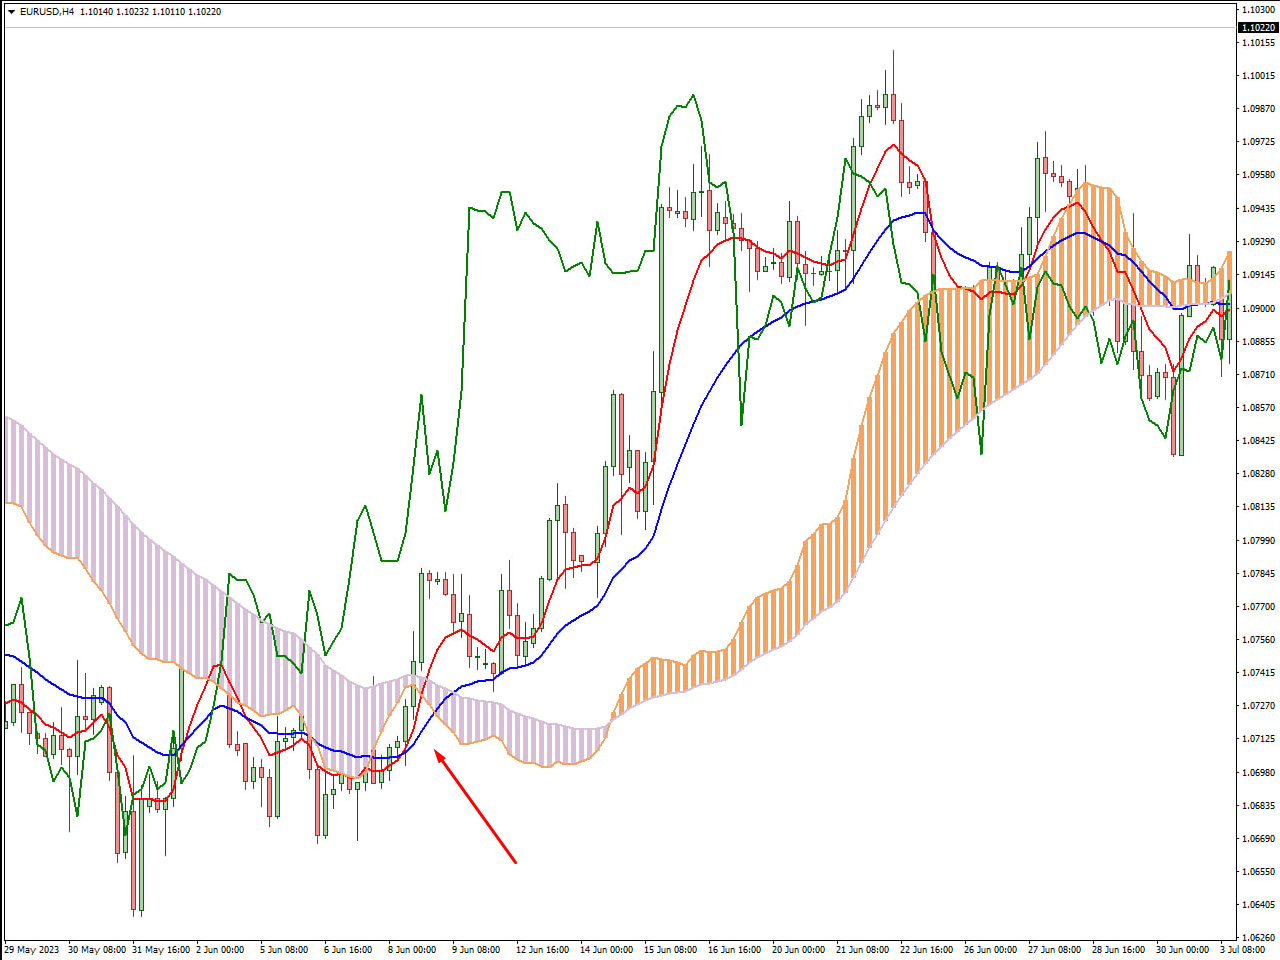
The Ichimoku Cloud, also known as the Ichimoku Kinko Hyo, is a versatile technical analysis tool originating from Japan. It consists of several components, one of which is the “Signal Cloud” or “Kumo” in Japanese. The Kumo is arguably the most distinctive feature of the Ichimoku Cloud indicator.
The Signal Cloud is formed by two lines, known as Senkou Span A and Senkou Span B, which are projected forward on the chart. Senkou Span A is calculated by averaging the Tenkan-sen (Conversion Line) and Kijun-sen (Base Line) and plotting the result 26 periods ahead. Senkou Span B is determined by averaging the highest high and lowest low over the past 52 periods and plotted 26 periods ahead. The area between Senkou Span A and Senkou Span B creates the Signal Cloud.
The Signal Cloud serves as a dynamic support and resistance zone. When the price is above the Cloud, it indicates a bullish trend, and the Cloud acts as a potential support level. Conversely, when the price is below the Cloud, it suggests a bearish trend, and the Cloud may act as resistance. Additionally, the thickness and color of the Cloud can provide further insights into market sentiment and trend strength. Traders often look for price breaks or bounces at the edges of the Cloud to confirm trading signals and make informed decisions. Overall, the Ichimoku Signal Cloud is a powerful tool for identifying trend direction, support and resistance levels, and potential entry or exit points in the market.
Stochastic Oscillator
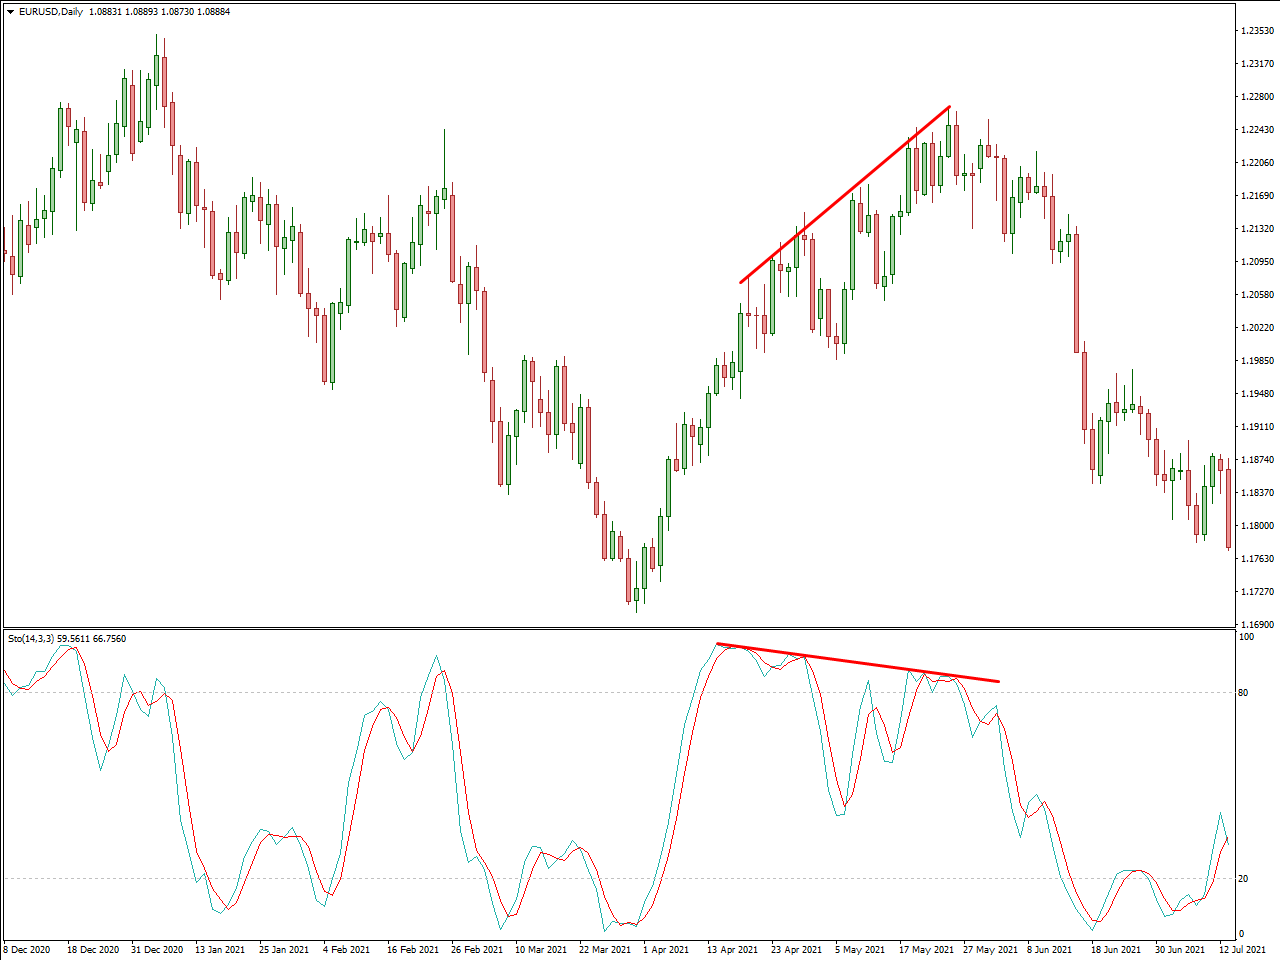
The Stochastic Oscillator is a popular momentum indicator used by traders to identify potential trend reversals and overbought or oversold conditions in the market. Developed by George C. Lane in the late 1950s, the Stochastic Oscillator compares the closing price of an asset to its price range over a specified period, typically 14 periods.
The Stochastic Oscillator consists of two lines: the %K line and the %D line. The %K line represents the current price position relative to the high-low range over the specified period, while the %D line is a moving average of the %K line, usually calculated over 3 periods.
Traders interpret the Stochastic Oscillator by looking for crossovers, divergences, and extreme readings. When the %K line crosses above the %D line, it indicates bullish momentum, suggesting potential buying opportunities. Conversely, when the %K line crosses below the %D line, it signals bearish momentum, prompting traders to consider selling or shorting opportunities.
Moreover, the Stochastic Oscillator generates overbought and oversold signals when it reaches extreme levels, typically above 80 for overbought conditions and below 20 for oversold conditions. Traders may use these signals to anticipate potential reversals in price direction.
Overall, the Stochastic Oscillator is a valuable tool for traders seeking to gauge momentum and identify potential entry or exit points in the market. However, like any technical indicator, it is essential to use the Stochastic Oscillator in conjunction with other analysis techniques and risk management strategies to make informed trading decisions.
Conclusion
In conclusion, mastering the art of trading on a 5-minute chart demands more than just a superficial understanding of market indicators—it requires a deep comprehension of the nuances that drive informed decision-making. By integrating the best indicators outlined in this guide into your trading strategy, you not only gain insights into market dynamics but also unlock the potential for identifying lucrative opportunities and managing risks more adeptly. However, it’s crucial to remember that success in the fast-paced world of 5-minute chart trading isn’t solely dependent on indicator selection. Effective money management practices, such as setting stop-loss and take-profit orders, play a pivotal role in safeguarding capital and maximizing profitability. Whether executing a short position or long position, implementing disciplined money management strategies is paramount to long-term success.
Moreover, consistent practice and adaptability are indispensable traits for traders navigating the complexities of intraday trading. Markets are dynamic, and what works today may not necessarily work tomorrow. Therefore, continually refining your skills, staying updated with market trends, and adapting your strategies accordingly are essential for staying ahead in the ever-evolving landscape of 5-minute chart trading. Embrace a mindset of continuous learning and improvement, and be prepared to adjust your approach as market conditions shift.
In essence, success in trading on 5-minute charts is not an overnight achievement but a journey that requires dedication, patience, and a willingness to learn from both successes and failures. By combining a deep understanding of indicators with disciplined money management practices and a commitment to continuous improvement, you can navigate the fast-paced world of intraday trading with confidence and increase your chances of achieving long-term success.