

In the ever-evolving landscape of financial markets, traders are constantly seeking tools and strategies to gain an edge and navigate the complexities of price movements. Among the myriad of technical indicators available, the Stochastic Oscillator stands out as a powerful tool for assessing momentum and identifying potential trend reversals. Developed by the legendary analyst George C. Lane in the late 1950s, the Stochastic Oscillator has since become a staple in the toolkit of traders worldwide.
Understanding the Stochastic Indicator goes beyond mere calculation and interpretation of its lines. It delves into the very essence of forex market dynamics, capturing the ebb and flow of buying and selling pressure that drives asset prices. With this comprehension, traders can interpret market sentiment, pinpoint the best times to enter and exit positions, and confidently navigate the unpredictable realm of financial markets.
Stochastic oscillators are highly viable tools for day trading and scalping in the forex market, particularly when applied to currency pairs. Traders can capitalize on small price movements, measured in pips, by utilizing stochastic indicators alongside technical analysis tools like candlestick charts, chart patterns, and price action. These strategies help traders identify optimal entry and exit points, generate forex signals, and manage risk-reward ratios effectively.
How Stochastic Works
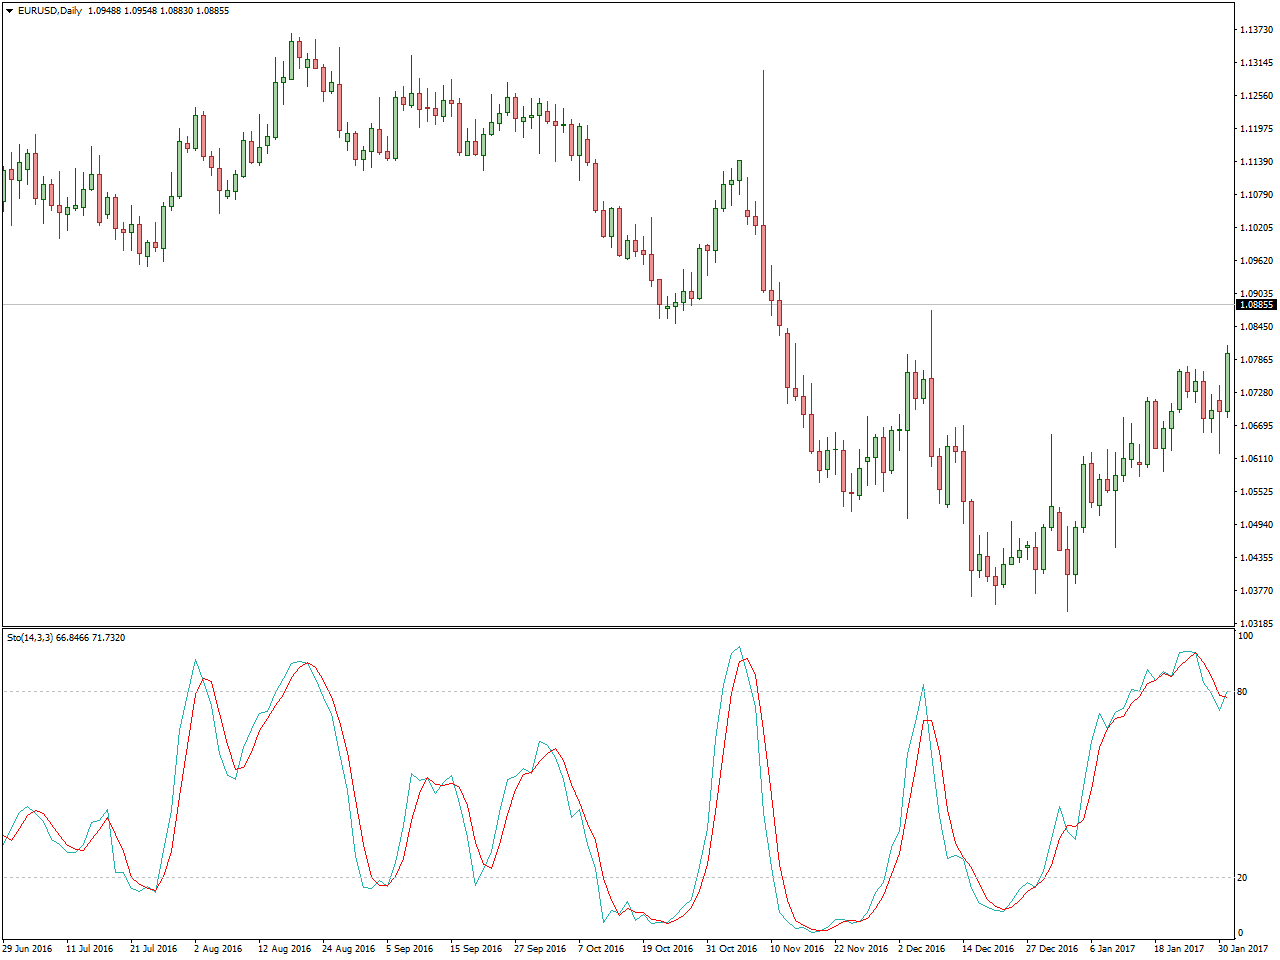
The Stochastic Oscillator is a momentum indicator that measures the location of a current price relative to its price range over a defined period. Comprising two lines, %K and %D, it oscillates between 0 and 100, providing insights into potential trend reversals and overbought or oversold conditions.
The Stochastic Oscillator operates on the principle that during uptrends, prices tend to close near their high, and during downtrends, prices tend to close near their low. This concept is encapsulated in the calculation of the %K line, which represents the position of the current closing price relative to the high-low range over a specific period, typically 14 periods.
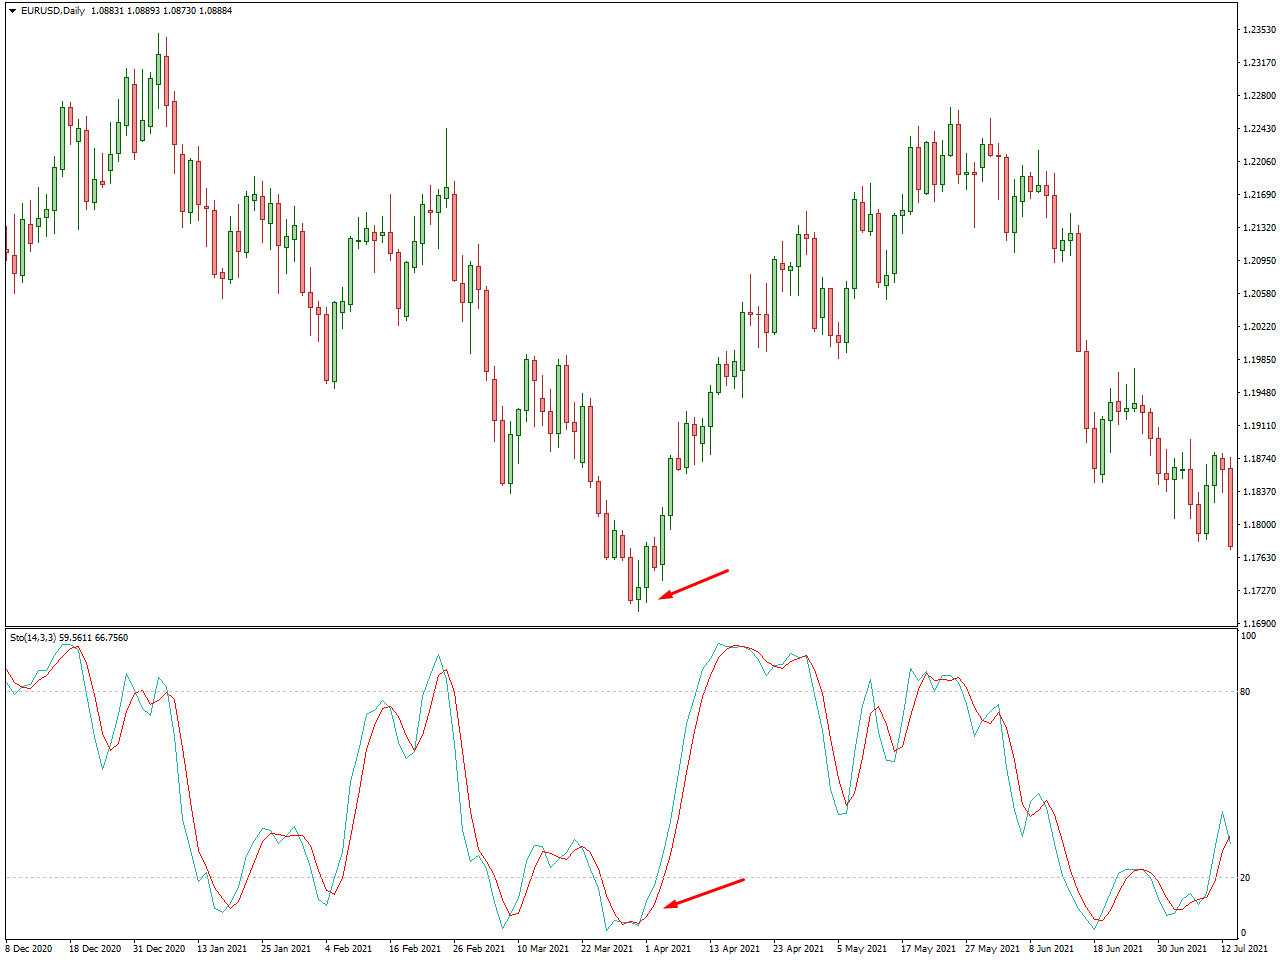
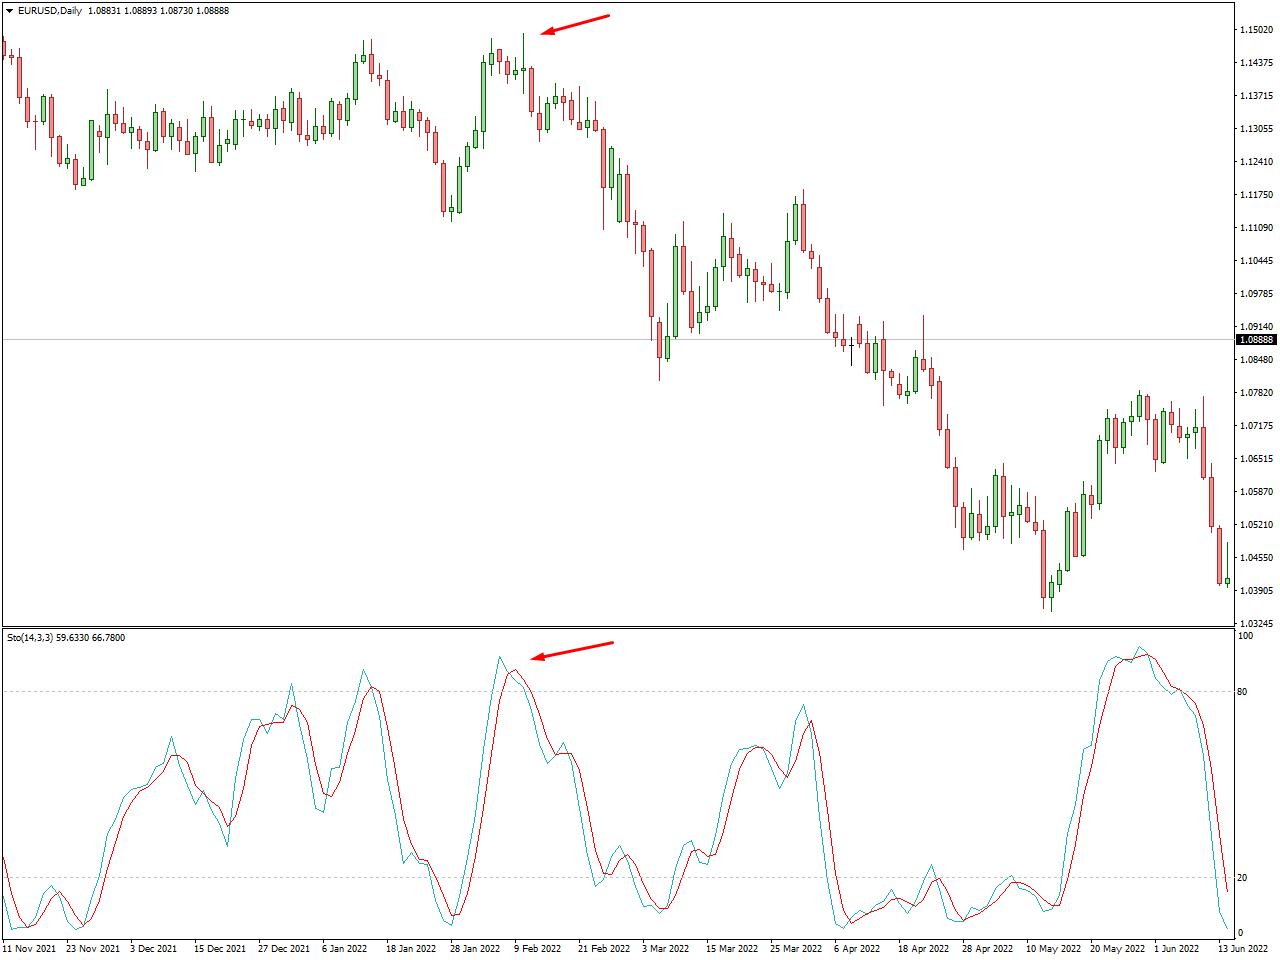
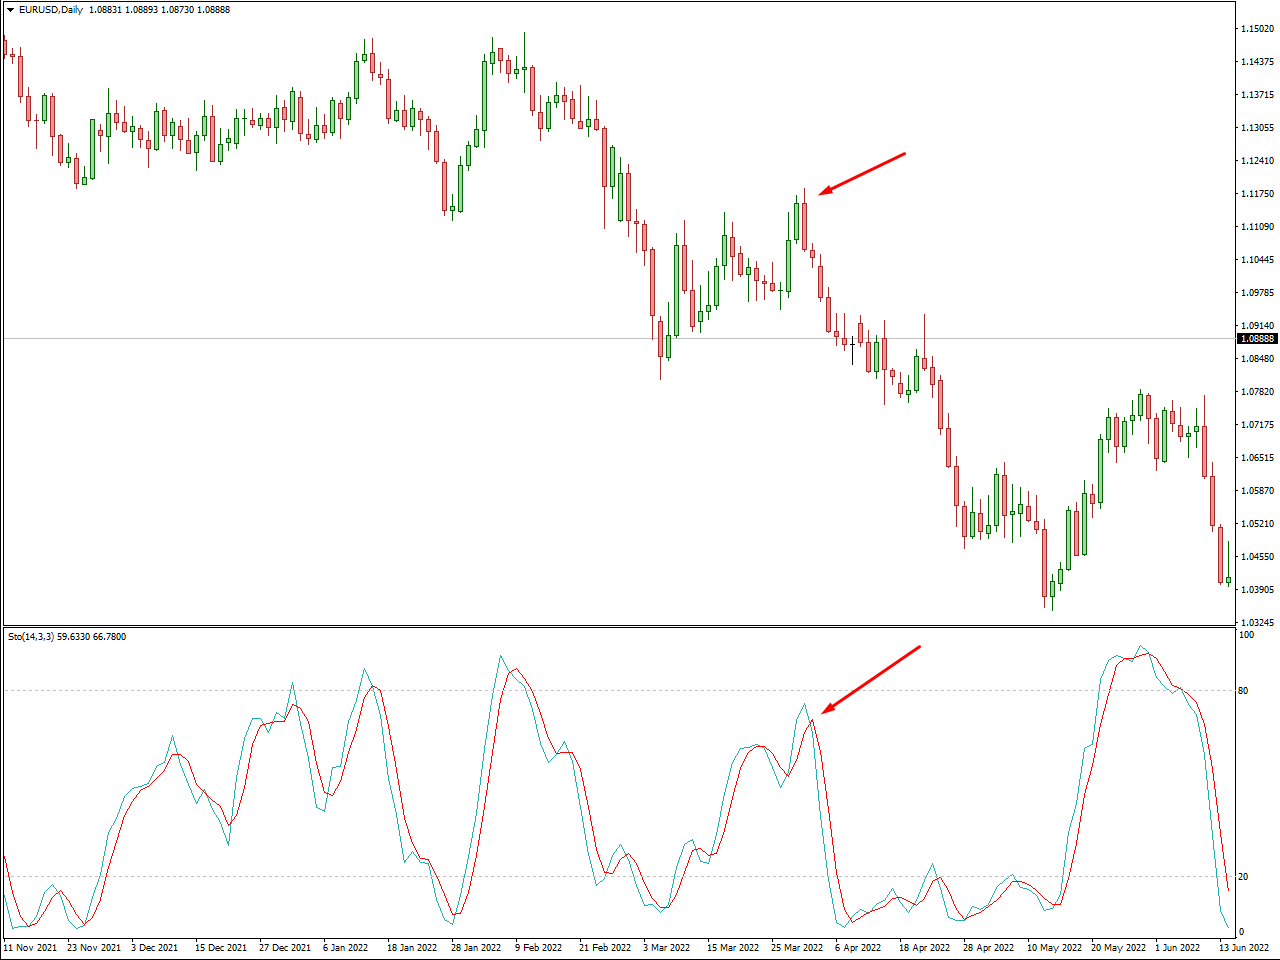
Interpreting Stochastic involves identifying overbought and oversold conditions, typically defined as readings above 80% and below 20%, respectively. When the Stochastic Oscillator exceeds 80%, it suggests that the asset may be overbought, signaling a potential reversal or pullback. Conversely, readings below 20% indicate oversold conditions, suggesting a potential buying opportunity as the price may rebound.
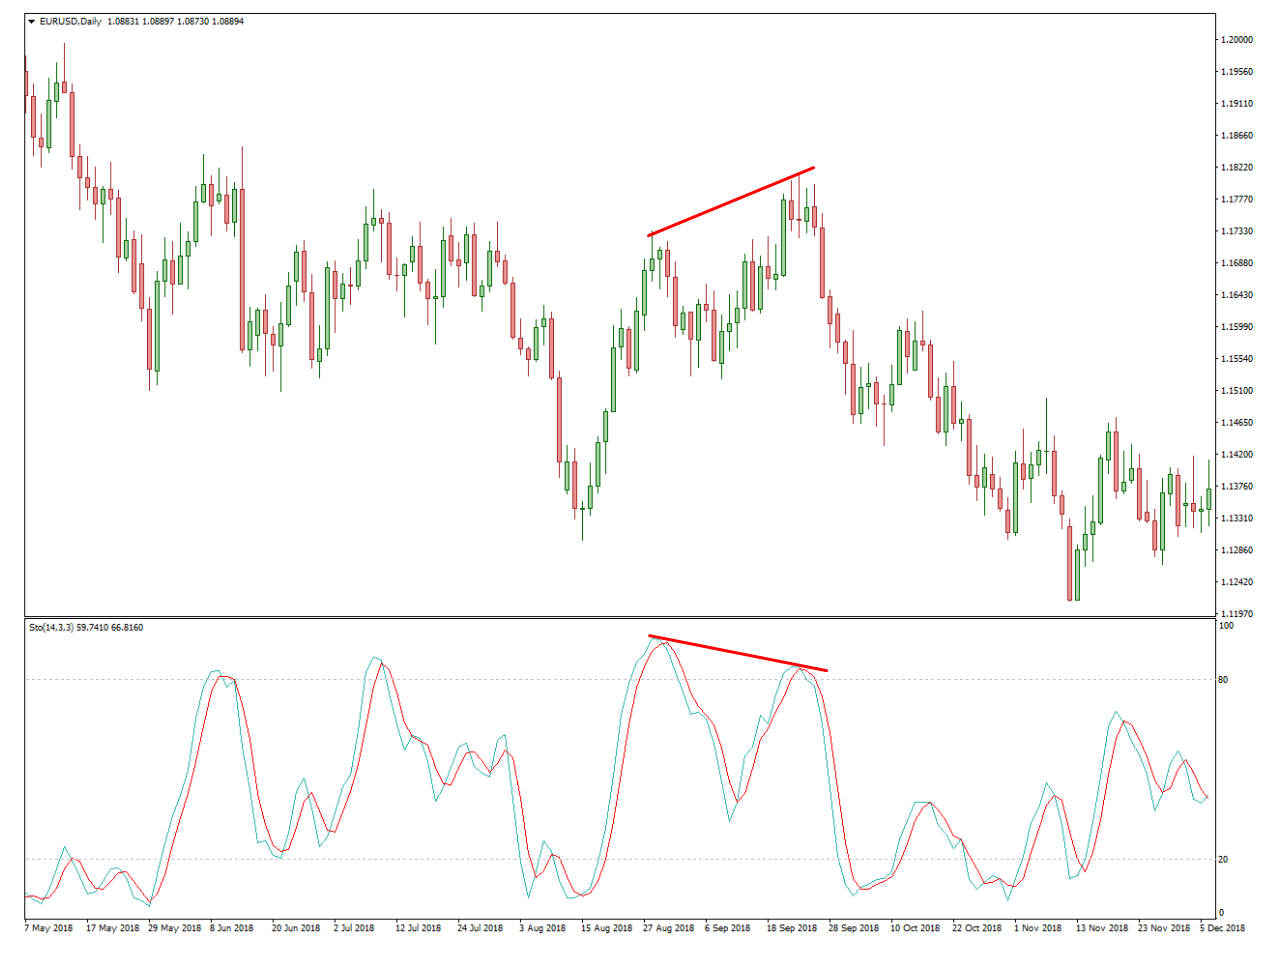
In addition to overbought and oversold conditions, traders also pay attention to divergences and crossovers between the %K and %D lines. Divergences occur when the price makes a higher high or lower low while the Stochastic Oscillator fails to confirm it, signaling potential trend weakness. Crossovers between the %K and %D lines provide further confirmation of potential trend shifts, with bullish crossovers occurring when %K crosses above %D and bearish crossovers occurring when %K crosses below %D.
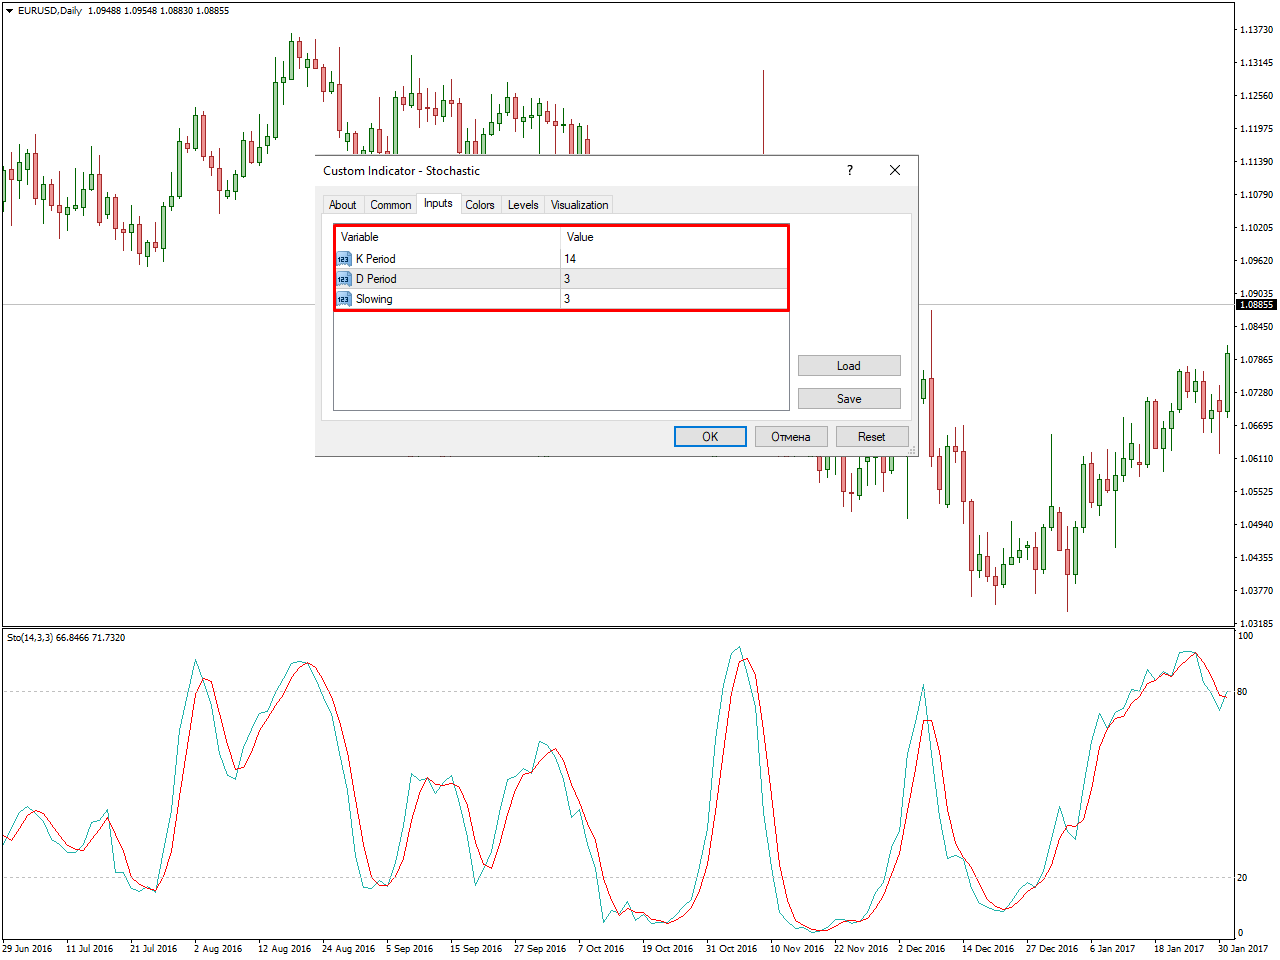
Best Stochastic Settings for Swing Trading
Optimizing Stochastic settings for swing trading involves tailoring the indicator to identify medium-term trends and reversals. Here’s a recommended set of Stochastic settings:
- Time Frame: Daily and Weekly Charts
- %K Period: 14
- %D Period: 3
- Slowing: 3
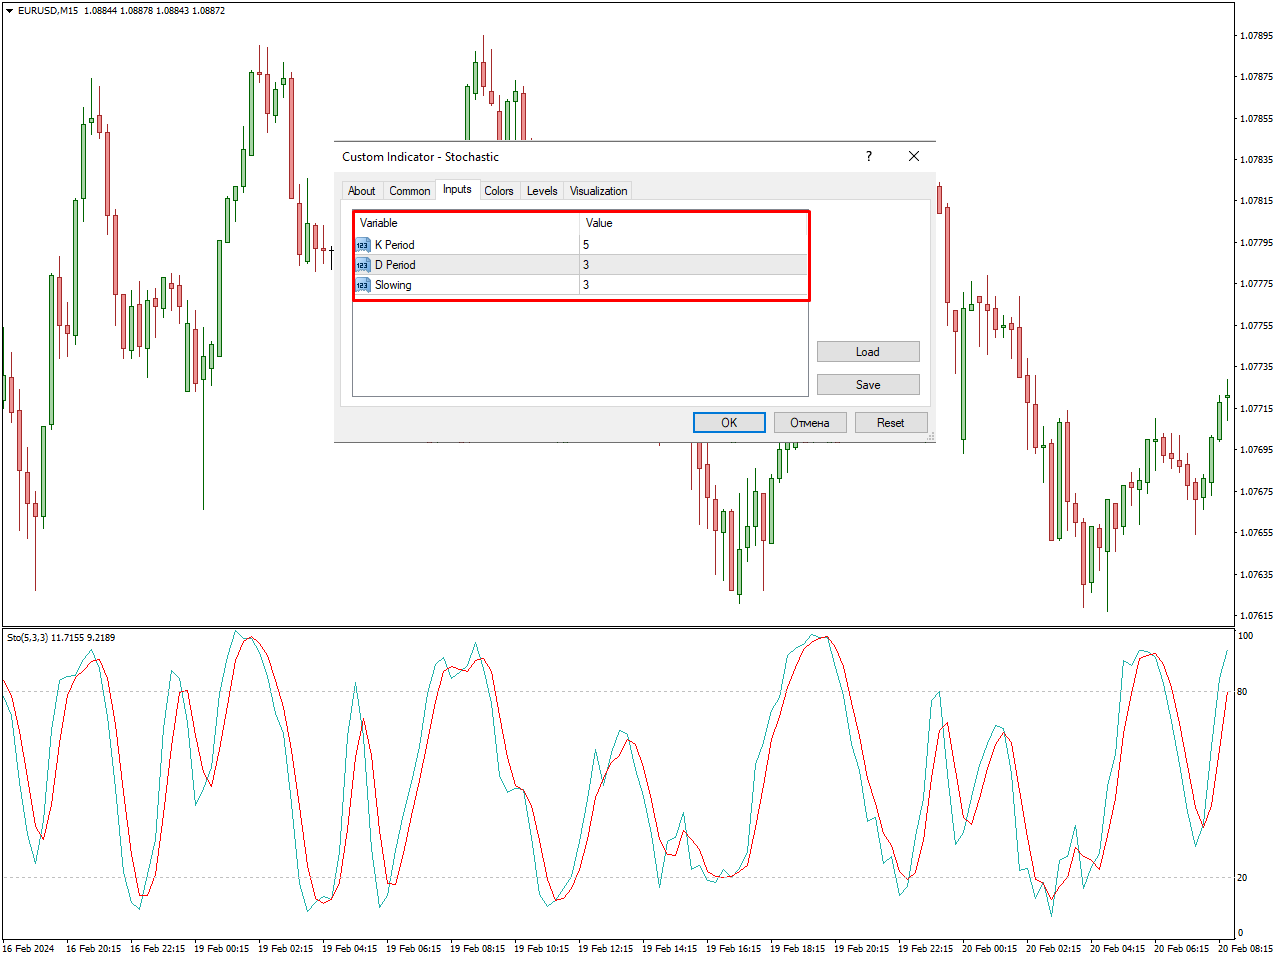
Best Stochastic Settings for Intraday Trading
For intraday trading, precise and timely decisions are crucial, necessitating adjustments to Stochastic settings. Here’s a suggested set of Stochastic settings:
- Time Frame: 15-Minute Chart
- %K Period: 5
- %D Period: 3
- Slowing: 3
Most Used Stochastic Strategies
- Overbought/Oversold Strategy: This strategy involves identifying overbought and oversold conditions using the stochastic oscillator. When the oscillator rises above a certain threshold (e.g., 80), it indicates overbought conditions, suggesting a potential sell signal. Conversely, when it falls below another threshold (e.g., 20), it indicates oversold conditions, suggesting a potential buy signal.
- Crossover Strategy: In this strategy, traders look for crossovers between the %K and %D lines of the stochastic oscillator. When the %K line crosses above the %D line, it’s considered a bullish signal, suggesting a buy. Conversely, when the %K line crosses below the %D line, it’s considered a bearish signal, suggesting a sell.
- Divergence Strategy Divergence occurs when the price of an asset moves in the opposite direction of the stochastic oscillator. Bullish divergence occurs when the price makes a lower low while the oscillator makes a higher low, suggesting potential upward momentum. Bearish divergence occurs when the price makes a higher high while the oscillator makes a lower high, suggesting potential downward momentum.
Advantages of Using Stochastic Indicator:
- Identifying Overbought and Oversold Conditions: The stochastic indicator serves as a reliable tool for traders to discern when an asset’s price has reached extremes, either being overbought or oversold. By highlighting these conditions, it enables traders to anticipate potential trend reversals, providing them with valuable insights into market dynamics and helping them make informed trading decisions. This aspect of the stochastic indicator allows traders to capitalize on market inefficiencies and exploit price movements resulting from shifts in sentiment.
- Confirmation Tool: One of the significant advantages of the stochastic indicator is its ability to corroborate forex signals generated by other technical analysis tools. By integrating stochastic analysis into their trading strategy, traders can enhance the validity and reliability of their daily trading signals. This confirmation aspect adds an extra layer of confidence to trading decisions, reducing the likelihood of false signals and increasing the probability of successful trades. As a result, traders can achieve greater consistency and effectiveness in their trading endeavors.
- Divergence Signals: Stochastic divergence refers to situations where the price action of an asset and the stochastic indicator diverge from each other, indicating a potential shift in market momentum. This divergence often precedes significant trend reversals, providing traders with early warnings of impending price movements. By recognizing these divergence signals, traders can position themselves ahead of the crowd, capitalizing on emerging trends and maximizing profit potential. Additionally, stochastic divergence serves as a valuable tool for risk management, allowing traders to identify potential reversals and adjust their trading strategies accordingly to mitigate losses.
- Ease of Use: Another advantage of the stochastic indicator is its simplicity and accessibility, making it suitable for traders of all experience levels. Unlike more complex technical indicators, the stochastic oscillator can be easily understood and implemented without requiring extensive technical expertise. Its straightforward interpretation allows traders to quickly grasp market conditions and make timely decisions based on stochastic signals. This ease of use enables traders to focus on analyzing price action and developing effective trading strategies rather than struggling with complicated technical concepts, thereby facilitating more efficient and profitable trading.
Disadvantages of Using Stochastic Indicator:
- Whipsaw Trades: Despite its effectiveness in identifying overbought and oversold conditions, the stochastic indicator is prone to generating false signals, especially in choppy or range-bound markets. These false signals can lead to whipsaw trades, where traders enter long position or short position based on stochastic readings only to see the market reverse shortly afterward, resulting in losses. This inherent drawback of the stochastic oscillator necessitates caution and careful validation of signals through the use of additional technical indicators or confirmation techniques to filter out false signals and improve trading accuracy.
- Lagging Indicator: Like many other technical indicators, the stochastic oscillator is a lagging indicator, meaning it relies on past price data to generate signals, which may not always reflect current market conditions accurately. During fast-moving or volatile market environments, the stochastic indicator may lag behind price action, failing to provide timely signals for traders to act upon. This lagging nature of the stochastic oscillator can result in missed opportunities or delayed responses to changing market dynamics, undermining its effectiveness in capturing short-term price movements and potentially diminishing trading performance.
- Market Suitability: While the stochastic indicator can be highly effective in certain market conditions, such as range-bound or oscillating markets, its performance may deteriorate in highly trending or low volatility environments. In trending markets, the stochastic oscillator may generate false signals as prices continue to trend strongly in one direction, leading to losses for traders attempting to fade the trend based on stochastic readings. Similarly, in low volatility markets, the stochastic oscillator may produce erratic signals with little significance, making it challenging for traders to identify actionable trading opportunities. Therefore, traders should consider the prevailing market conditions and adjust their use of the stochastic indicator accordingly to maximize its effectiveness.
- Subjectivity in Interpretation: Interpretation of stochastic signals can vary among traders, leading to subjective analysis and potential misinterpretation of market conditions. Due to its customizable parameters and various interpretation techniques, different traders may derive different conclusions from stochastic readings, resulting in conflicting signals and trading biases. This subjectivity in interpretation can introduce ambiguity and uncertainty into trading decisions, increasing the risk of making erroneous judgments and experiencing suboptimal outcomes. To mitigate this disadvantage, traders should strive to develop a clear and consistent methodology for interpreting stochastic signals and incorporate objective criteria for validating trade setups, thereby reducing the influence of subjective biases on their trading decisions.
Conclusion
In conclusion, the Stochastic Oscillator stands as a beacon of insight in the realm of technical analysis, offering traders a window into market momentum and potential trend reversals. By understanding the mechanics of the Stochastic Indicator and optimizing settings for swing or intraday trading, traders can unlock new dimensions of profitability and confidence in their trading endeavors.
However, mastering the art of trading with the Stochastic Indicator is not merely a matter of crunching numbers and plotting lines. It requires intuition, experience, and a deep understanding of market dynamics. Traders must constantly refine their skills, adapt to changing market conditions, and remain disciplined in their approach to trading.
As you embark on your journey with the Stochastic Indicator, remember that success in trading is not guaranteed by any single indicator or strategy. It is the culmination of knowledge, skill, and discipline, honed over time through dedication and perseverance. May the insights gained from this exploration of the Stochastic Indicator serve as a guiding light in your quest for trading mastery.
Additionally, traders must consider factors such as leverage, margin, stop-loss and take-profit orders, market sentiment, support and resistance levels, and currency correlations to mitigate risks and optimize profits.