

Navigating the intricate domain of trading is a multifaceted pursuit, demanding not only a profound comprehension of market dynamics but also a mastery of precise timing. In the unceasing ebb and flow of financial markets, the ability to enter and exit positions with exactitude can signify the disparity between triumph and adversity. This is where entry and exit indicators step into the spotlight.
Within this exhaustive handbook, we delve into the domain of market timing, unveiling the top 20 entry and exit indicators poised to equip traders with the capacity to render astute decisions across the domains of stocks, forex, commodities, and beyond. Whether you’re a seasoned trader or embarking on your initial foray into trading, these indicators will stand as steadfast companions on your pursuit of precision and prosperity within the dynamic expanse of financial markets. Accompany us on this journey as we uncover the enigmas surrounding these indicators, their practical applications, and how they can empower you to traverse the intricate terrain of trading with conviction and precision.
Top 20 Entry and Exit Indicators
- Semafor Alert Indicator
- QQE Indicator
- Best Scalping Indicator
- Forex Entry Point Indicator
- RSI Divergence Indicator
- Super Arrow Indicator
- Buy Sell Magic Indicator
- FXSSI.StopLossClusters
- Entry Signal Indicator
- TRIX Crossover Indicator
- SFI Indicator Entry And Exit
- MSP Indicator
- EntryExit Trend Indicator
- Forex Signals Indicator
- Heiken Ashi Indicator
- Swing ZZ Zigzag Indicator
- FXSSI.ProfitRatio Indicator
- Chandelier Exit Indicator
- Lucky Reversal Indicator
- Half Trend Buy Sell Indicator
Semafor Alert Indicator
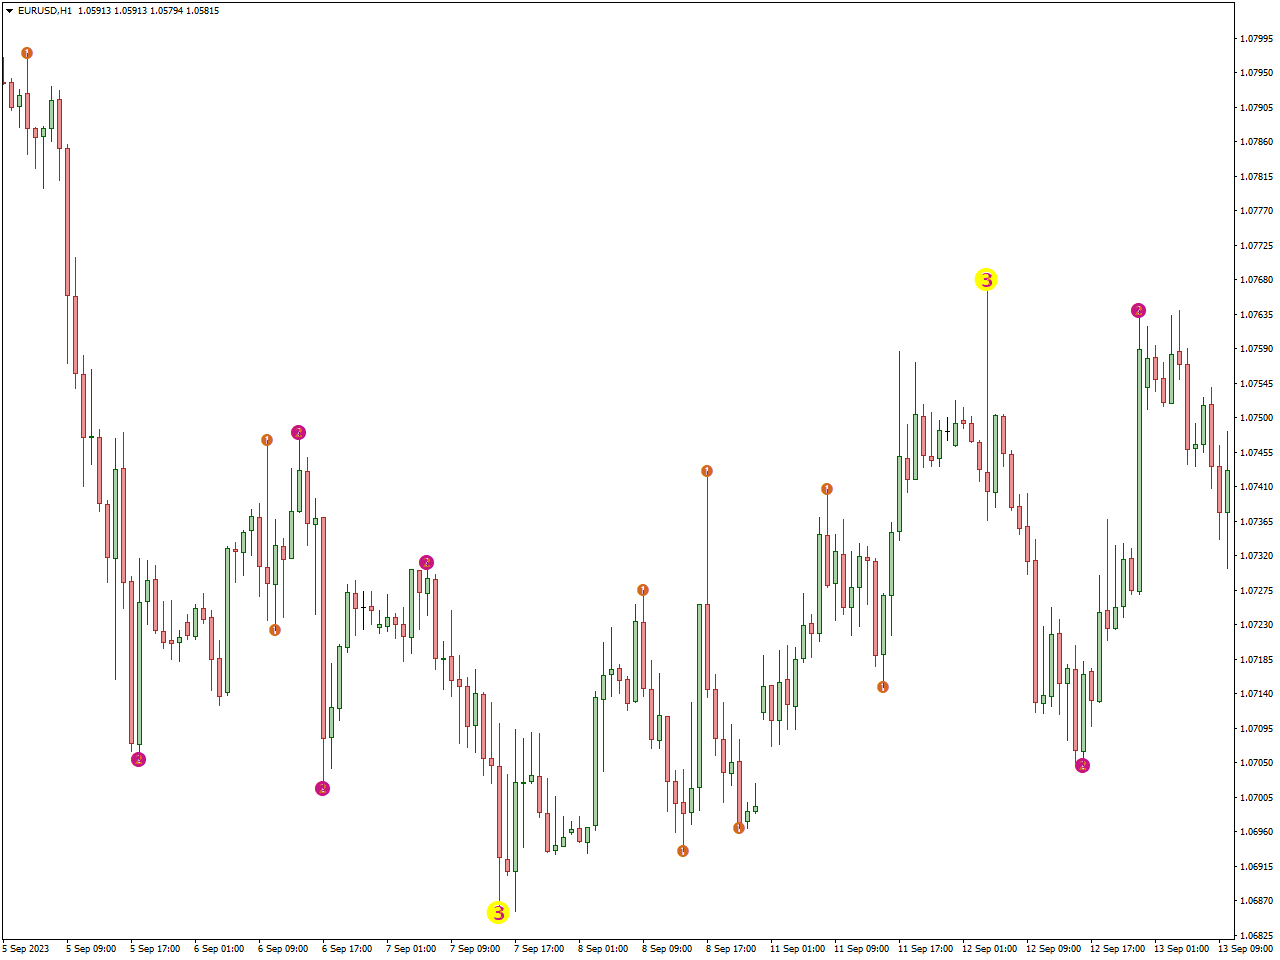
Technical analysis tools like the Semafor Alert Indicator are frequently utilized in trading, especially in the currency market. Its origins are in the Semafor indicator, which recognizes and emphasizes major swing points on a price chart, including swing highs and swing lows. This indicator’s “Alert” feature is intended to provide notifications or alerts to traders when certain circumstances relating to certain swing points are satisfied.
On the price chart, the primary function of the indicator is to locate and designate swing highs (instances where the price reached its peak before reversing) and swing lows (instances where the price decreased before reversing upwards). Traders commonly rely on the Semafor Alert Indicator to deduce potential support and resistance levels based on these swing points.
QQE Indicator
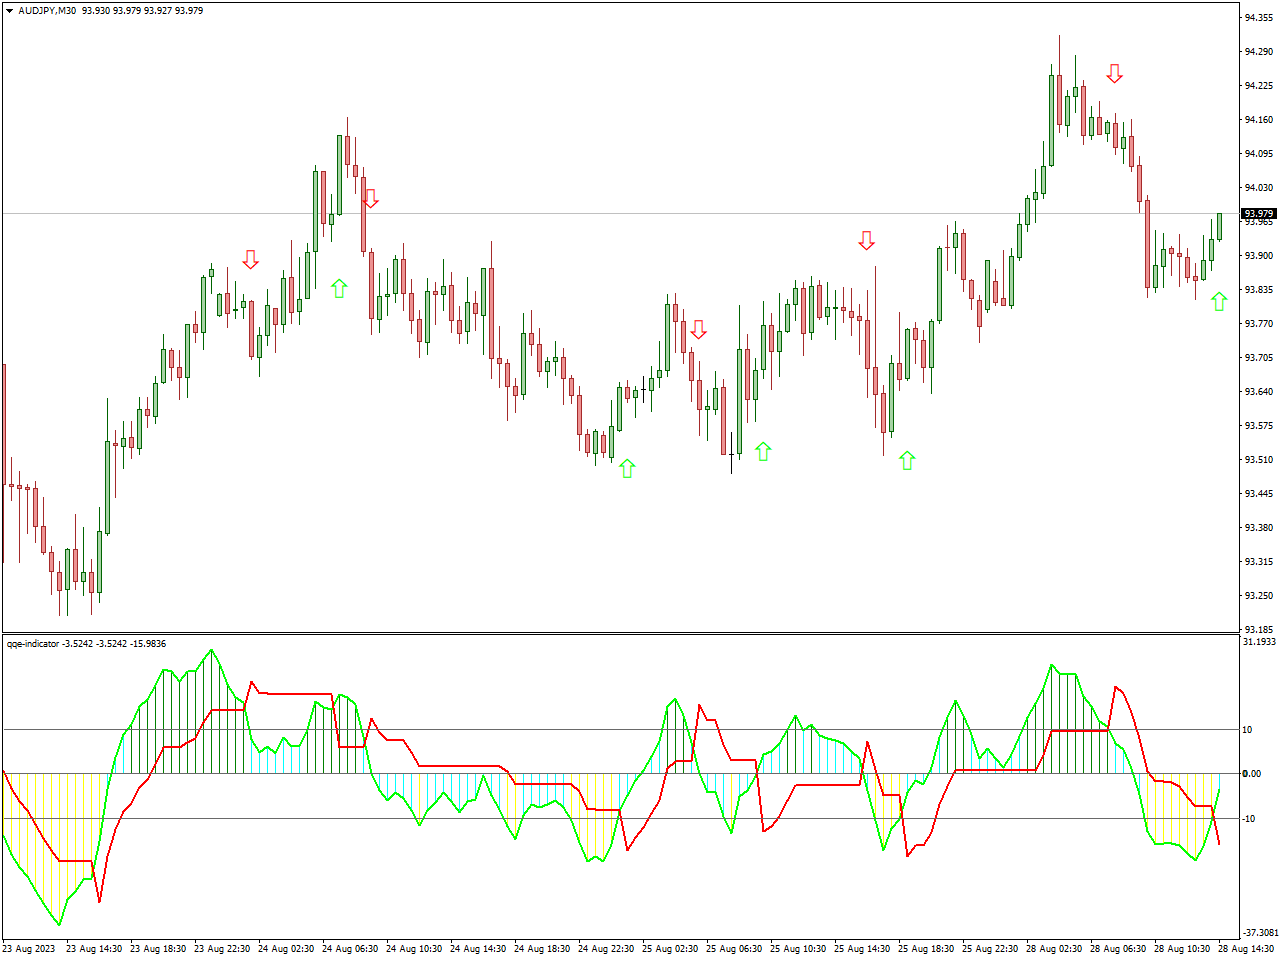
Experienced traders employ the Qualitative Quantitative Estimation (QQE) Indicator to assess qualitative and quantitative aspects of price trends and momentum. When contemplating “long” trading positions, where investors anticipate upward price movements, the QQE Indicator can provide valuable insights.
The QQE Indicator, crafted to amalgamate both qualitative and quantitative evaluations of market trends, leverages moving averages and smoothing techniques to ascertain the vigor and direction of trends. Consequently, it serves as a valuable instrument for traders.
For traders employing the QQE Indicator in “long” positions, it’s prudent to contemplate closing positions if the QQE line crosses beneath the signal line or when indications point towards a likely trend reversal. To secure gains as prices climb, traders can also consider implementing profit targets or trailing stop orders.
Best Scalping Indicator
The Best Scalping Indicator stands as an innovative and well-regarded forex tool offered free of charge, primarily tailored to cater to scalping aficionados. Its approach fuses moving averages and an oscillator to meticulously pinpoint the most advantageous entry and exit points for short-term trading ventures.
Furthermore, this indicator incorporates a customizable alert system, affording traders the convenience of timely notifications pertaining to potential trading prospects.
This meticulously developed scalping indicator leverages real-time analysis to execute short-term positions, making it ideal for traders who actively seek daily opportunities and frequently engage in multiple trades throughout the day. Its primary aim is to efficiently capture modest profits.
Forex Entry Point Indicator
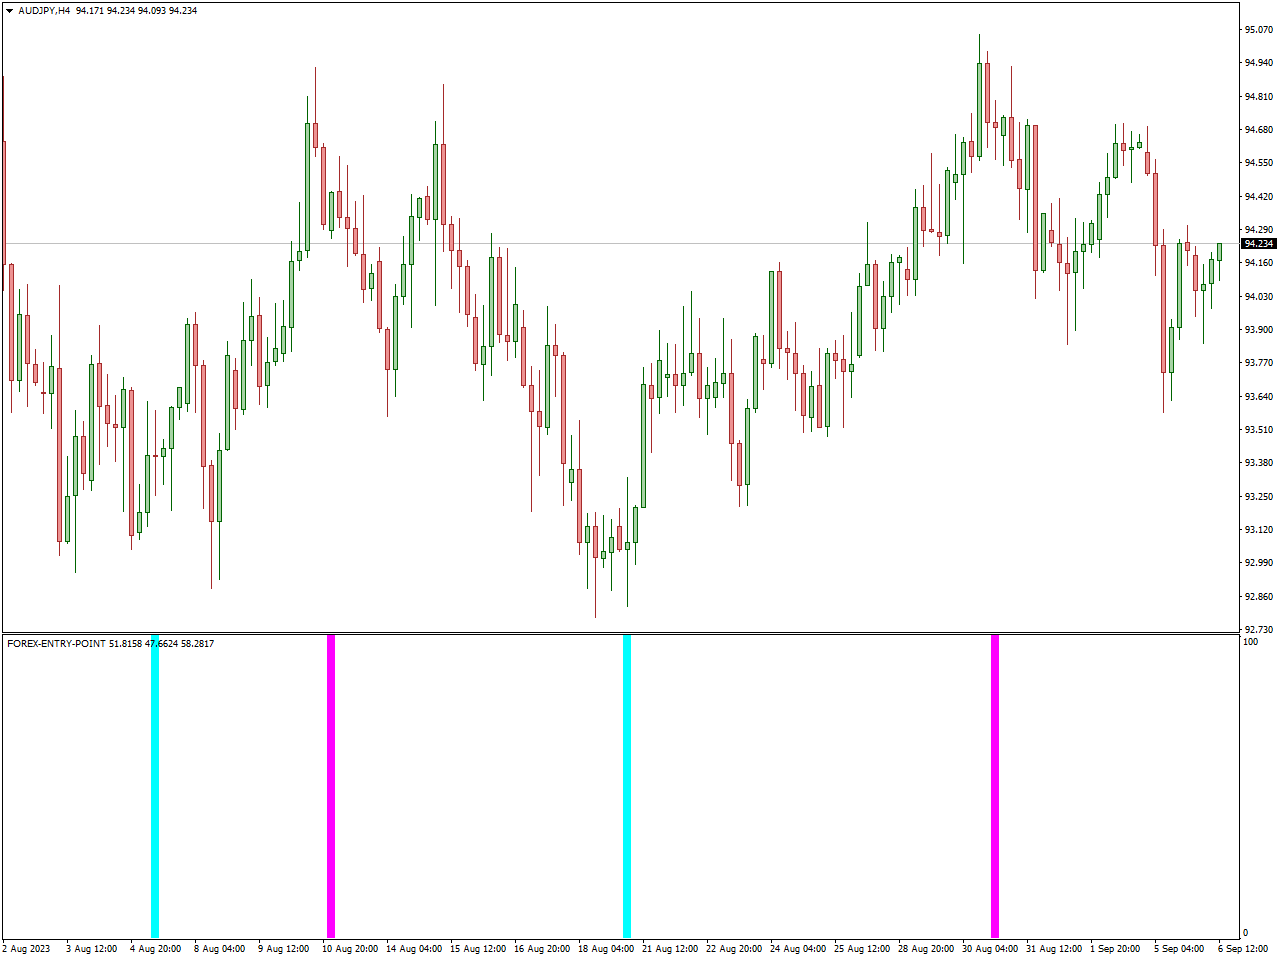
The Forex Entry Point Indicator is a valuable instrument employed by forex traders to enhance their ability to recognize opportune entry points for their trades. It has been meticulously designed to offer traders a means of making well-informed choices regarding the timing of their market entries, grounded in precise technical criteria.
Typically, this indicator takes into account a variety of factors, including price patterns, moving averages, oscillators, and other technical indicators, to produce signals that point towards optimal entry points. The primary aim is to pinpoint moments when market conditions harmonize with the trader’s strategic approach, thereby enhancing the prospects of a successful trade.
RSI Divergence Indicator
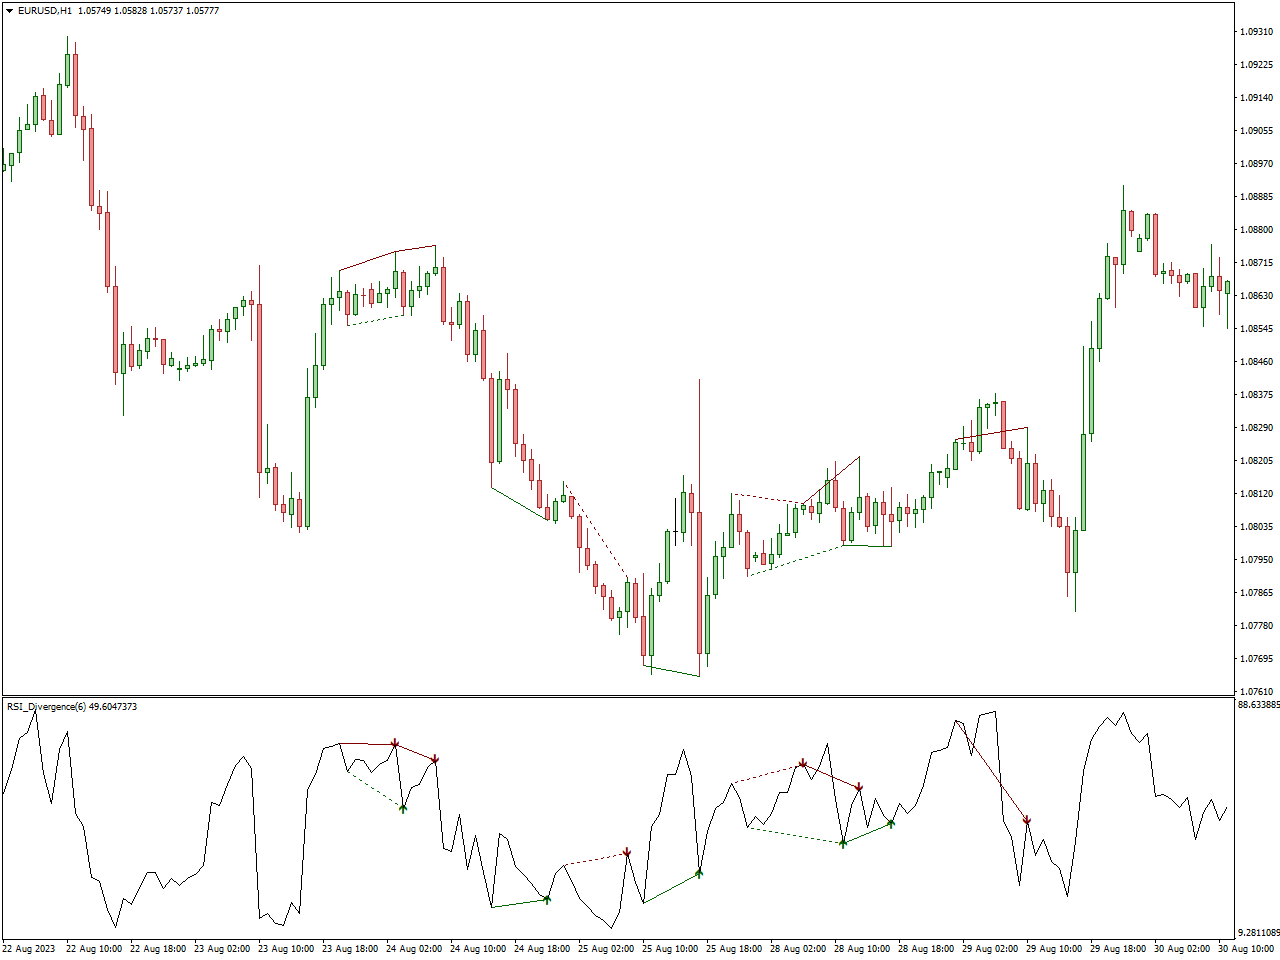
The RSI Divergence Indicator is a technical analysis tool employed by traders in various financial markets, including stocks, forex, and commodities. It utilizes the Relative Strength Index (RSI), a widely recognized momentum oscillator, to aid traders in identifying potential shifts in trend direction and changes in market momentum.
Typically, the RSI Divergence Indicator visually represents both regular and hidden divergence on price charts, often using arrows or other visual cues to emphasize potential reversal points.
Traders rely on the RSI Divergence Indicator to spot potential trade signals. For instance, when the indicator reveals regular bearish divergence (indicating that prices reach higher highs while RSI reaches lower highs) during an uptrend, it may signal a potential trend reversal, prompting traders to consider short positions. Conversely, in a downtrend, regular bullish divergence (price makes lower lows while RSI makes higher lows) could suggest a potential trend reversal to the upside.
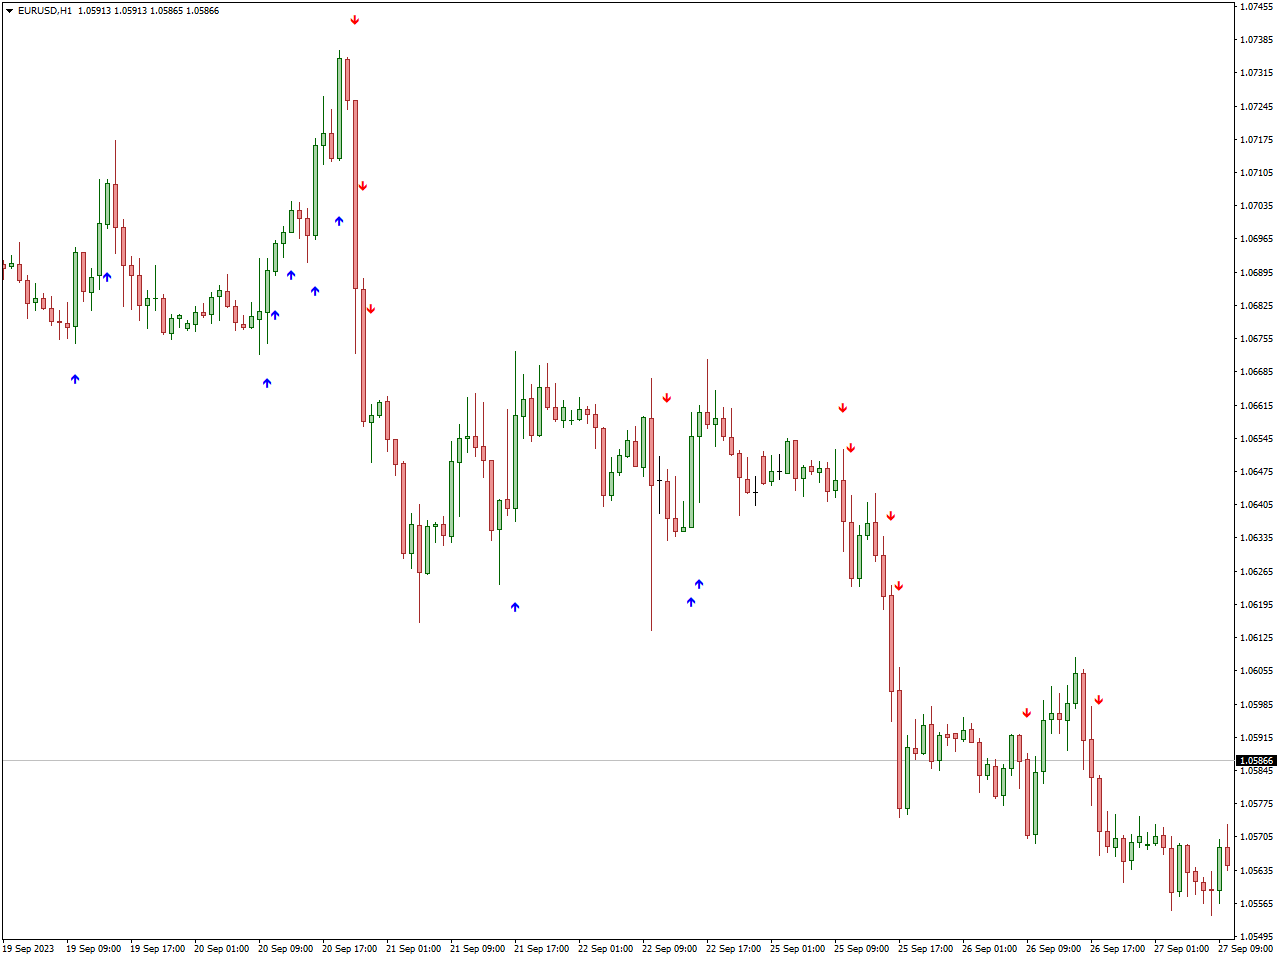
Super Arrow Indicator
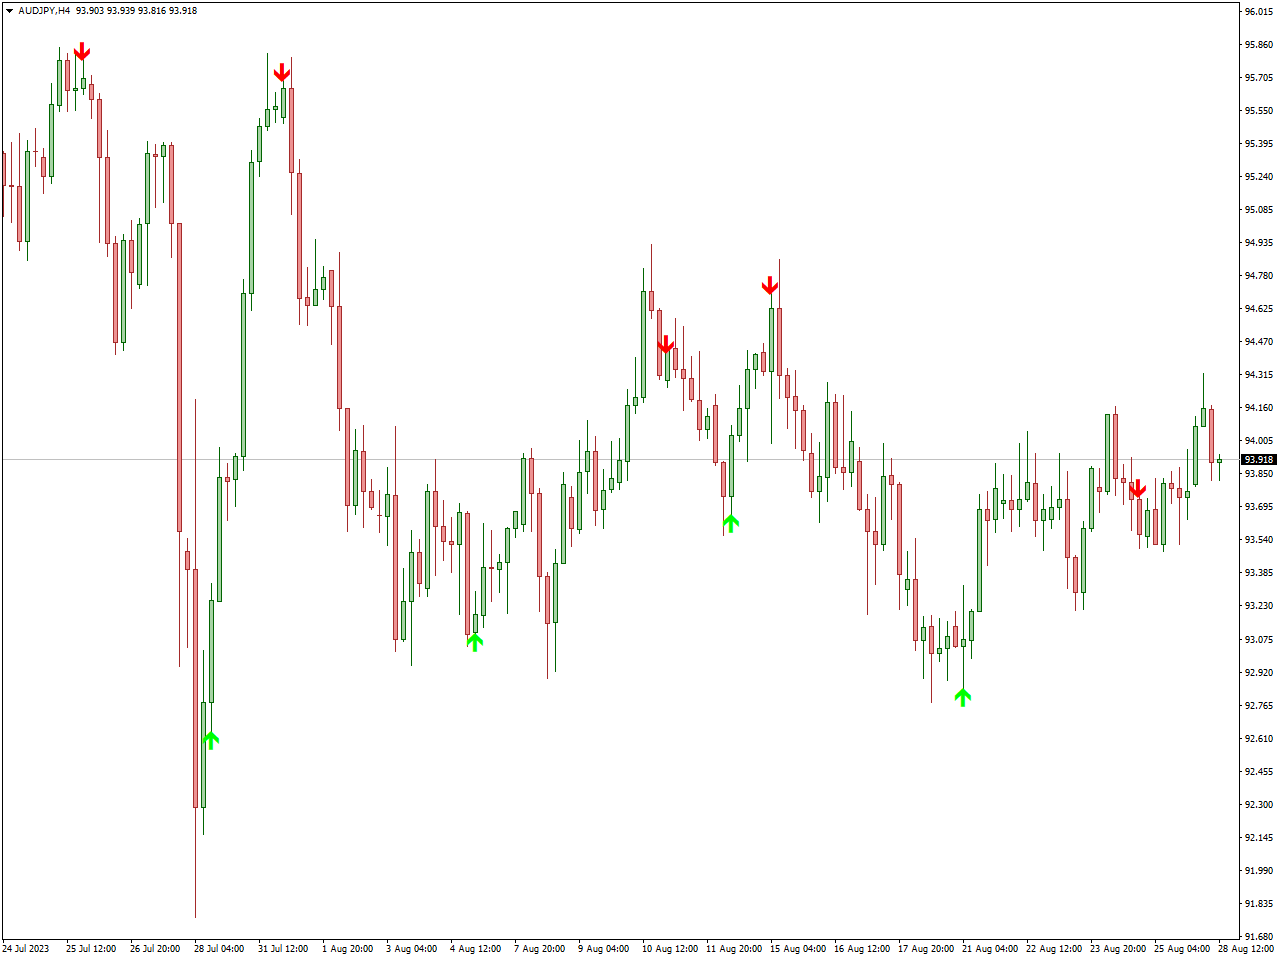
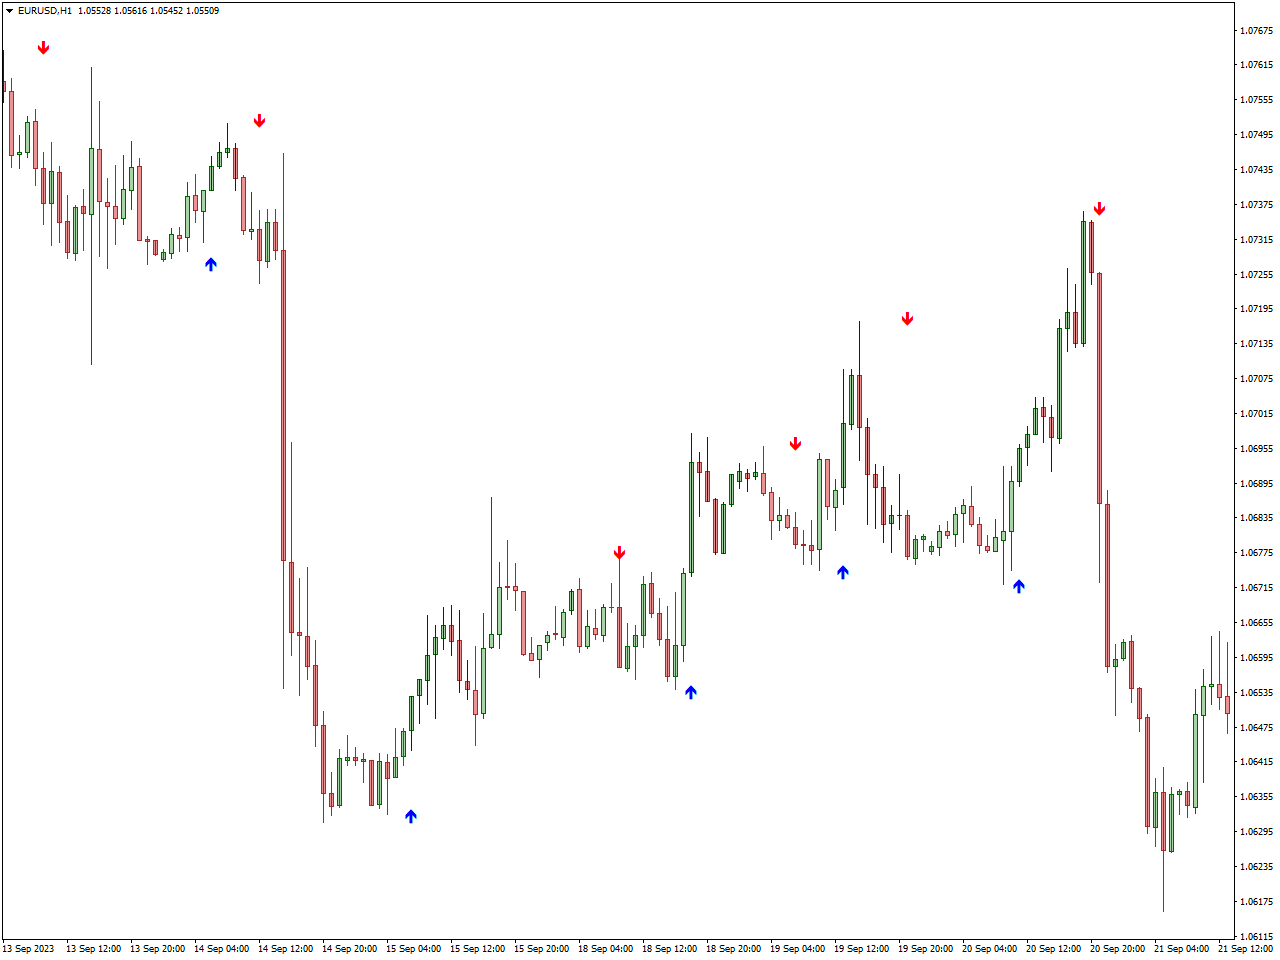
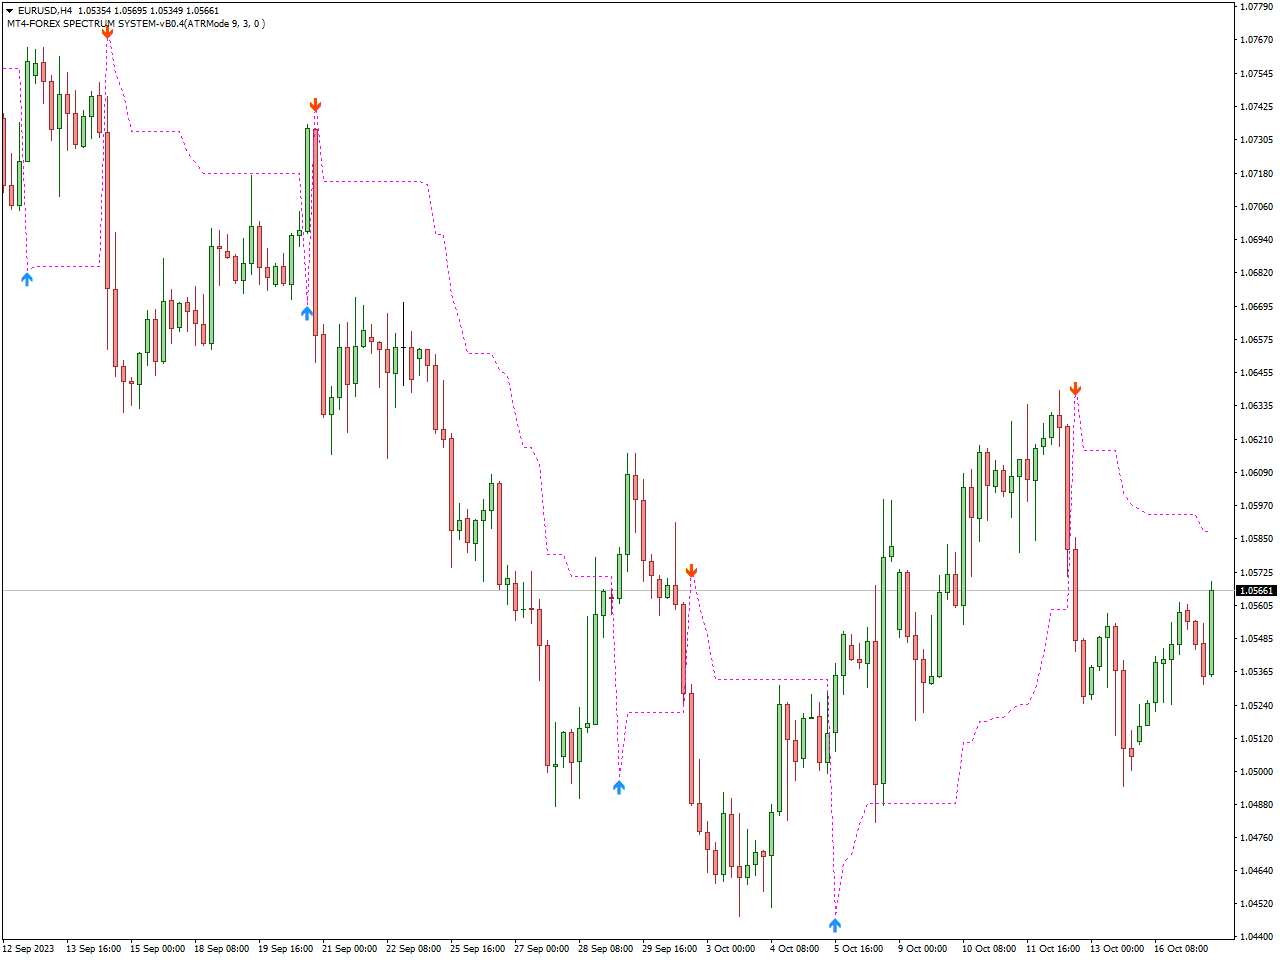
The Super Arrow Indicator is a valuable trading tool designed to enhance precision by indicating potential buy and sell signals. It provides traders with visual cues, usually in the form of arrows, to signify moments when favorable trading opportunities may be on the horizon.
Traders who integrate the Super Arrow Indicator into their analysis typically rely on these signals to make well-informed decisions regarding the initiation of trades or the closure of existing positions. These arrows, typically overlaid on price charts, serve as a guide to identifying instances when market conditions align with potential upward or downward price movements.
To sum up, the Super Arrow Indicator is a practical trading tool that simplifies decision-making through the provision of clear visual signals, often represented as arrows, to assist traders in identifying potential entry and exit points within the markets. It streamlines the process of recognizing trading opportunities.
Buy Sell Magic Indicator
The Buy Sell Magic Indicator is a trading instrument meticulously crafted to assist traders in the identification of potential buy and sell signals within the market. Its methodology draws upon a fusion of technical analysis techniques to generate signals that serve as pointers to optimal entry and exit junctures for trading positions.
Traders who opt for the Buy Sell Magic Indicator often rely on its signals to render judicious decisions concerning the timing of their trade entries and exits. This indicator may present visual cues in the form of arrows or alterations in price chart colors, denoting moments when a prospective opportunity to buy or sell materializes.
However, akin to all trading tools, the effectiveness of the Buy Sell Magic Indicator pivots on its harmonious integration into a trader’s comprehensive strategy, prudent risk management protocols, and an acute understanding of prevailing market conditions. In preparation for its seamless assimilation into their trading methodology, traders should embark on meticulous testing and in-depth analysis.
FXSSI.StopLossClusters
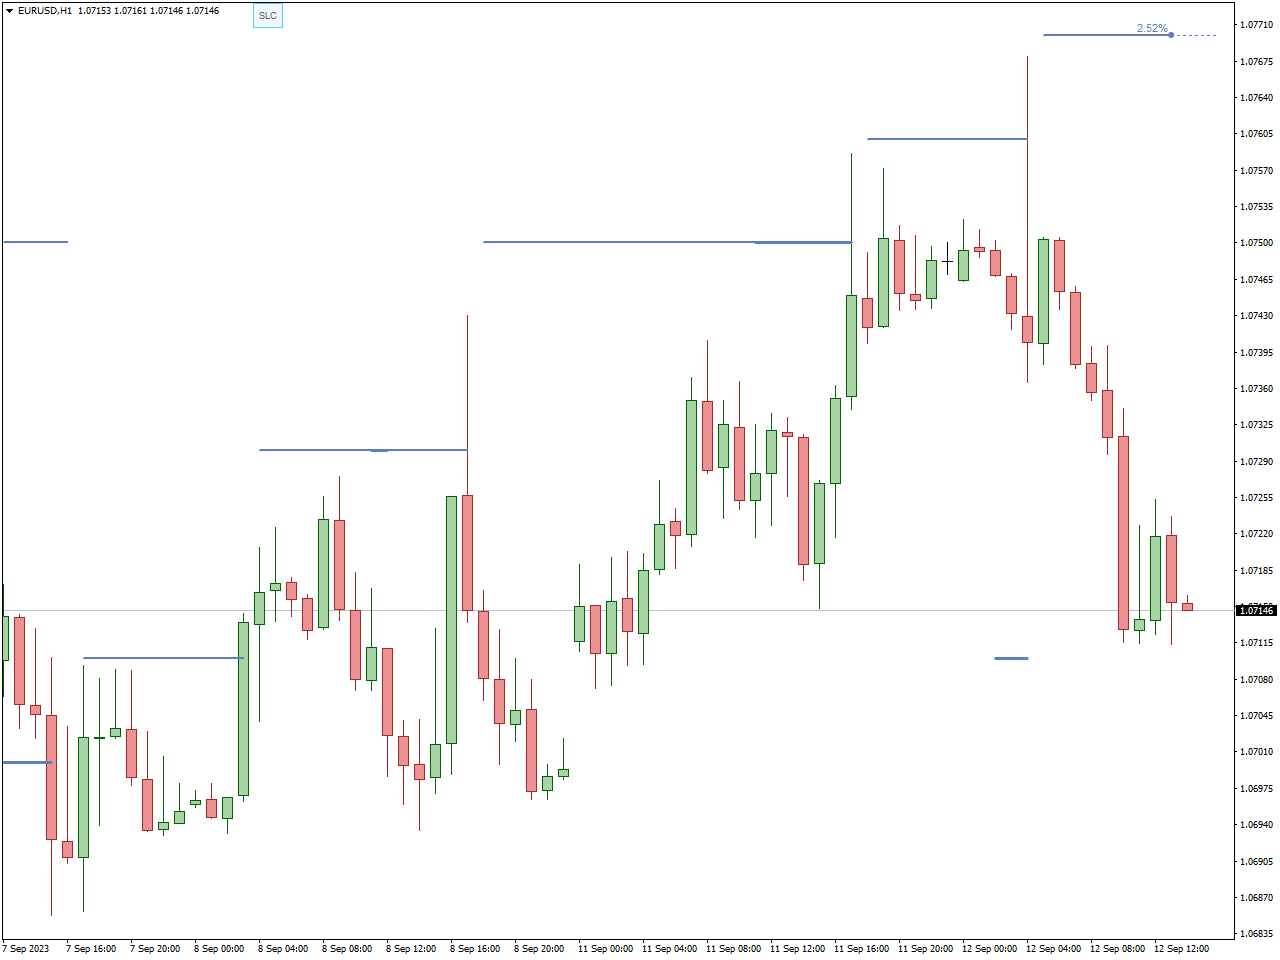
The Stop Loss Clusters (SLC) indicator reveals the regions where a substantial portion of market participants have positioned their Stop Loss orders for their trades. This indicator visually highlights the most prominent groupings of these orders, often referred to as clusters, directly on the chart within the MT4 terminal.
A cluster, sometimes called an accumulation, represents a specific price range of an asset, encompassing a significant quantity of Stop Loss orders placed by other market participants. These clusters tend to materialize at local price peaks and valleys, as well as at significant support and resistance levels.
The thickness of the SLC indicator line displayed on the chart is proportionate to the overall volume of the cluster. This dynamic adds a third dimension, taking the cluster volume into account, to the chart, resulting in a visual representation akin to a heat map.
Entry Signal Indicator
The Entry Signal Indicator is a popular technical analysis tool extensively employed by traders across diverse financial markets, including stocks, forex, and commodities. Its primary function is to offer transparent entry signals that signify favorable times to enter trades. Traders commonly depend on these signals to make well-informed decisions concerning their trading positions.
This indicator typically produces visual indications on price charts, providing traders with a visual representation of moments when market conditions align with the possibility of upward or downward price movements. These signals streamline the decision-making process and enhance a trader’s ability to identify potential trading opportunities with precision.
TRIX Crossover Indicator
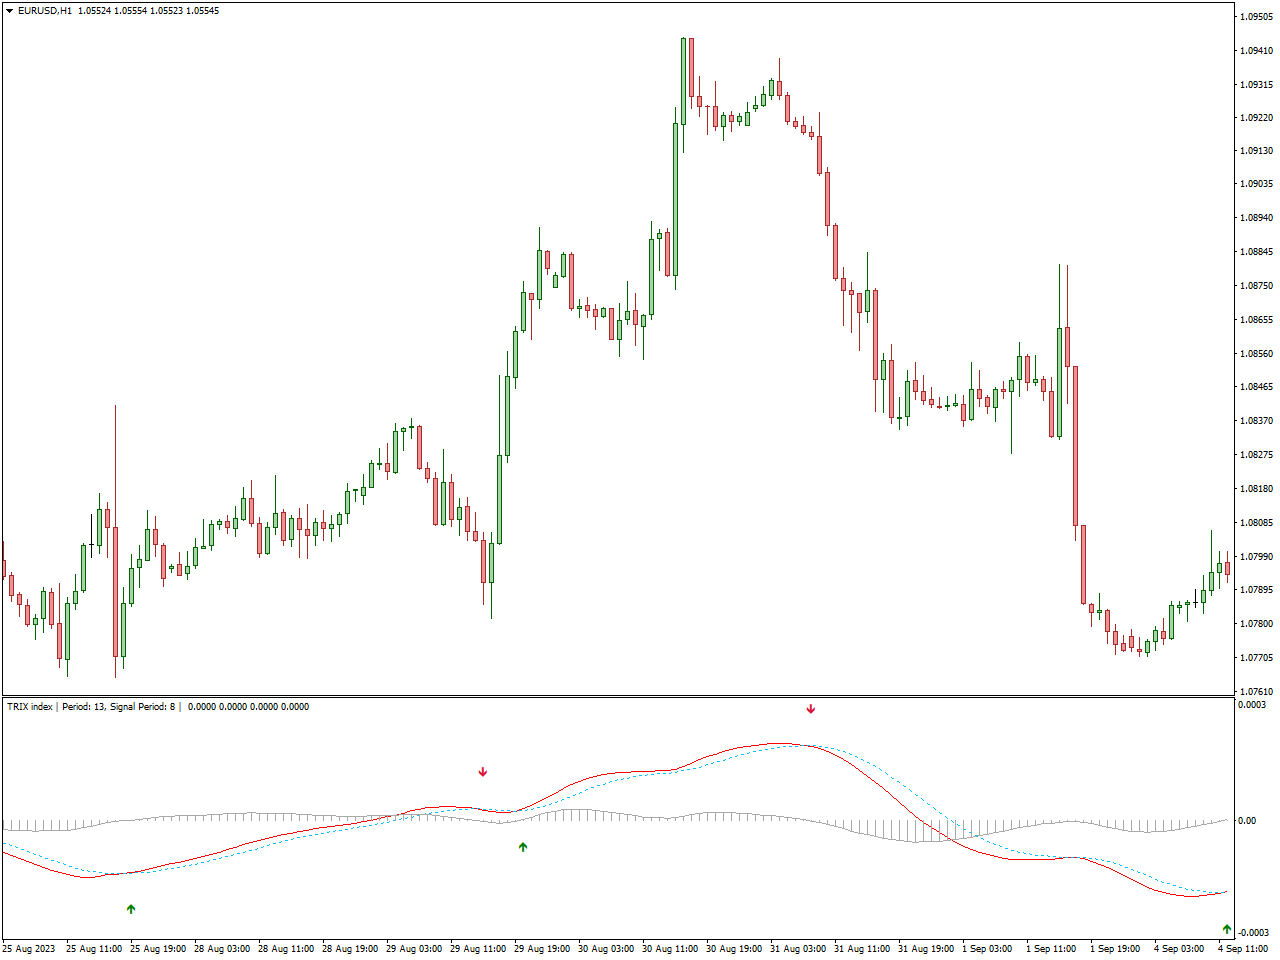
The TRIX Crossover Indicator, an essential tool in technical analysis, is harnessed by traders and analysts to pinpoint potential shifts in the trend of a financial asset. Rooted in the triple exponential moving average (TRIX) of an asset’s price or other data, this indicator places its focus on the interplay between two TRIX lines – typically a swifter TRIX and a more gradual TRIX.
TRIX itself is computed through the application of an exponential moving average (EMA) to a single EMA of price changes. This particular calculation is intentionally structured to sift out fleeting price fluctuations and place an emphasis on more extended-term trends.
Subsequently, traders keep a watchful eye on the intersections of the fast and slow TRIX lines. When the fast TRIX line ascends above the slow TRIX line, it generates a bullish crossover signal, signifying the potential commencement of an uptrend. Conversely, if the fast TRIX line descends below the slow TRIX line, it triggers a bearish crossover, indicating a potential onset of a downtrend.
SFI Indicator Entry And Exit
The SFI Entry and Exit Indicator furnishes entry and exit signals via buy/sell arrows. This trading instrument utilizes a non-repainting algorithm, which scrutinizes the historical price data of a currency pair to discern ideal trade entry and exit levels based on the prevailing trend.
While the SFI Entry and Exit Indicator can operate independently for pinpointing buy and sell opportunities, its integration with price action analysis has the potential to enhance overall trading success rates.
MSP Indicator
The MSP indicator designed for MT4 is a potent tool for recognizing potential reversal areas in trading. When certain technical criteria for a valid reversal are met, it signals either a BUY or SELL opportunity. In the realm of Forex trading, trend reversals occur at various zones contingent upon market conditions. Given the diverse narratives that propel market momentum, many Forex traders grapple with swiftly identifying new trends as they shift direction. It’s a challenging task, and understandably so.
This indicator boasts a range of built-in functions tailored to the needs of traders, particularly those in the forex market. For instance, it allows for the adjustment of signal frequency. An increase in frequency results in more signals being generated within a defined timeframe, while a decrease in frequency yields a more restrained number of signals, albeit with potentially higher accuracy within the same timeframe.
EntryExit Trend Indicator
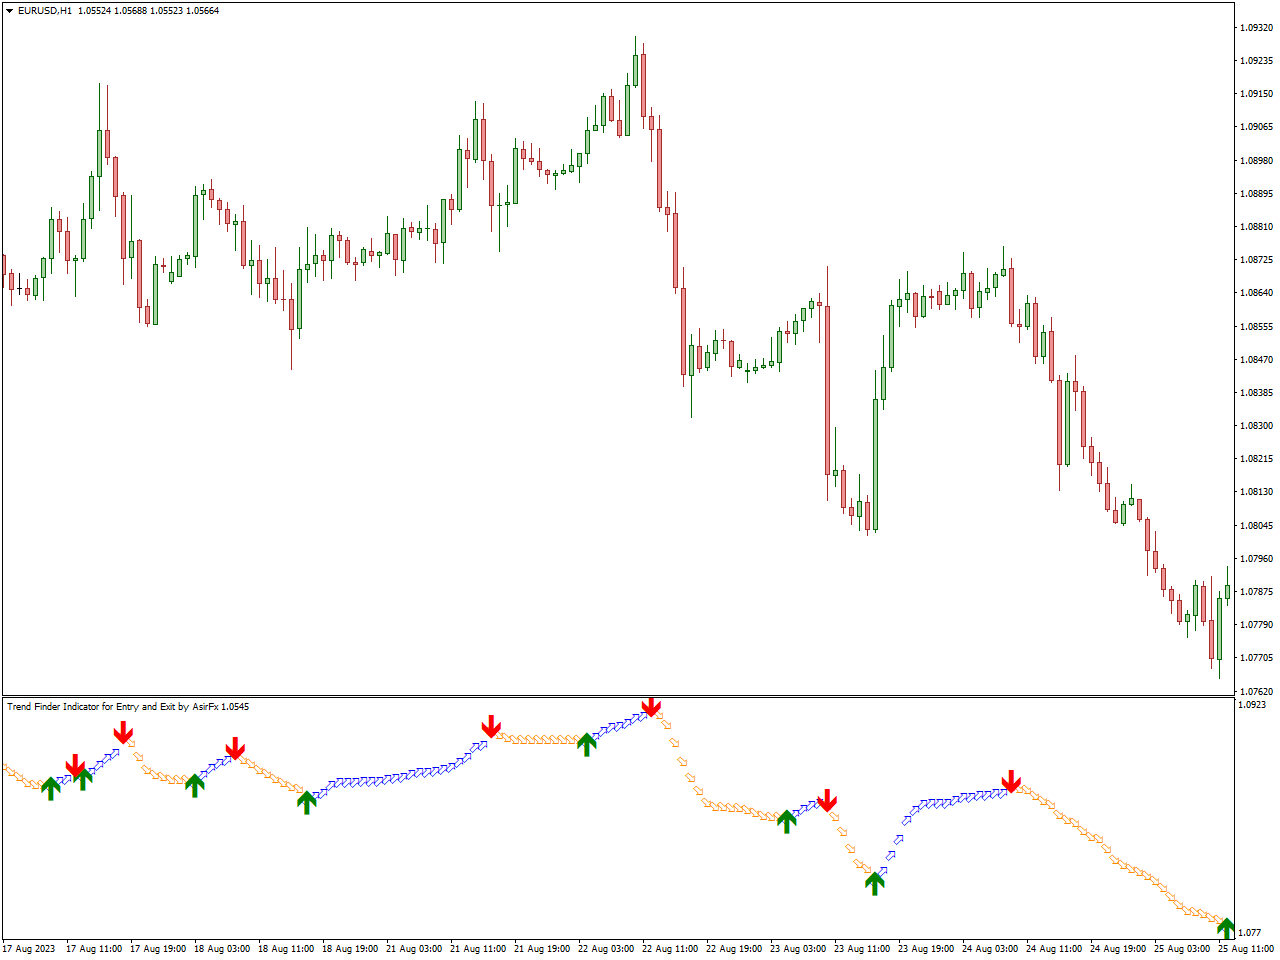
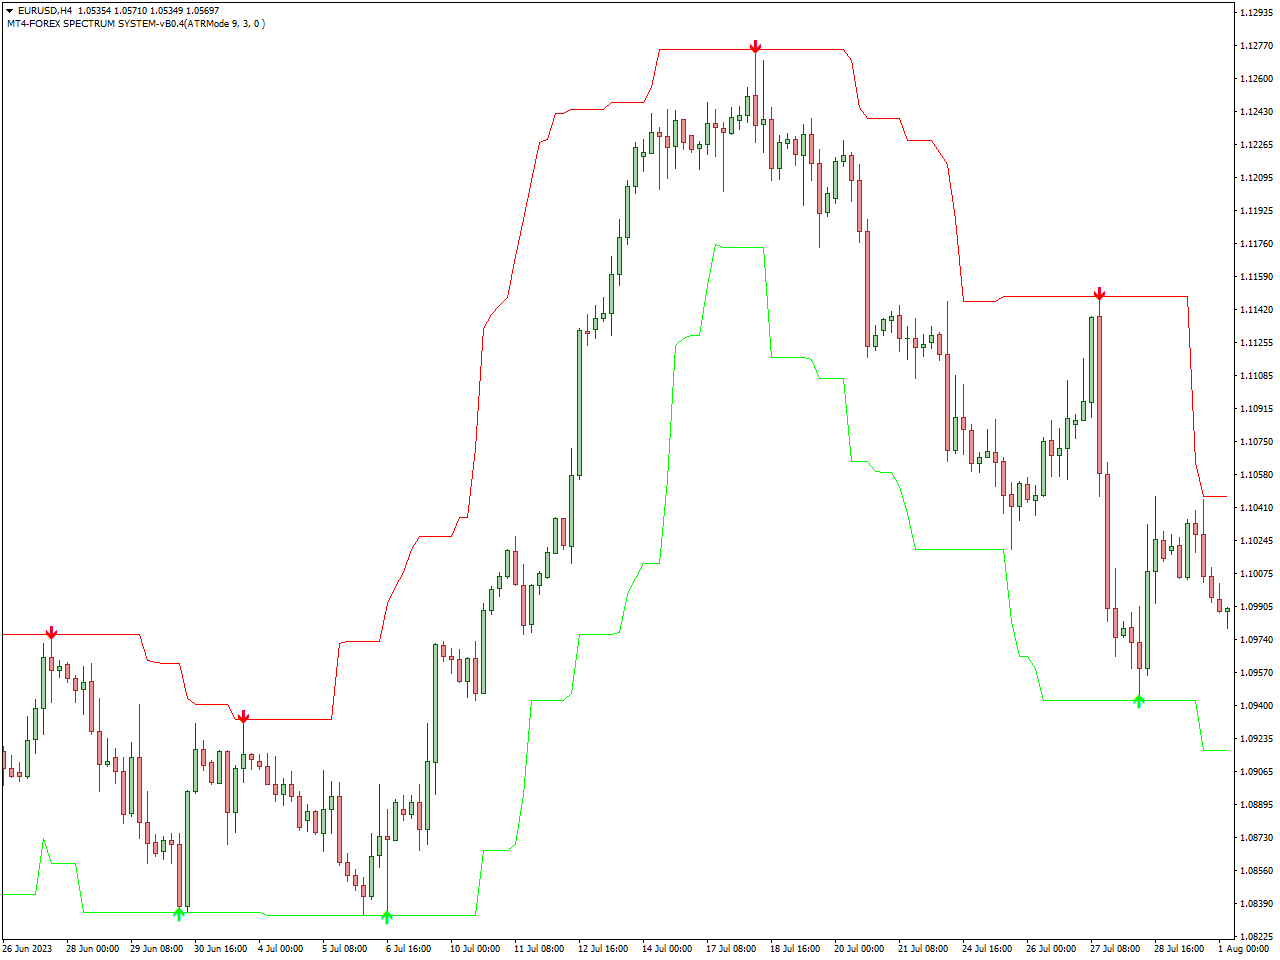
The “EntryExit Trend Indicator” serves as a tool within technical analysis, employed by traders to pinpoint potential entry and exit points in the market, with a specific emphasis on recognizing prevailing trends. Its fundamental objective is to assist traders in enhancing their decision-making process concerning when to initiate or conclude positions based on the current state of the market.
Its core function revolves around discerning the ongoing market trend, be it an upward surge (bullish), a downward slide (bearish), or a lateral movement (range-bound). The indicator interprets this trend and issues corresponding signals or cues for trading actions. For instance, in an uptrend, it may generate “buy” signals, whereas in a downtrend, it could generate “sell” signals. In addition to entry suggestions, it also provides guidance on when to exit a trade, enabling traders to capture profits or mitigate losses. These exit indications may manifest as “take profit” cues or “stop-loss” prompts.
Forex Signals Indicator
A “Forex Signals Indicator” is a technical tool applied in the foreign exchange (forex) market, with the aim of furnishing traders with cues and indications regarding prospective trading opportunities. These indicators are meticulously crafted to empower traders in making well-informed choices concerning the optimal moments to initiate or conclude positions within the forex market.
The foremost purpose of a Forex Signals Indicator is to produce signals that advise on opportune instances to either purchase or sell a specific currency pair. These signals can be grounded in a variety of technical or fundamental criteria, contingent on the particular indicator in use.
These indicators frequently deliver entry signals, imparting guidance to traders on when to inaugurate a trade. For instance, a “buy” signal may signify an advantageous juncture to acquire a currency pair, while a “sell” signal may imply it’s a propitious time to vend. Additionally, apart from entry recommendations, these indicators might also furnish exit signals, offering direction on when to conclude a trade to secure profits or contain losses. These exit cues can manifest as suggestions to “take profit” or “set stop-loss” levels.
Heiken Ashi Indicator
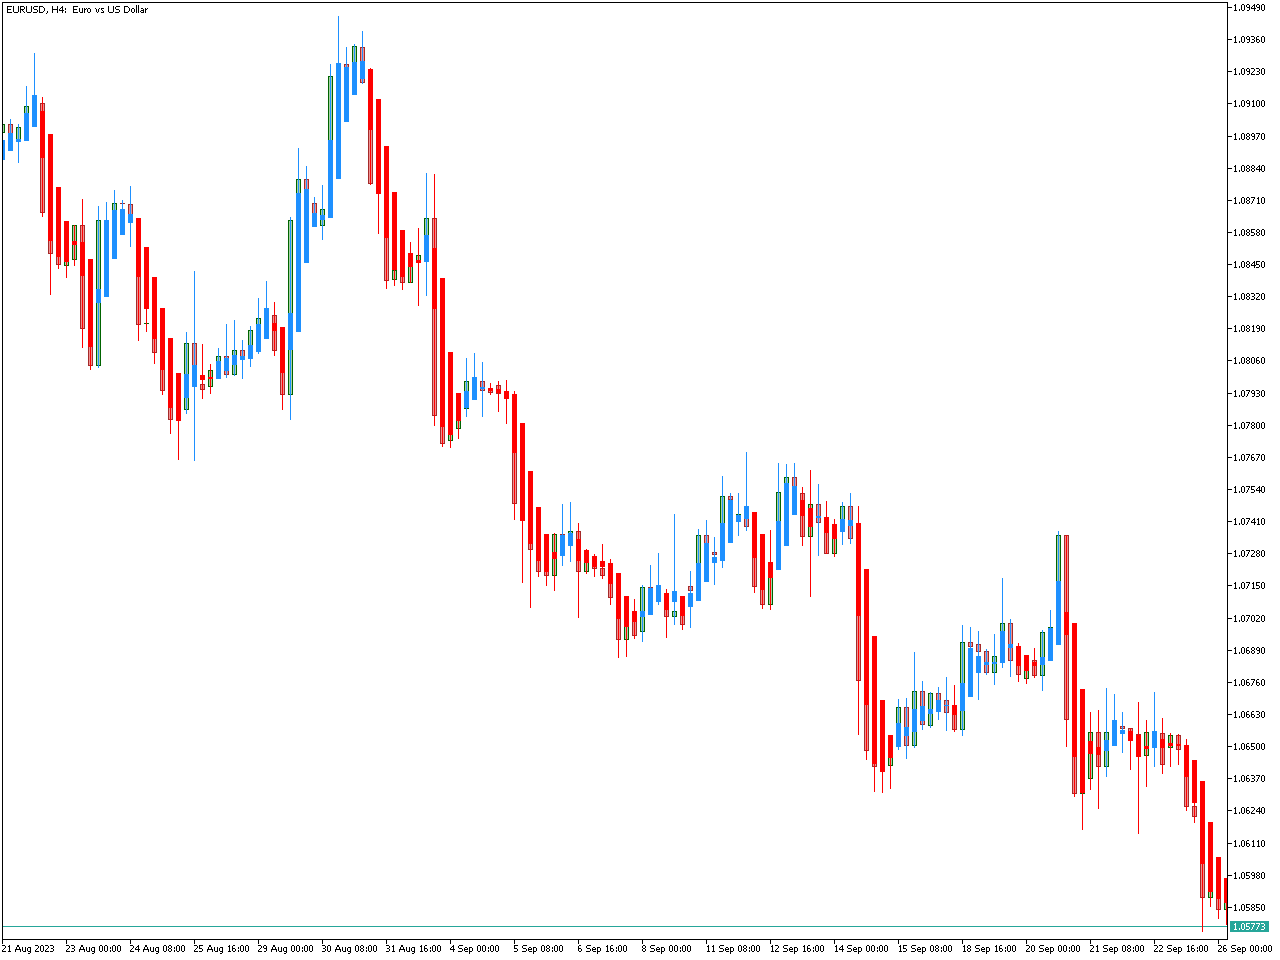
The Heiken Ashi Indicator, also known as Heiken Ashi Candlesticks, stands out as a distinctive form of candlestick chart that finds its utility predominantly within the realm of technical analysis, especially in the field of trading. Its fundamental purpose revolves around the filtration of market noise, offering a more lucid and insightful visual depiction of price dynamics and prevailing trends.
In contrast to conventional candlestick charts, which hinge on open, high, low, and close prices within specified time intervals (such as daily, hourly, or minute segments), Heiken Ashi candlesticks adopt modified formulas for their construction. The underlying design of Heiken Ashi candles centers on the attenuation of price swings, placing greater emphasis on the underlying trends. This makes them particularly adept at mitigating the disruptive influence of market turbulence and erratic price fluctuations.
Heiken Ashi charts are a trusted ally for traders in the pursuit of trend recognition. A sequence of green candles typically signifies an upward trend, while a succession of red candles suggests a downward trajectory. A transition from red to green candles often hints at the potential inception of a new trend. The synergy of Heiken Ashi with other technical indicators is a strategy of choice for traders to validate trading signals. By determining the prevailing trend direction using Heiken Ashi, traders can then deploy complementary indicators to pinpoint optimal entry and exit moments.
Swing ZZ Zigzag Indicator
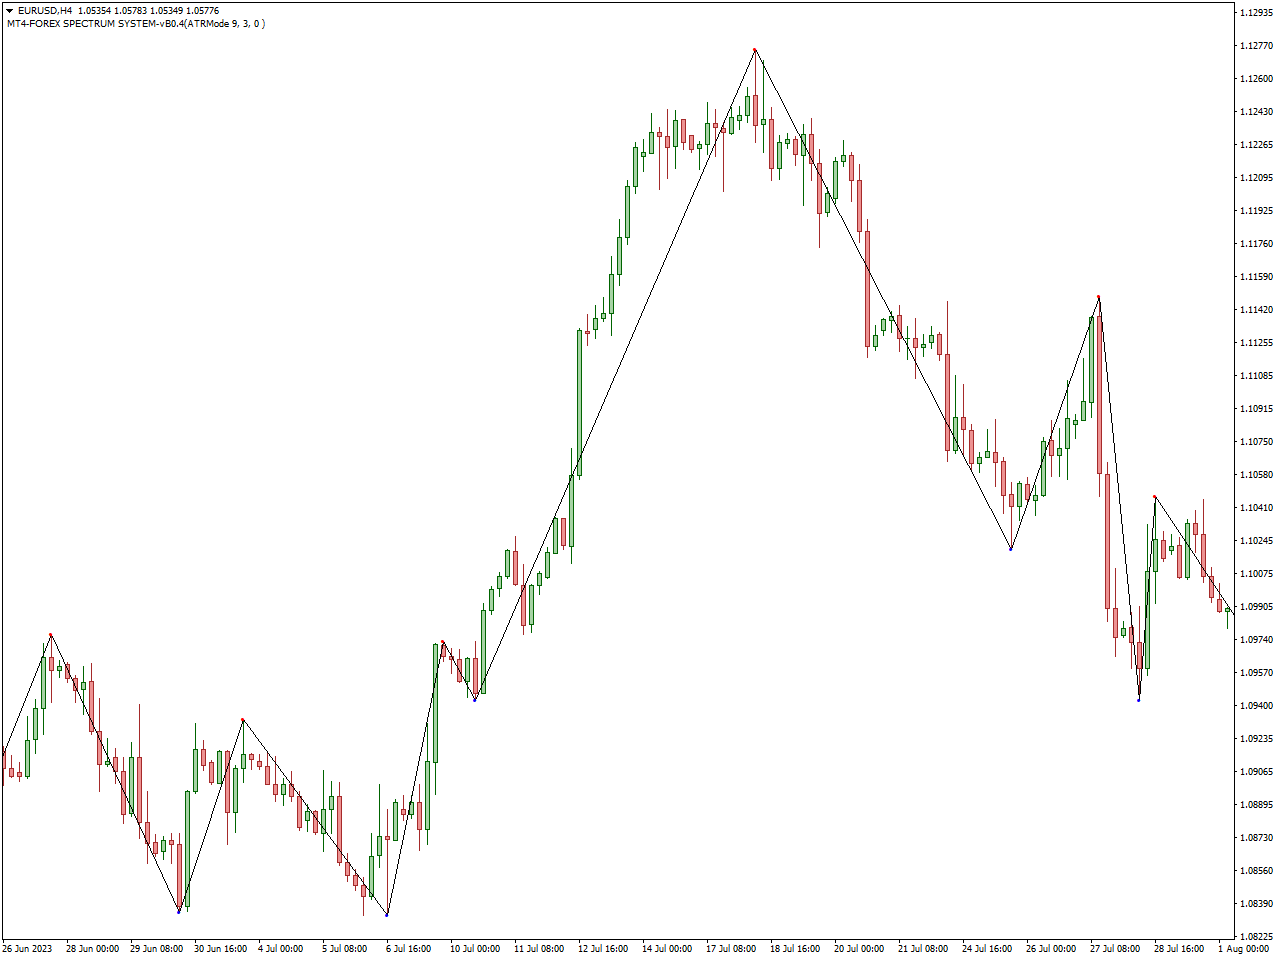
The “Swing ZZ Zigzag Indicator” stands as a tool within the realm of technical analysis, employed by traders to spot substantial price fluctuations or pivotal junctures in a financial market’s price chart. This indicator aids traders in visualizing and scrutinizing market trends by forming lines or zigzag patterns that link noteworthy swing highs and swing lows.
The interconnection of these pivotal swing points creates a zigzag pattern, offering a visual representation of the market’s price oscillations. This zigzag pattern can manifest as a line connecting these pivotal turning points. An intrinsic attribute of this indicator lies in its capacity to filter out market noise and minor price vacillations. Its primary focus revolves around capturing the more pronounced price movements, thereby facilitating traders in distinguishing core trends from fleeting market fluctuations.
Furthermore, the Swing ZZ Zigzag Indicator can be harnessed as a verification tool in conjunction with other technical indicators. For example, traders may employ it to validate a shift in trend identified by a different indicator or to assist in the pinpointing of potential entry and exit points in the market.
FXSSI.ProfitRatio Indicator
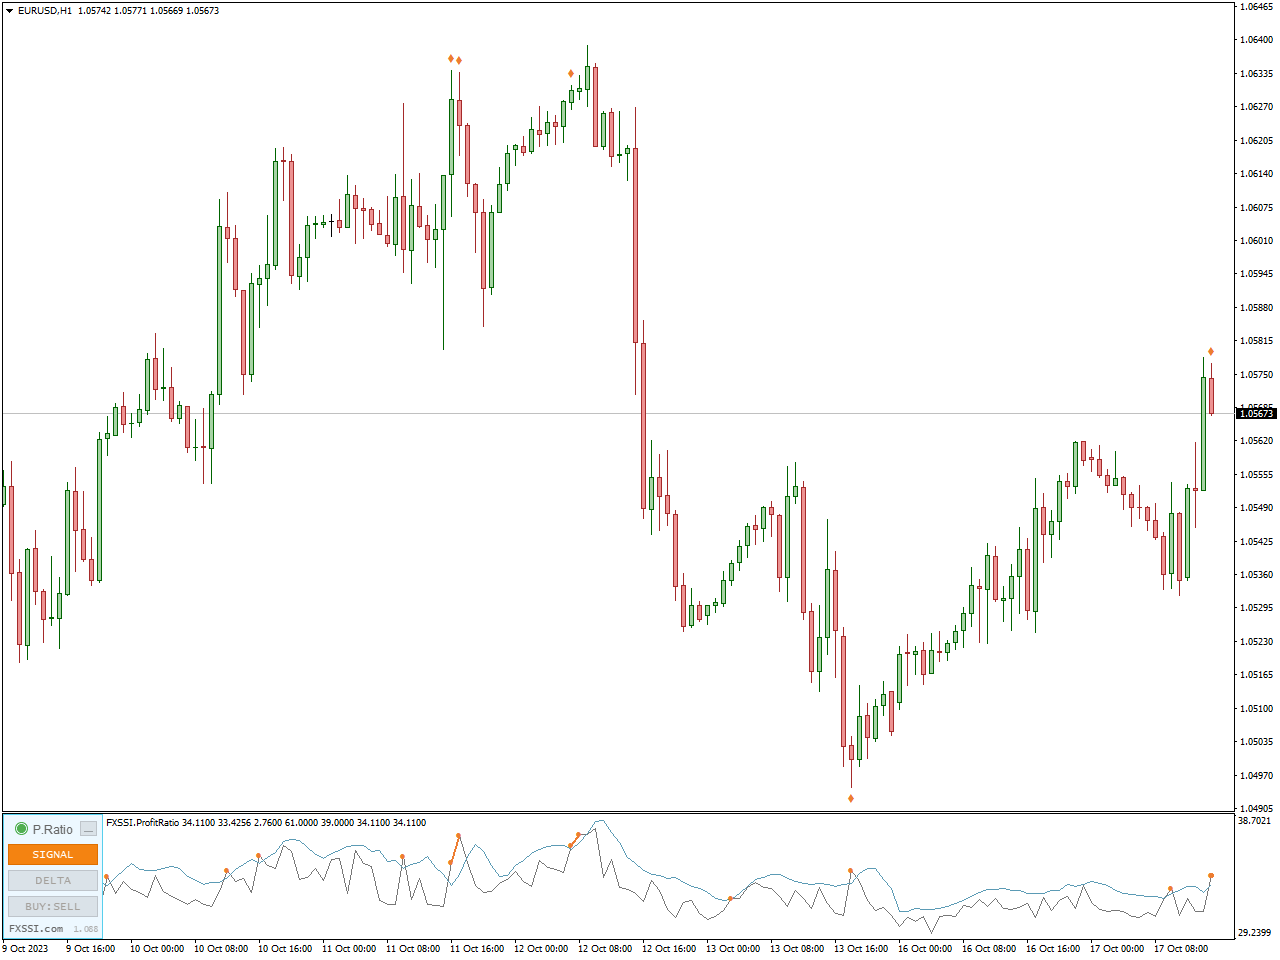
The Profit Ratio indicator reveals the ratio of successful trades compared to unsuccessful ones within the presently open trades. Its purpose is to identify potential reversal levels even before the price initiates a shift in the opposite direction. Upon scrutinizing the price chart, it becomes apparent that nearly all market troughs coincide with a signal emanating from the Profit Ratio indicator.
When a substantial surge in the Profit Ratio is observed over the most recent few candlesticks, it implies that the current movement is deceptive, and an impending price reversal is anticipated.
Notably, this assertion aligns with classical market theory as well. The rationale behind it is as follows: a significant number of winning traders who are actively closing their positions exert pressure on the price to move in the opposite direction.
Regarding the speculative theory of market behavior, the reversal in price can be elucidated by the notion that preceding a major price movement, a prominent market participant initiates a slight maneuver in the contrary direction.
Chandelier Exit Indicator
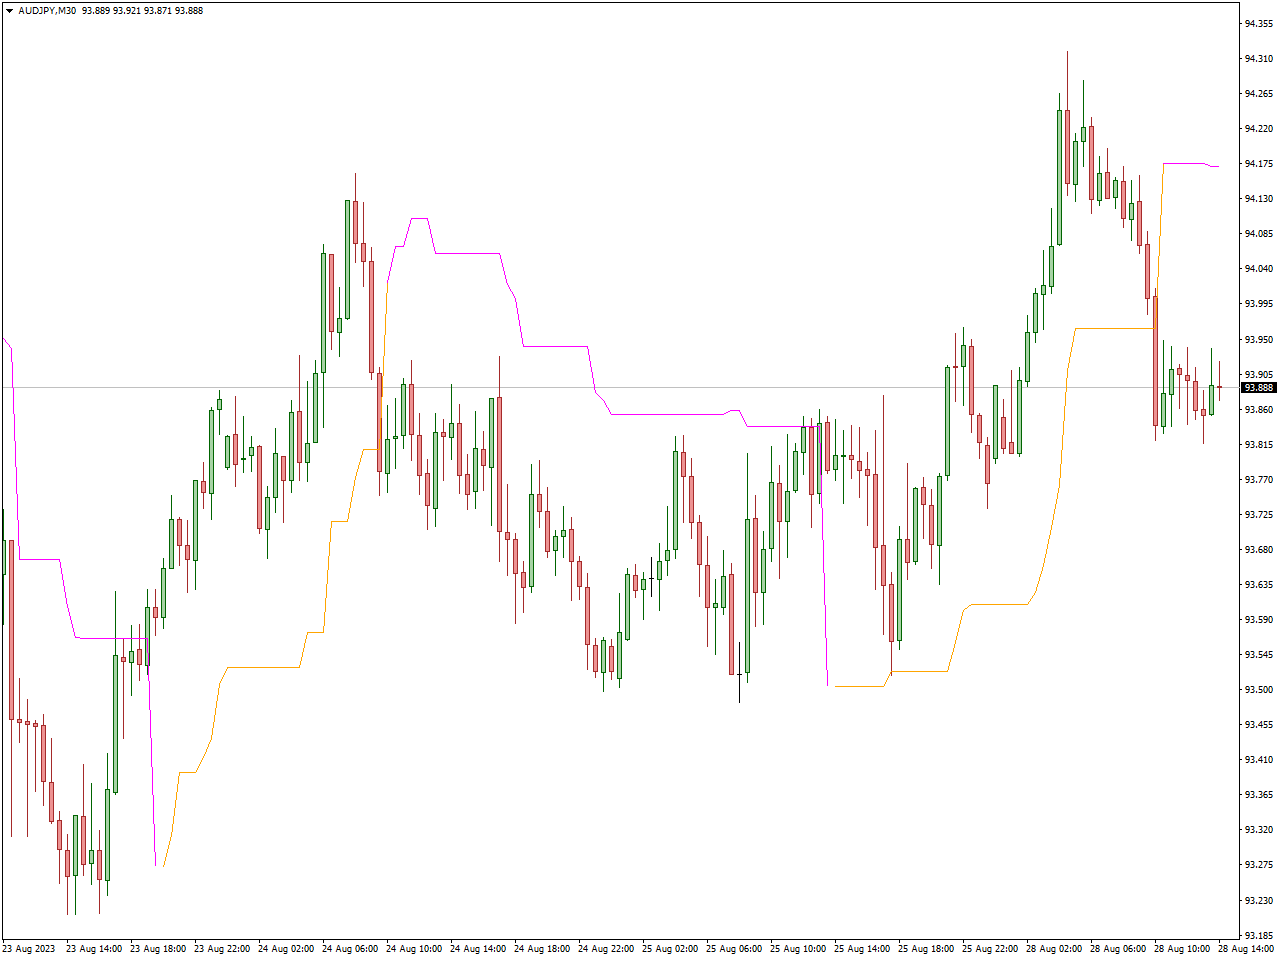
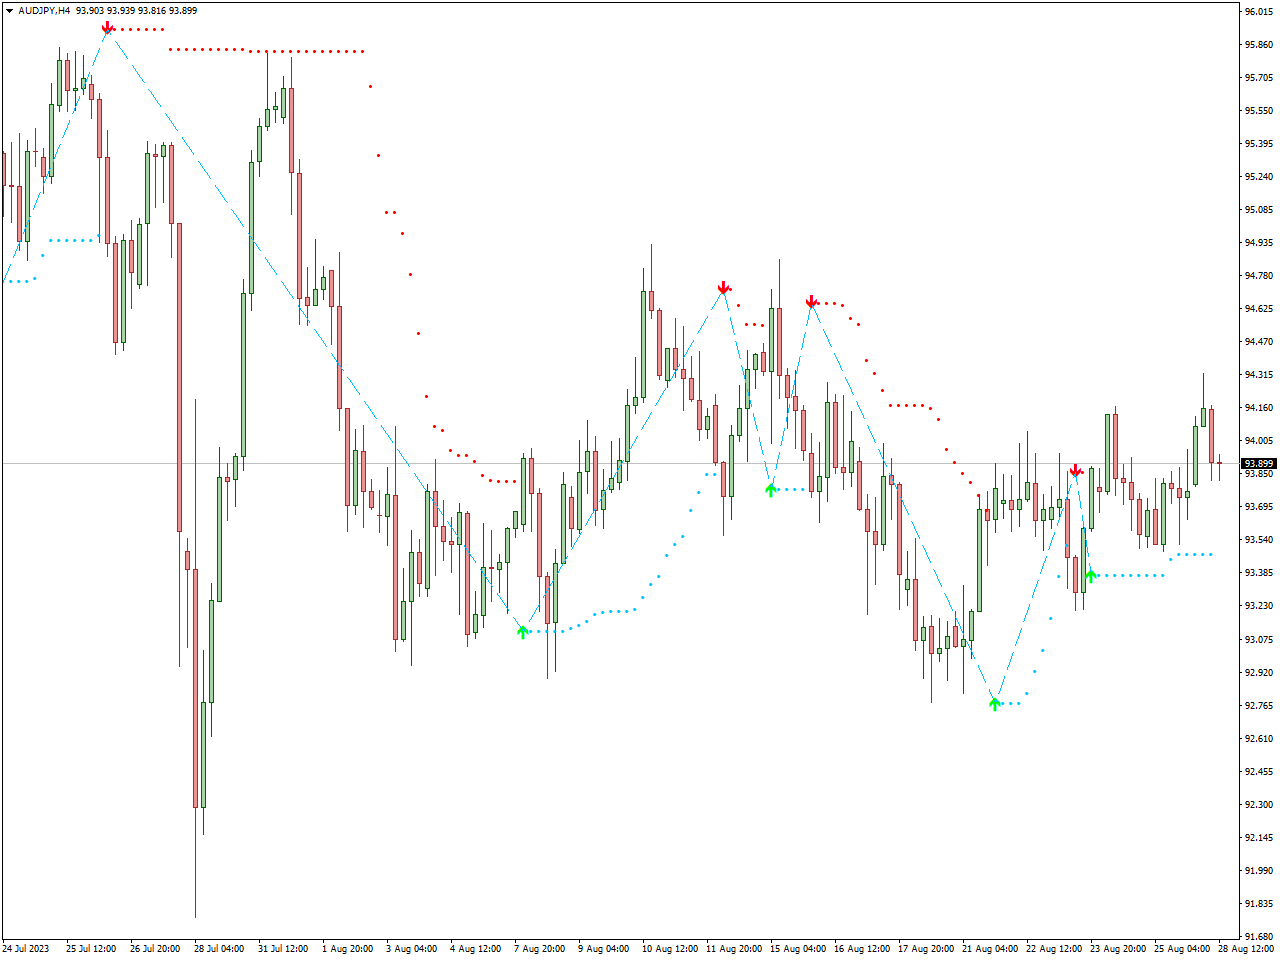
The Chandelier Exit Indicator, named after the analogy of a chandelier hanging from the highest point, is a sophisticated technical analysis tool crafted to assist traders in pinpointing potential exit points for their trades. Its primary objective is to facilitate traders in locating the most advantageous exit positions, whether they are involved in upward or downward price movements.
This indicator exhibits dynamic adaptability by calibrating its position in response to prevailing market volatility. In essence, it encourages traders to abide by the principle of maximizing profits while curtailing losses. During robust trends, the Chandelier Exit Indicator maintains a significant distance from the peak high, allowing the possibility of accumulating gains over time. Conversely, when encountering heightened market volatility or signs of reversals, the indicator narrows its proximity to the highest high, endeavoring to furnish an early exit strategy and safeguard accumulated profits.
To sum up, the Chandelier Exit Indicator serves as a versatile instrument, empowering traders to make more judicious decisions regarding when to conclude their trades. Its ability to adapt to shifting market conditions underscores its pivotal role in striking a harmonious balance between profit maximization and loss minimization, which is a cornerstone of successful trading.
Lucky Reversal Indicator
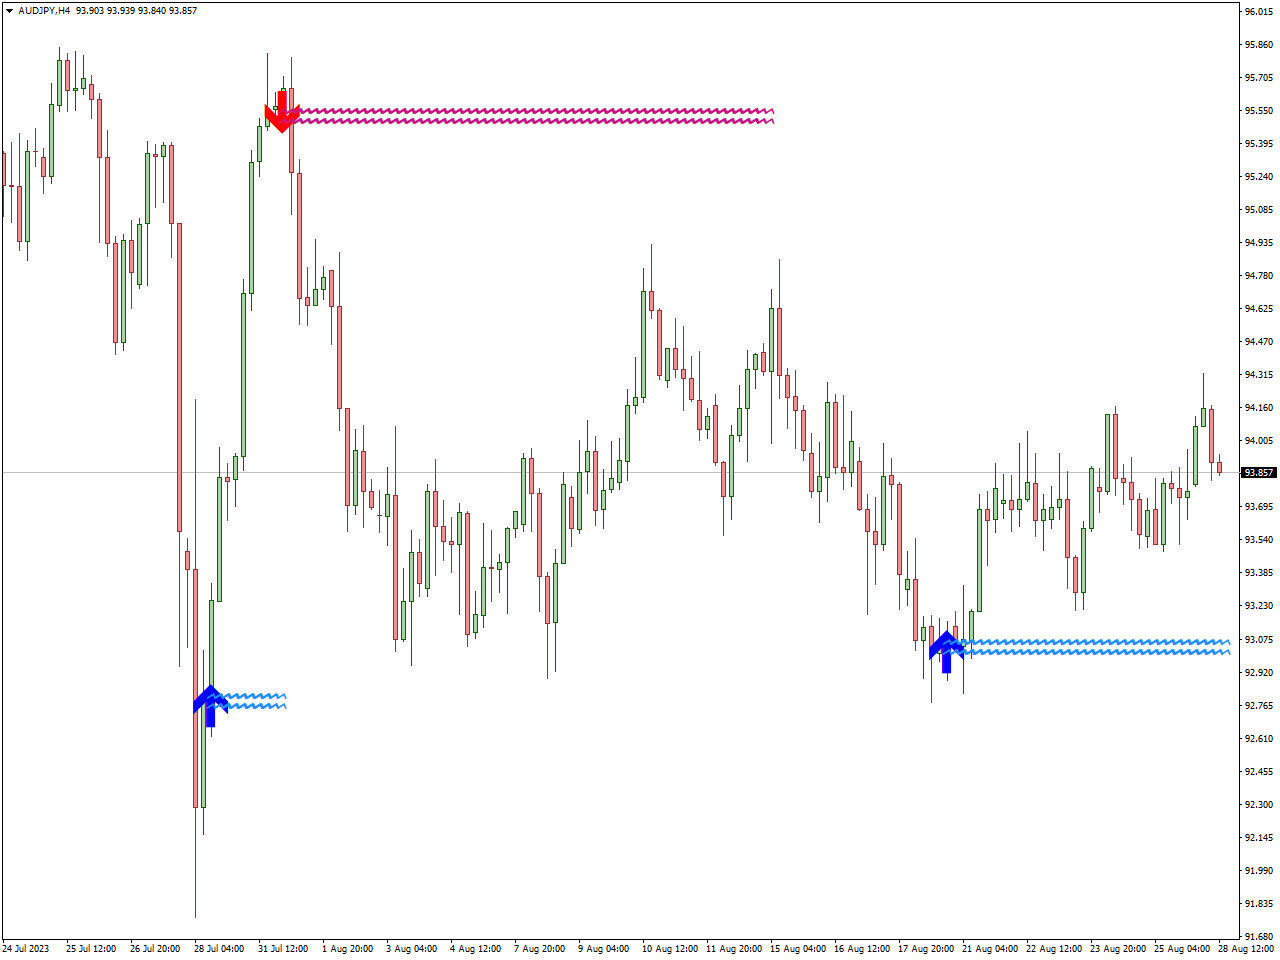
The Lucky Reversal indicator is a trading tool utilized to detect potential shifts in market trends. It achieves this by analyzing price movements and patterns, with the objective of equipping traders with insights into moments when an existing trend might undergo a change in direction.
Delivering its signals through the presentation of buy and sell indicators on the primary chart, the Lucky Reversal MT4 indicator serves to elevate the field of forex trading by offering additional validation for entry and exit points across a diverse range of trading systems and strategies.
The effectiveness of the “Lucky Reversal” indicator is rooted in its capacity to aid traders in foreseeing alterations in market sentiment, thereby enabling more informed trading decisions. As with any trading tool, the wise application and integration of this indicator into a comprehensive trading strategy are imperative for optimizing its advantages.
Half Trend Buy Sell Indicator
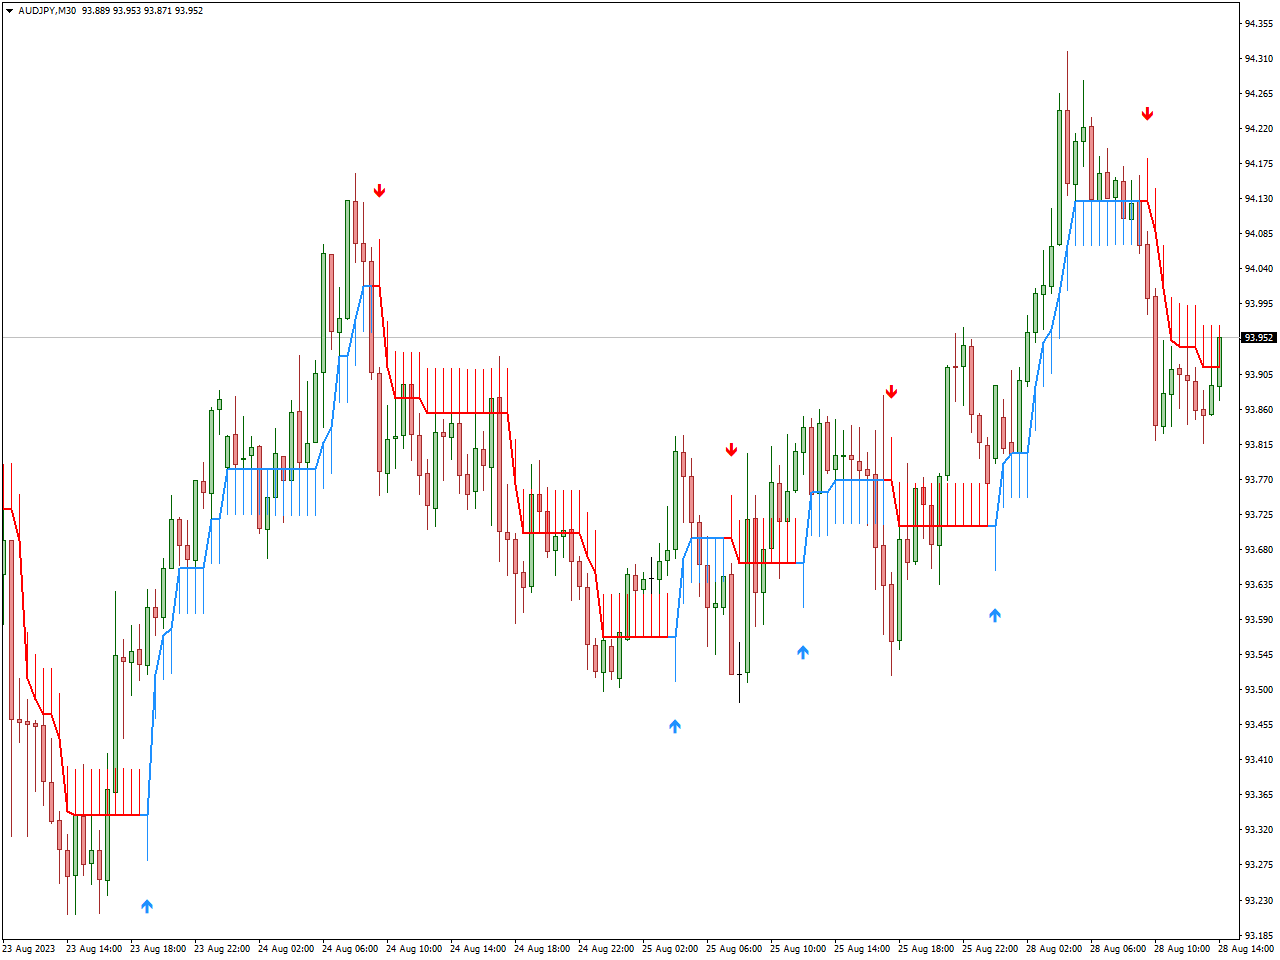
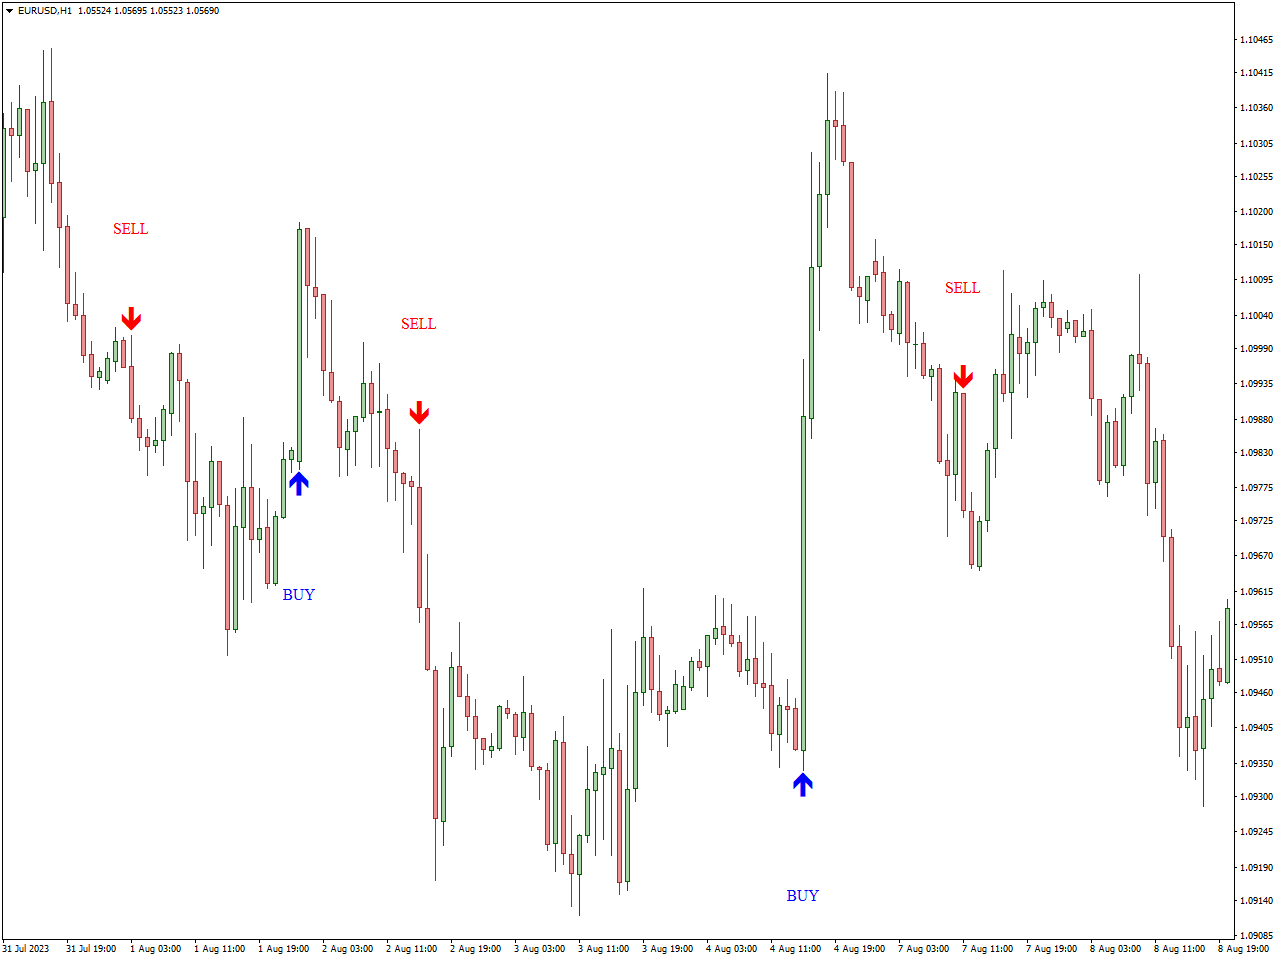
The “Half Trend Buy Sell Indicator” serves as a technical tool within the realm of trading, deployed for the purpose of identifying potential signals for buying and selling in a financial market. Its primary function is to provide traders with valuable insights for making well-considered decisions about when to initiate or conclude trading positions, all contingent upon the prevailing market dynamics.
Through the Half Trend Buy Sell Indicator, buy and sell signals are generated directly on a price chart. A “buy” signal indicates a propitious moment for entering a long (buy) position, while a “sell” signal conveys the appropriateness of entering a short (sell) position. This indicator is primarily honed in on the ongoing market trend, offering guidance to traders in discerning whether the market is currently in an upward (bullish) or downward (bearish) trajectory. The generation of buy and sell signals hinges on the identification of these prevailing trend conditions.
Conclusion
In the fast-paced world of trading, mastering the art of market timing is an essential skill that separates the prosperous from the struggling. The 20 entry and exit indicators we’ve explored in this guide are the precision tools you need to make well-informed decisions in a dynamic marketplace. Whether you’re a day trader or a long-term investor, these indicators can guide your path to success.
As you embark on your trading journey, remember that honing your timing skills is an ongoing process. Each indicator has its unique strengths and applications, and understanding when and how to use them is crucial. The markets are constantly evolving, but with the right tools and a commitment to continuous learning, you can navigate them with confidence.
Integrate these indicators into your trading strategy, consider risk management at all times, and embrace a disciplined approach. As you do, you’ll be better equipped to seize opportunities, mitigate risks, and maximize your potential for success. The path to accurate trading is a journey, but with the knowledge and insights you’ve gained from this guide, you’re well on your way to achieving your trading goals.