

The realm of cryptocurrency trading has transformed into a dynamic and captivating domain that lures traders and investors worldwide. The prospect of substantial profits, intertwined with the ever-shifting market landscape, renders crypto trading both alluring and, at times, challenging. To navigate this digital frontier with finesse, traders must equip themselves with a diverse set of strategies and insights.
At the heart of a cryptocurrency trader’s toolkit lies a deep understanding of technical indicators. These indicators serve as the North Star, guiding traders through the turbulent seas of digital asset markets, enabling them to make well-informed decisions amidst the tumultuous price fluctuations.
Within the pages of this comprehensive article, we will embark on a journey into the realm of cryptocurrency trading. Here, we will unveil the 20 indispensable indicators capable of elevating your trading expedition to new heights of success. Ranging from time-tested pillars of technical analysis to innovative tools harnessing blockchain technology, we will dissect the purpose, functionality, and optimal utilization of each indicator.
Whether you are a seasoned cryptocurrency trader or taking your first steps into this fast-paced arena, these 20 indicators will serve as your steadfast companions on the road to proficiency in cryptocurrency trading. Come with us as we embark on this thrilling odyssey, unlocking the enigmatic world of mastering cryptocurrency trading through the prism of these vital indicators.
Top 20 Cryptocurrency Trading Indicators
- Volume Profile Indicator
- Supply and Demand Zones Indicator
- Auto TrendLine Indicator
- Volatility Quality Zero Line Indicator
- FXSSI.PivotPoints.All-In-One Indicator
- Volume Weighted MA (VWMA) Indicator
- 1-2-3 Pattern Indicator
- EMA Indicator
- Market Profile Trendlines Indicator
- Volatility Quality Indicator
- Round Levels Indicator
- Dark Point Indicator
- Bollinger Bands Indicator
- Support and Resistance Zone Indicator
- Super Trend Indicator
- Wolfe Waves Indicator
- MA Crossover Alerts Indicator
- MTF.HighLow Indicator
- Spearman Correlation Indicator
- TTM Scalper Indicator
Volume Profile Indicator
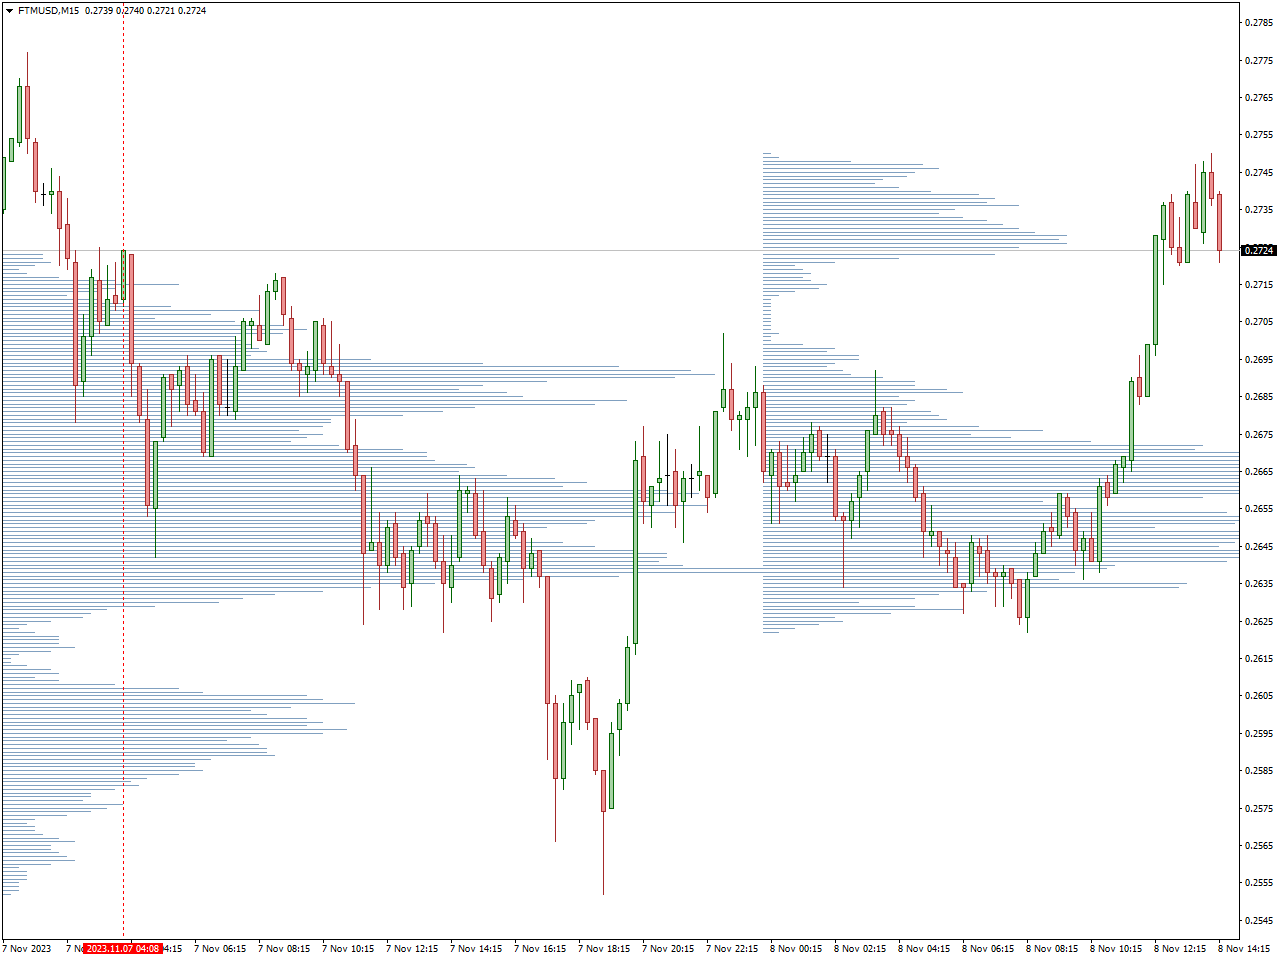
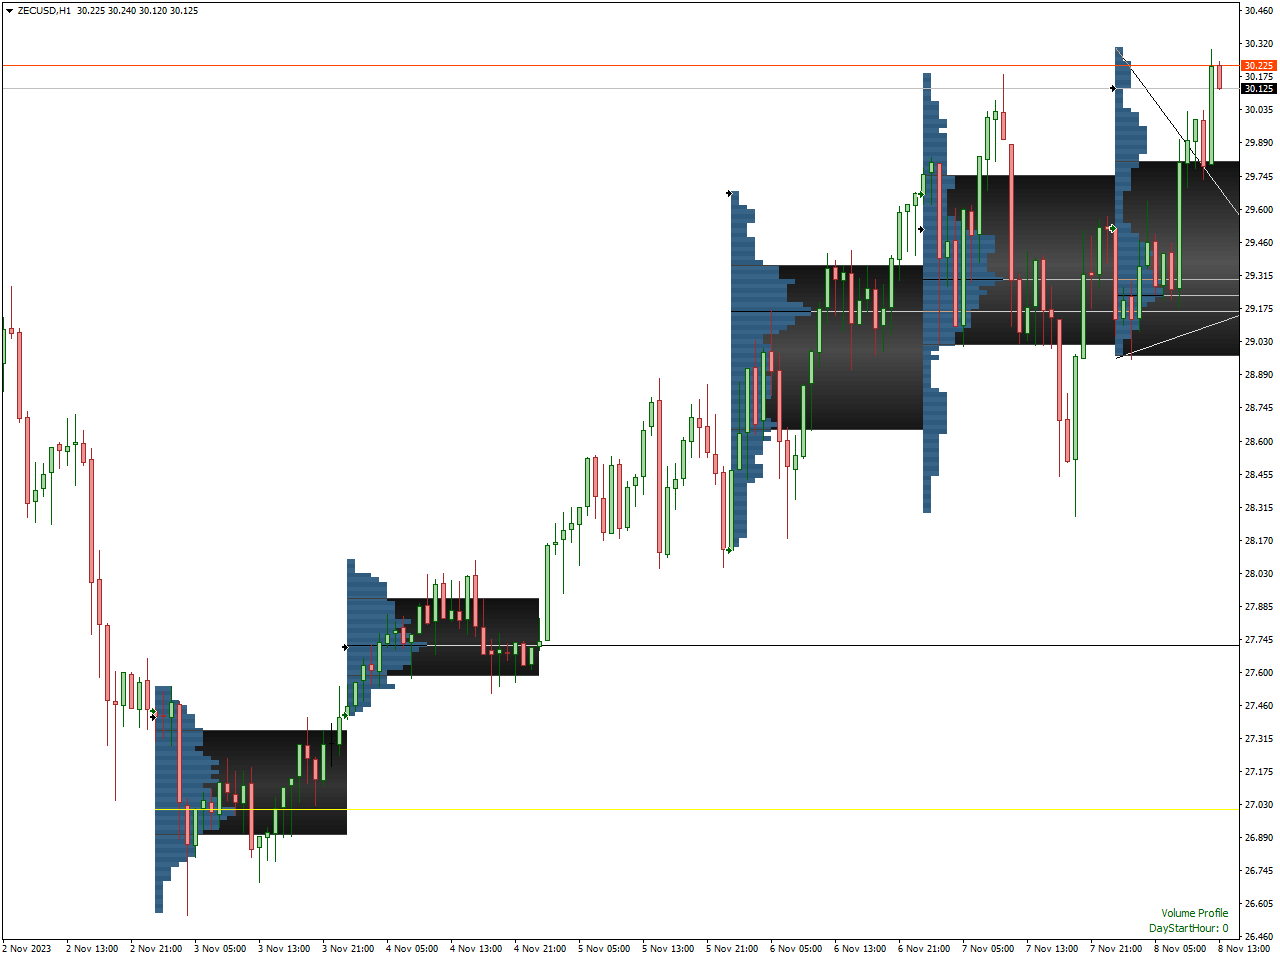
The Volume Profile Indicator is a formidable tool within the realm of technical analysis, serving the essential function of analyzing and displaying trading volume at discrete price levels within a specified timeframe. It has gained substantial popularity, particularly among traders in various financial markets, including the ever-vibrant forex market. This popularity is attributed to its capacity to offer invaluable insights into market dynamics and to highlight price levels where significant trading activities occur.
This indicator segments the price chart into horizontal bars or profiles, each of which represents a distinct price range or level. Subsequently, it maps out the volume of trading activity at each of these price levels over the chosen time interval.
Traders leverage the Volume Profile Indicator to pinpoint pivotal price levels, identify support and resistance zones, and detect potential breakout or reversal points. It often operates harmoniously with other technical analysis tools, enhancing the ability to make well-informed trading decisions.
Supply and Demand Zones Indicator
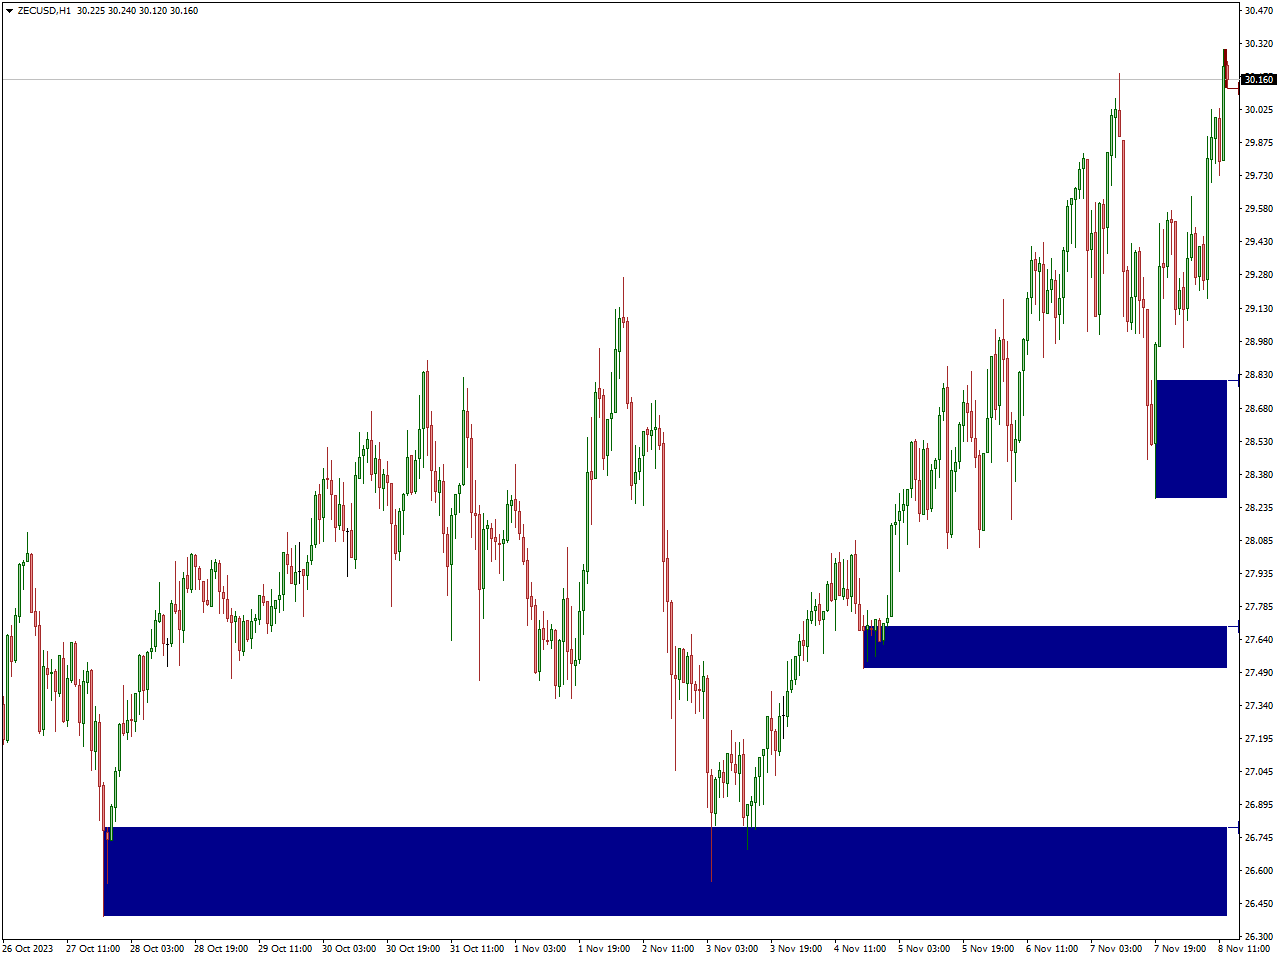
The Supply Demand Zones Indicator serves as a trading tool employed to spot regions on a price chart where disparities in supply (sellers) and demand (buyers) might manifest.
These delineated zones draw attention to conceivable levels where alterations in market sentiment may arise, potentially resulting in reversals or substantial price fluctuations.
It is worth emphasizing that proficiently utilizing this indicator demands a comprehensive understanding of its inner workings, calculation techniques, and how it harmonizes with your overarching trading strategy. Prior to assimilating any trading tool or strategy into your trading pursuits, it is advisable to engage in meticulous research and approach its application with judicious consideration.
Auto TrendLine Indicator
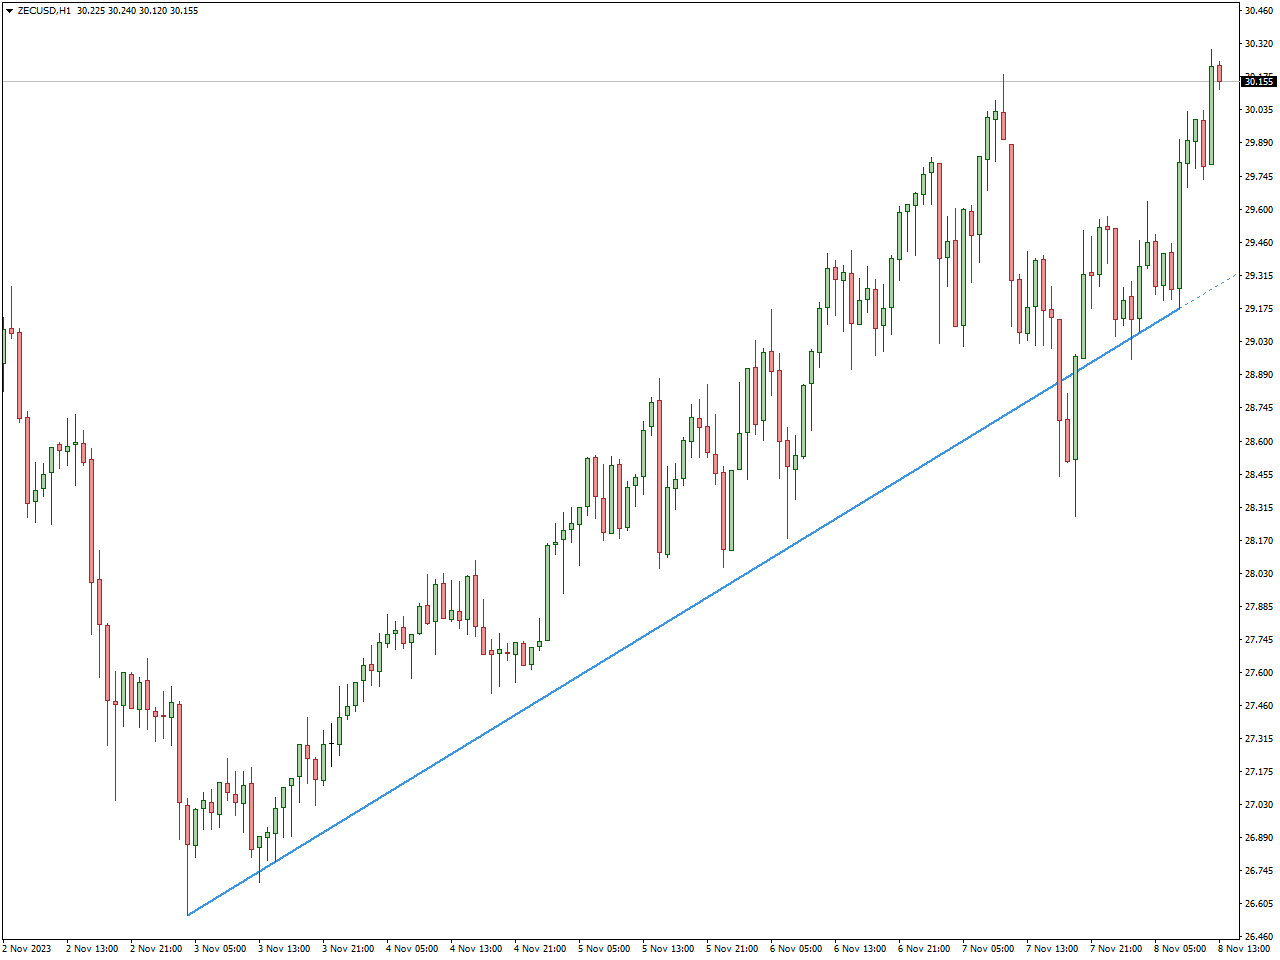
The Auto TrendLine Indicator serves as a technical tool that eases the process by automatically plotting trend lines on price charts. This facilitation aids traders in identifying prevailing trends and potential trading opportunities. In the context of “long” trading positions, where the goal is to capitalize on upward price movements, the Auto TrendLine Indicator can be particularly advantageous.
Operationalizing the Auto TrendLine Indicator entails its autonomous generation of trend lines directly onto charts. These lines serve the purpose of visually representing and delineating the trajectory of price trends, rendering the identification of prospective entry and exit points a more straightforward task.
For traders engaged in “long” trades and employing the Auto TrendLine Indicator, a strategic move might involve considering an exit strategy when the trend line displays indications of a reversal. Such signs may manifest through alterations in the trend line’s slope or its breach. Alternatively, traders can explore the application of predetermined profit targets or trailing stop orders to secure gains as prices experience an ascent.
Volatility Quality Zero Line Indicator
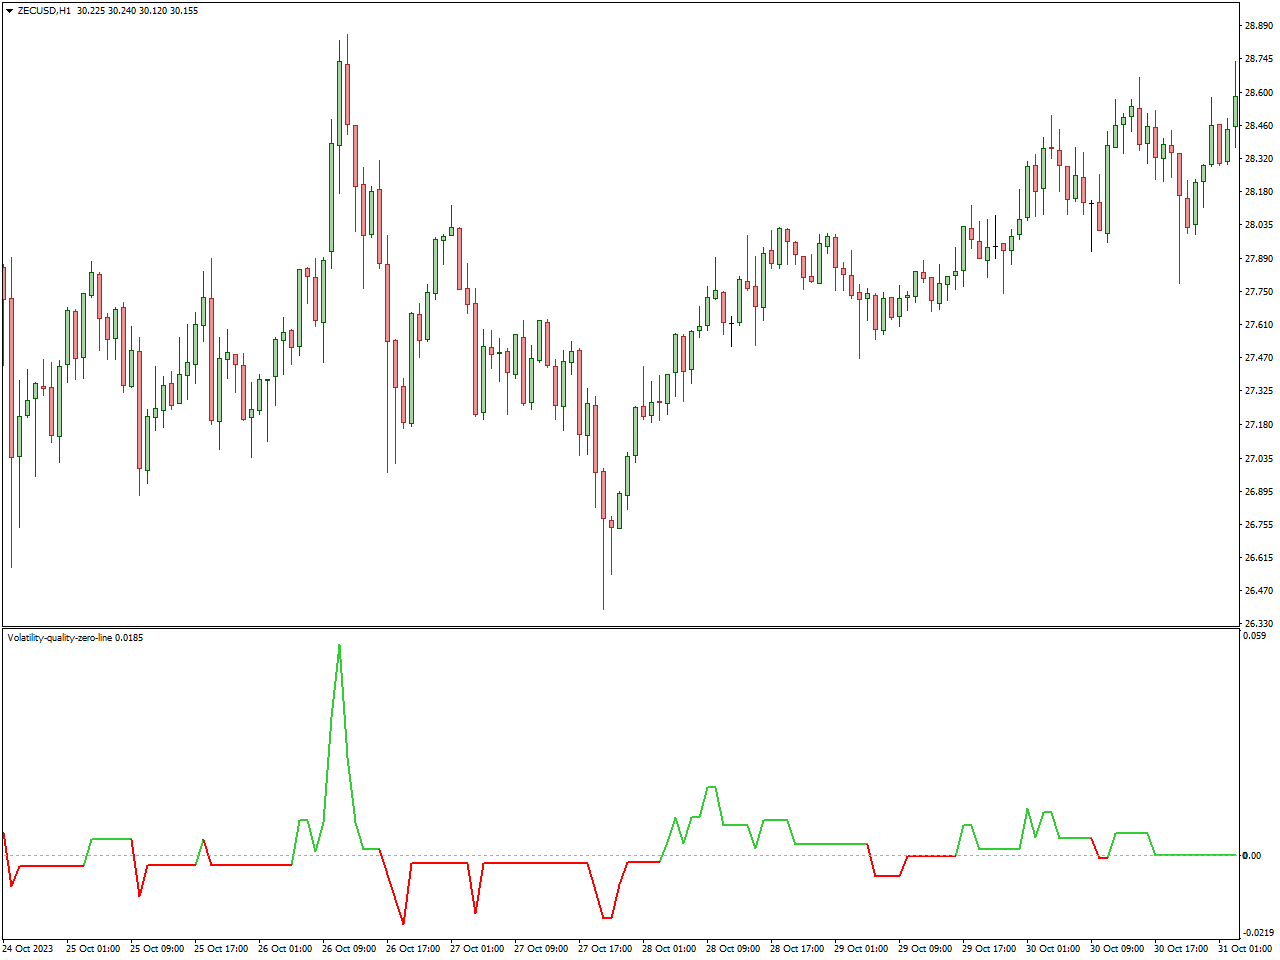
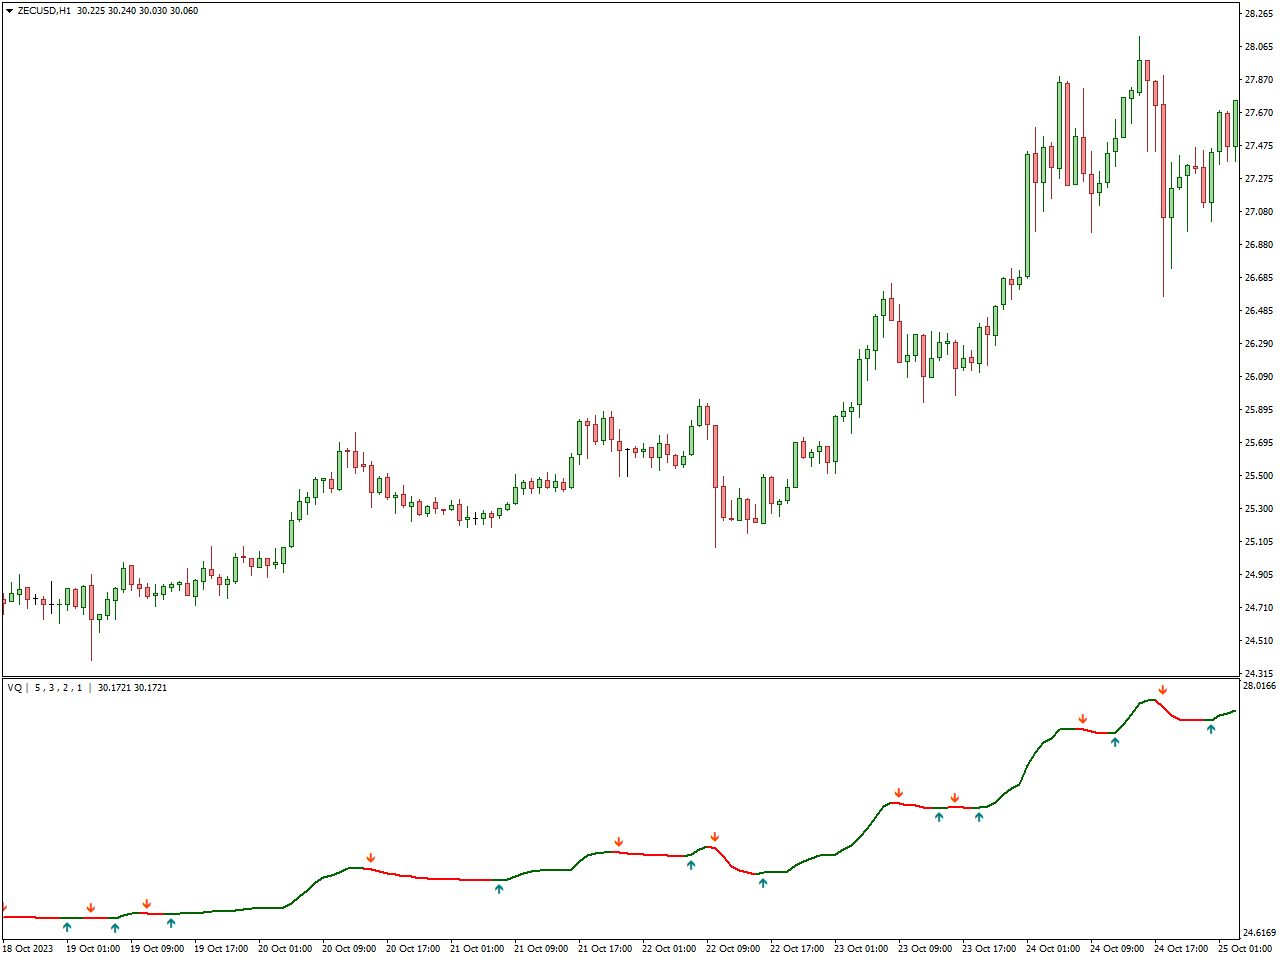
The Volatility Quality Zero Line Indicator functions as a technical tool embraced by traders for the purpose of evaluating the strength and size of market volatility. This indicator stands as an invaluable asset for traders seeking to appraise the importance of price movements and potential shifts in a financial market’s trend.
In operation, the Volatility Quality Zero Line Indicator introduces a zero line onto a price chart and quantifies price oscillations concerning this reference line. As the indicator readings move beyond the zero line, they denote an escalation in market volatility, potentially signifying the commencement of a substantial price trend. Conversely, when these readings dip below the zero line, it implies a reduction in volatility, which may indicate a phase of consolidation or reduced price fluctuations.
Traders frequently incorporate this indicator into their toolset to identify optimal entry and exit junctures, particularly during periods of heightened volatility when trends are more prone to materialize. Through an assessment of the caliber and vigor of market volatility, traders can make more discerning choices in shaping their trading strategies.
FXSSI.PivotPoints.All-In-One Indicator
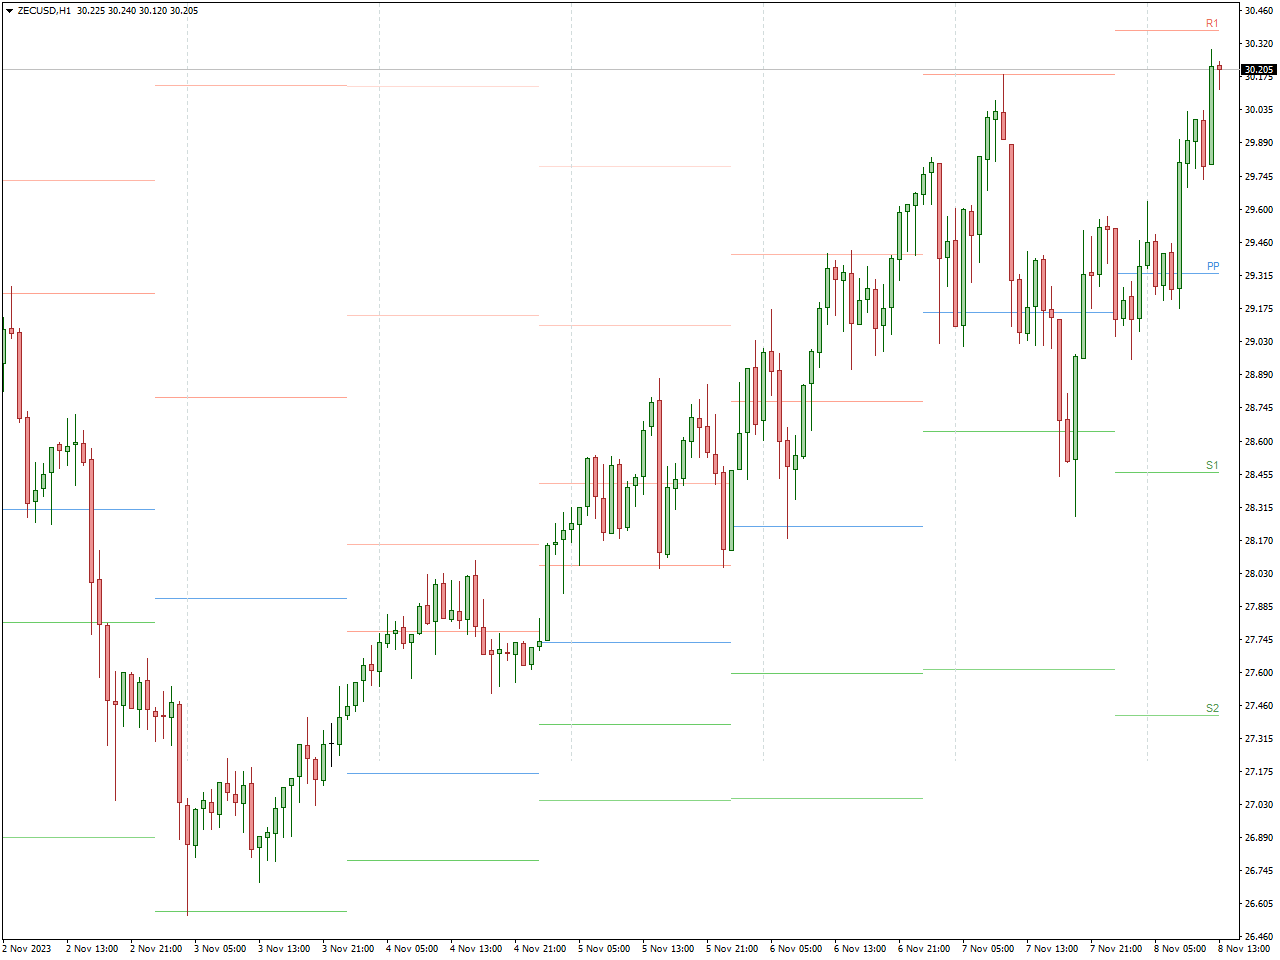
The FXSSI Pivot Points All-In-One Indicator is a comprehensive technical tool embraced by traders in the world of financial markets to ascertain pivotal support and resistance levels. It amalgamates an array of pivot point variants, encompassing the classic, Woodie, Camarilla, and Fibonacci pivot points, thus serving as a versatile resource for traders.
Pivot points stand as vital price milestones that offer directional cues for potential price movements. The FXSSI Pivot Points All-In-One Indicator streamlines the otherwise intricate process of computing and charting these pivotal levels onto price graphs. Traders leverage pivot points to discern crucial zones where price may encounter support or resistance, thereby guiding their choices regarding entry and exit points in their trading activities.
This indicator stands as a valuable augmentation to a trader’s toolkit, presenting diverse pivot point systems within a single tool. This versatility permits traders to select the pivot point methodology that aligns most effectively with their unique trading strategies and preferences. In essence, it enhances the capacity for making well-informed trading decisions by shedding light on conceivable price levels where market sentiment may undergo transformation.
Volume Weighted MA (VWMA) Indicator
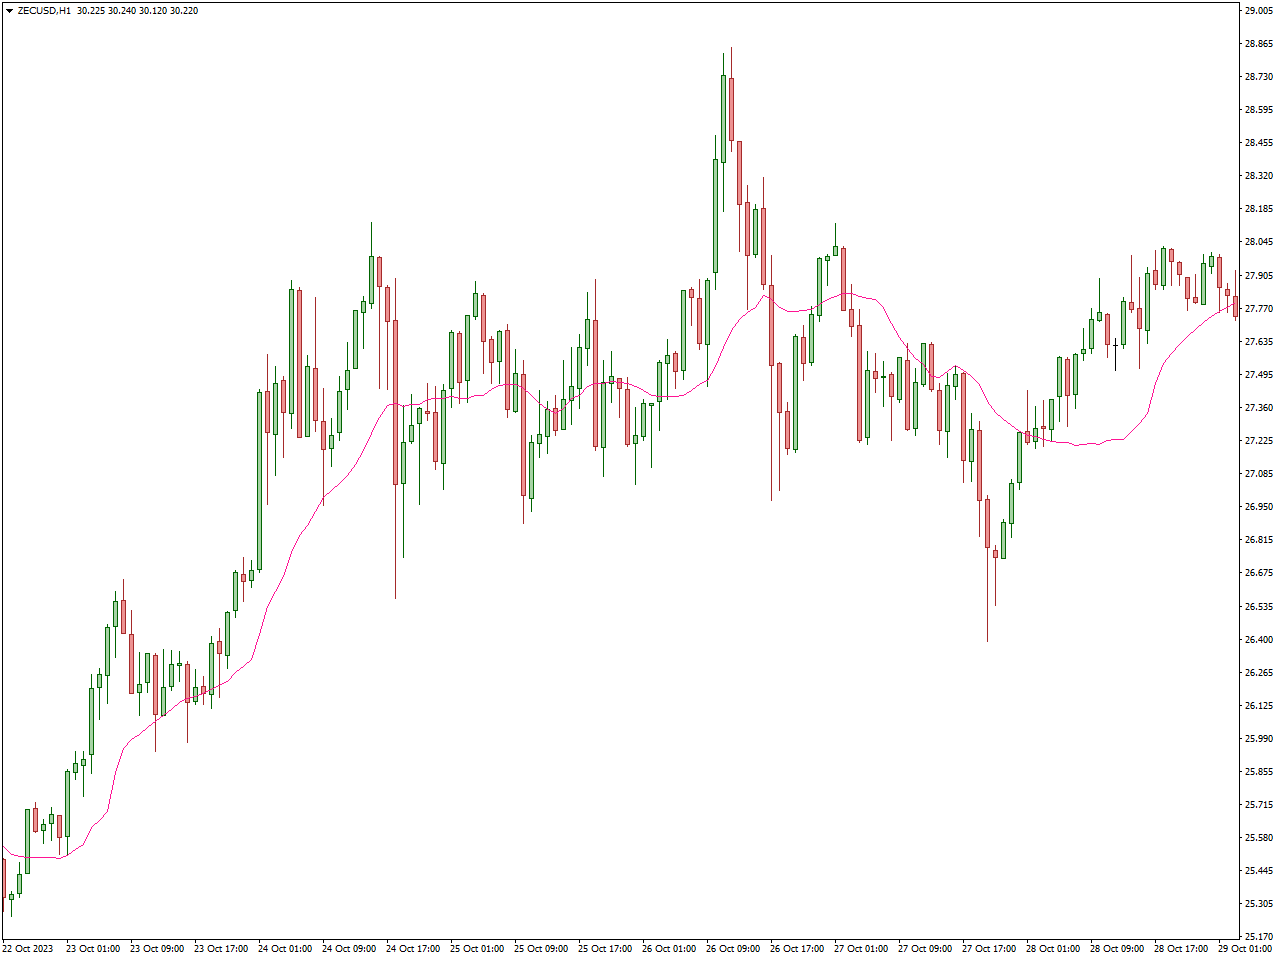
The Volume Weighted Moving Average (VWMA) Indicator holds a prominent position in the realm of technical analysis, extensively employed across various financial markets, including the forex market. What distinguishes it from conventional moving averages is its unique feature of factoring in not only price data but also trading volume when computing the average price. This distinctive attribute bestows upon it an exceptional value, especially for traders seeking to delve into the intricate relationship between price fluctuations and trading volume.
The VWMA is designed to calculate the average price over a specific time frame, with a heavier emphasis on periods characterized by heightened trading volume. This methodology effectively amalgamates both price and volume data, providing a more precise depiction of market dynamics. By taking trading volume into account, the VWMA conveys the importance of price movements occurring in conjunction with elevated trading activity. In essence, it spotlights price levels where a substantial concentration of trading interest is manifested.
Crossovers that occur between the VWMA and the price chart hold the potential to generate significant trading signals. For instance, when the price crosses above the VWMA, it may signal a prospective buying opportunity, while a crossover below the VWMA might signify a potential selling point.
1-2-3 Pattern Indicator
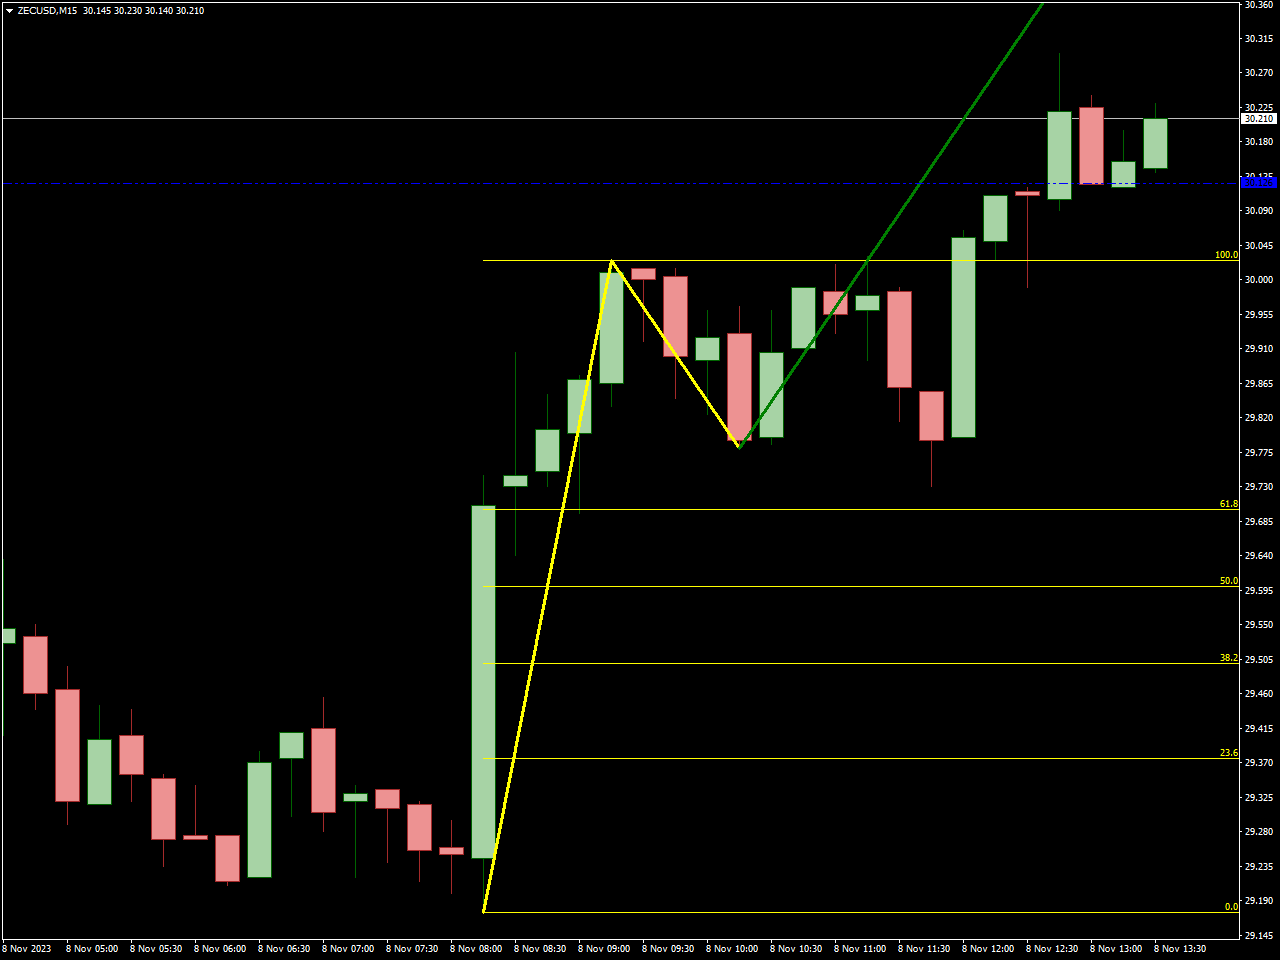
The 1-2-3 Pattern Indicator is a technical analysis tool used by traders to identify specific chart patterns that may indicate potential trend reversals or continuations. These patterns are known for their simplicity and effectiveness in spotting changes in market sentiment.
This pattern can be either bullish (indicating an uptrend continuation) or bearish (indicating a downtrend continuation). Traders use the 1-2-3 Pattern Indicator to visually highlight these patterns on price charts, making it easier to identify potential trade opportunities.
EMA Indicator
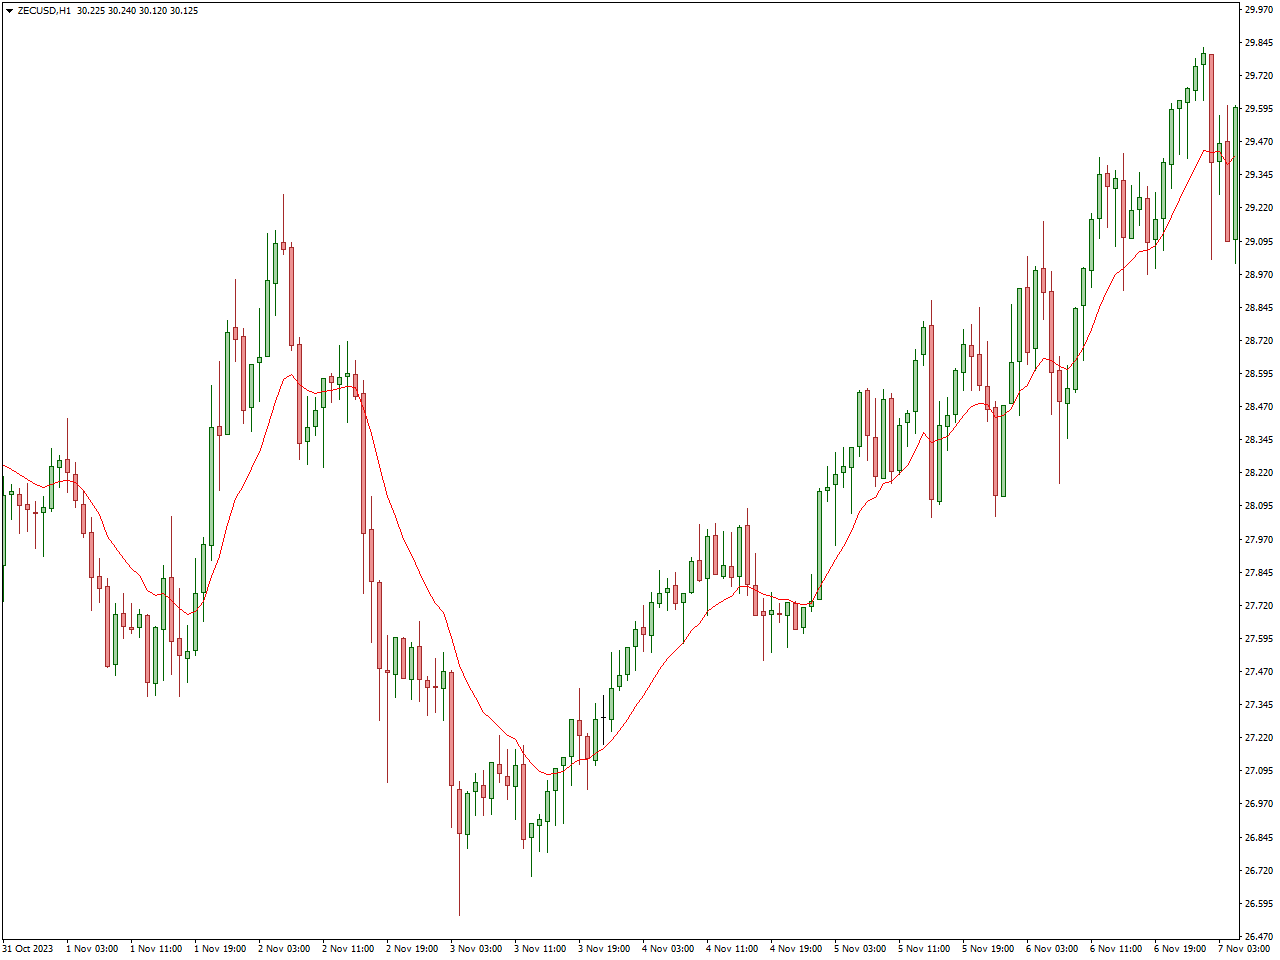
The Exponential Moving Average Indicator, often known as the EMA Indicator, holds a prominent position as a well-regarded technical analysis tool employed in various financial markets, including stocks, forex, commodities, and cryptocurrencies. What sets it apart from conventional moving averages is its distinctive attribute of being highly responsive to recent price changes, granting it an edge in the world of technical analysis.
The primary hallmark of the EMA is its exceptional sensitivity to recent price movements. By assigning greater weight to the most recent data, it promptly reacts to price fluctuations, distinguishing it from the more traditional Simple Moving Average (SMA). This heightened responsiveness renders it a favored choice among traders seeking to detect short-term trends and potential entry and exit points.
Additionally, the EMA finds application in the identification of divergence between the indicator itself and the price chart. Such divergence can serve as an indicator of potential trend reversals, further enhancing its utility in the realm of technical analysis.
Market Profile Trendlines Indicator
The Market Profile Trendlines Indicator is a valuable technical analysis tool embraced by traders to gain insights into the market profile, a representation of both price and volume data. This particular indicator is dedicated to the task of recognizing and sketching trendlines within the market profile, ultimately aiding in the analysis of market trends and facilitating decision-making.
The Market Profile serves as a graphical portrayal that illustrates the distribution of price and volume throughout a defined time frame. When trendlines are drawn within this profile, traders can pinpoint possible support and resistance levels, while also visualizing the prevailing trends in the market.
Utilizing the Market Profile Trendlines Indicator, traders are better equipped to make well-informed choices regarding their entry and exit strategies by taking into account the observed trendlines. This analysis hinges on the interplay between price and volume within the market profile, enabling traders to identify critical levels and potential trading opportunities.
Volatility Quality Indicator
The Volatility Quality Indicator is a technical tool frequently employed by traders to gauge the intensity and reliability of market volatility. It serves as a valuable asset for traders seeking to comprehend the significance of price movements and potential shifts in a financial market’s trajectory.
This indicator conducts an assessment of market volatility by scrutinizing recent price fluctuations in relation to a predefined reference line, which is commonly set at zero. When the indicator readings ascend beyond this reference line, it signifies an upsurge in market volatility, implying the potential onset of a substantial price trend. Conversely, when the readings dip below the reference line, it implies a decrease in volatility, signaling a phase of consolidation or reduced market activity.
Traders often turn to the Volatility Quality Indicator as a means to identify opportune moments for entering or exiting trades, especially during periods of heightened volatility where significant price trends are more likely to materialize. By evaluating the caliber and magnitude of market volatility, traders are better equipped to make well-informed decisions when crafting their trading strategies.
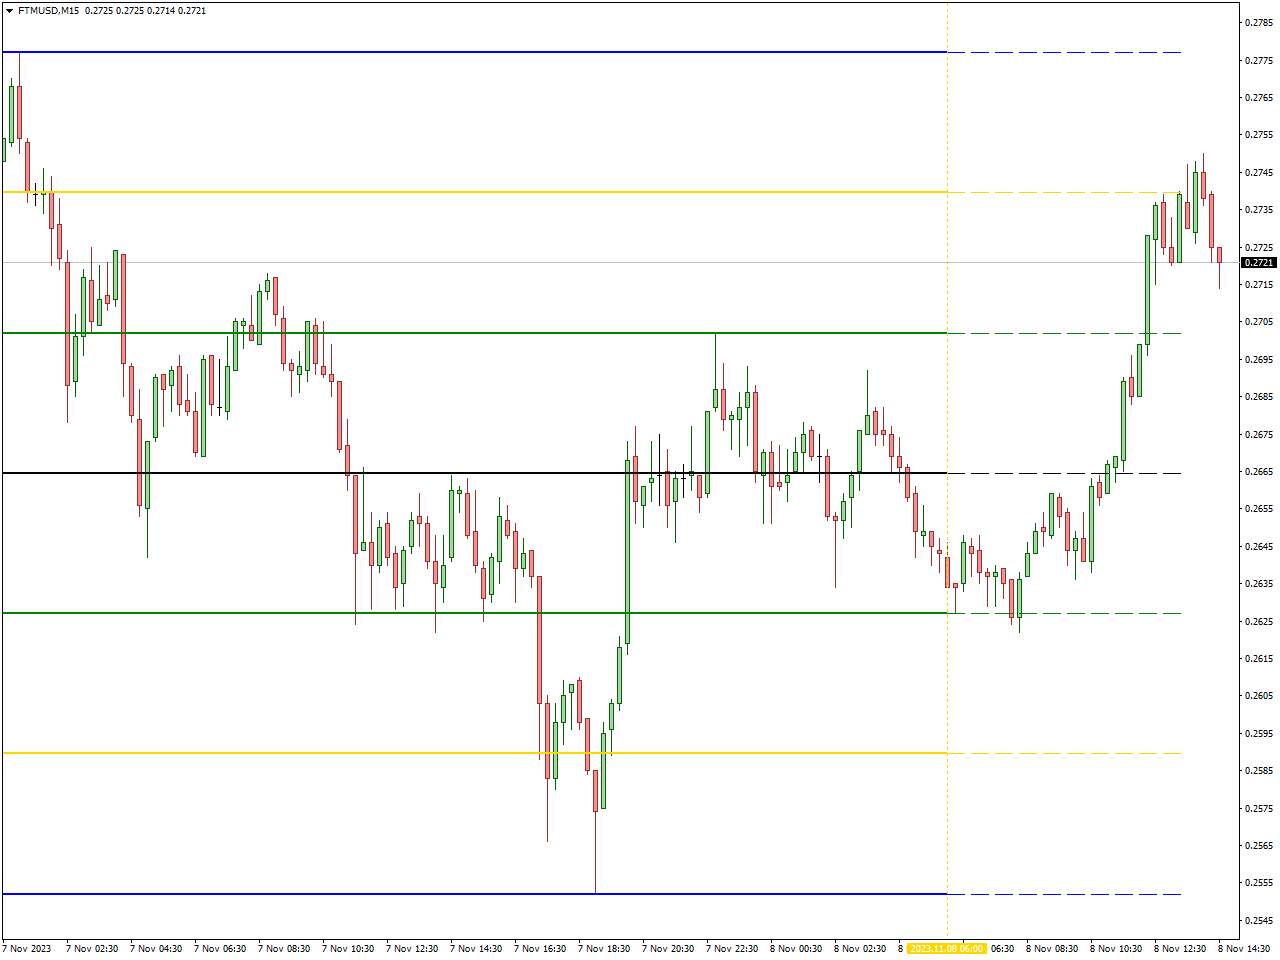
Round Levels Indicator
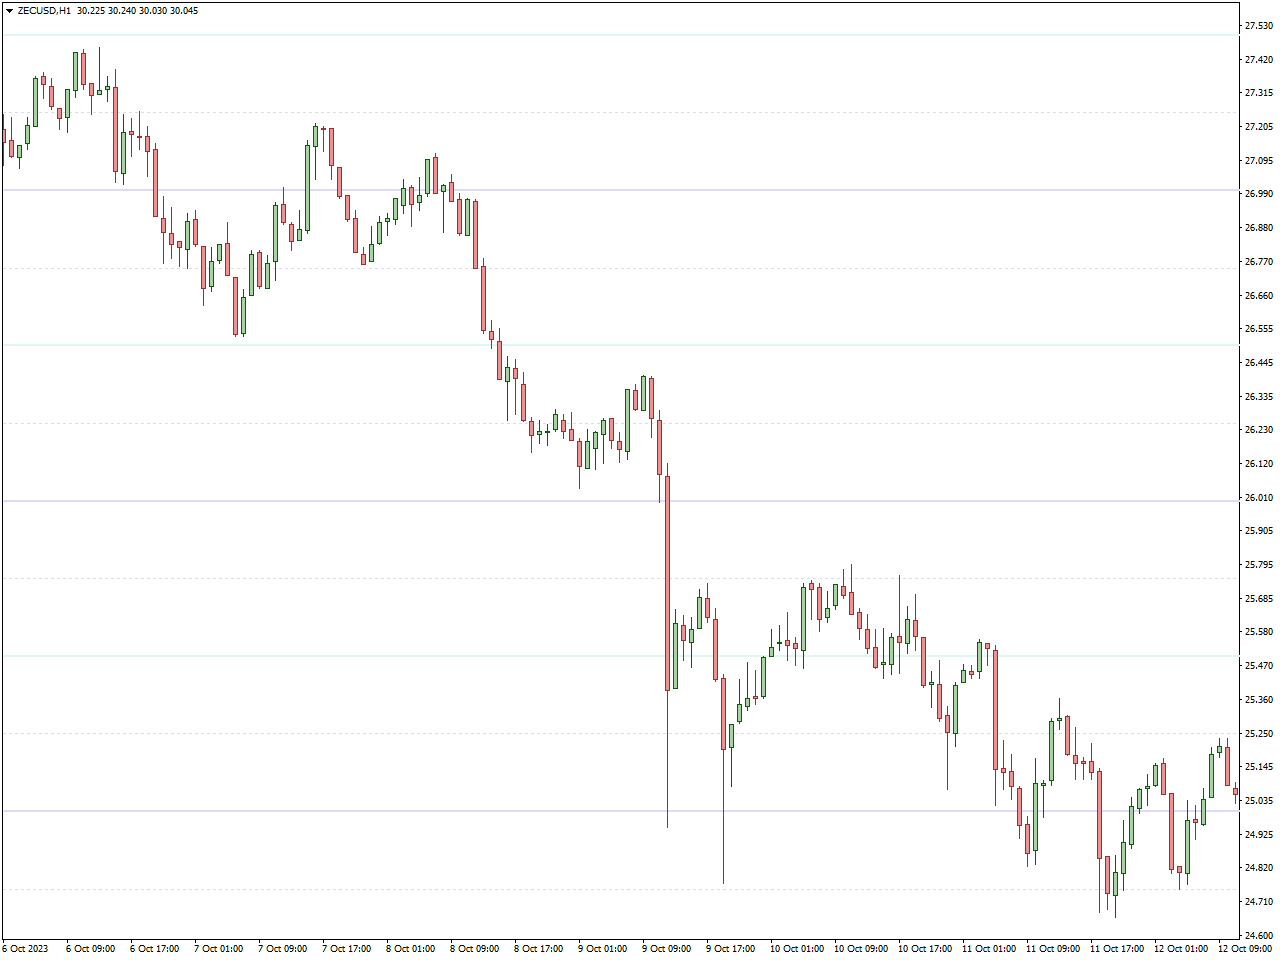
The Round Levels Indicator is a technical tool utilized by traders to pinpoint noteworthy price levels within a financial market. These levels are often linked to round numbers, which tend to serve as support or resistance zones. This indicator is specifically designed to highlight these pivotal round price levels on a price chart, providing traders with valuable insights for their analysis and decision-making.
Round levels refer to price levels that conclude with zeros or fifties, such as $100, $50, $1.50, and so forth. Traders attach significant psychological importance to these levels, as they can significantly influence market behavior. The Round Levels Indicator streamlines the process of recognizing and visualizing these levels on the chart, thereby simplifying the evaluation of their relevance and potential impact on price movements.
Traders can leverage the Round Levels Indicator to enhance their judgment regarding entry and exit points for their trades by taking into account the importance of these round price levels. Furthermore, these levels can be seamlessly integrated into broader trading strategies and analytical approaches, ultimately contributing to improved trading outcomes.
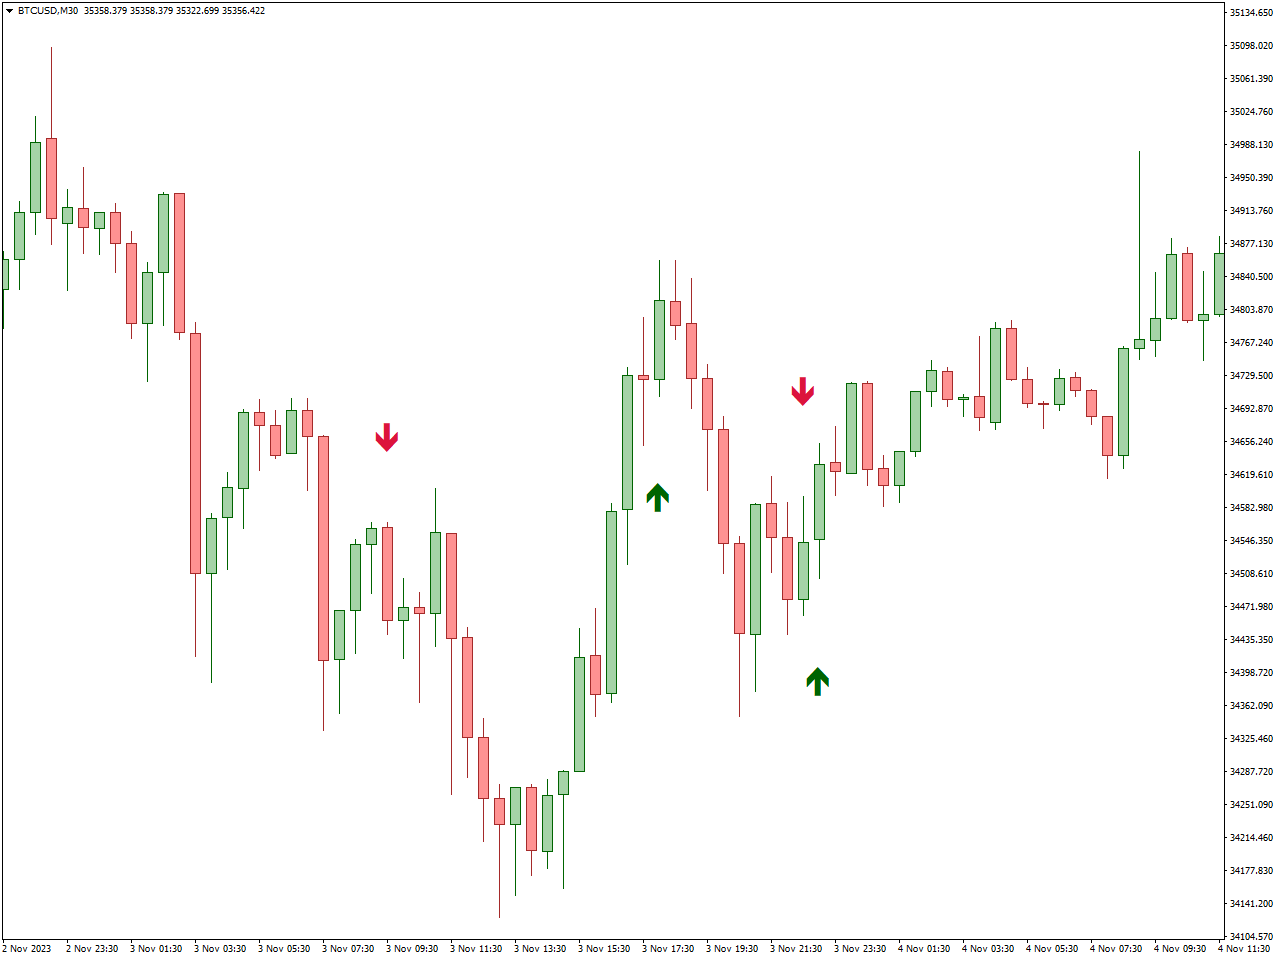
Dark Point Indicator
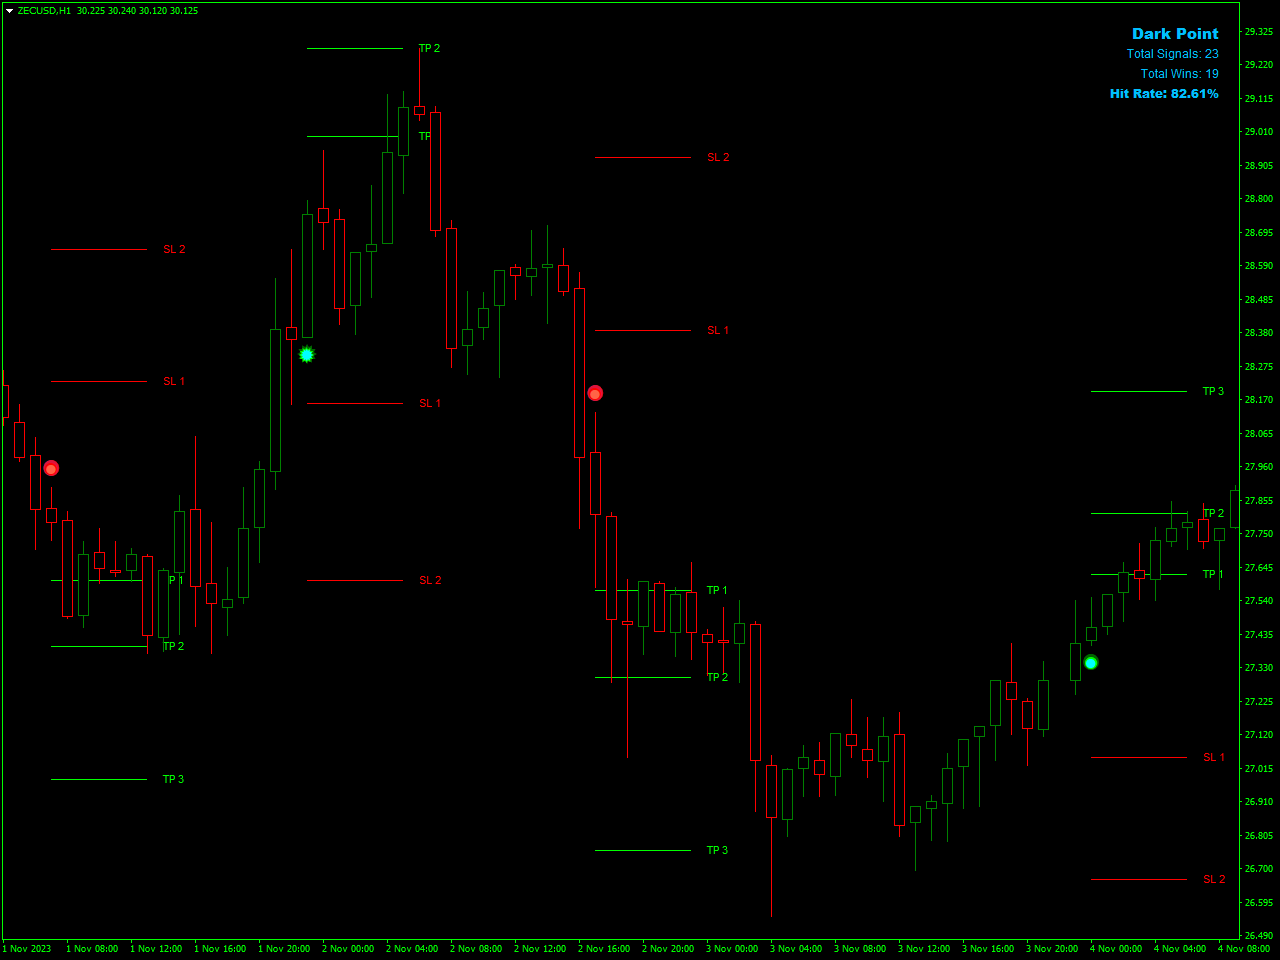
The Dark Point Indicator is a technical tool adopted by traders to detect possible reversal points in financial markets. Its primary purpose is to aid traders in recognizing critical reversal signals and pivotal junctures within price charts.
The Dark Point Indicator functions by scrutinizing price patterns and market data to generate signals. These signals are often presented visually on price charts, commonly in the form of arrows or similar markers, indicating potential buy or sell points.
Bollinger Bands Indicator
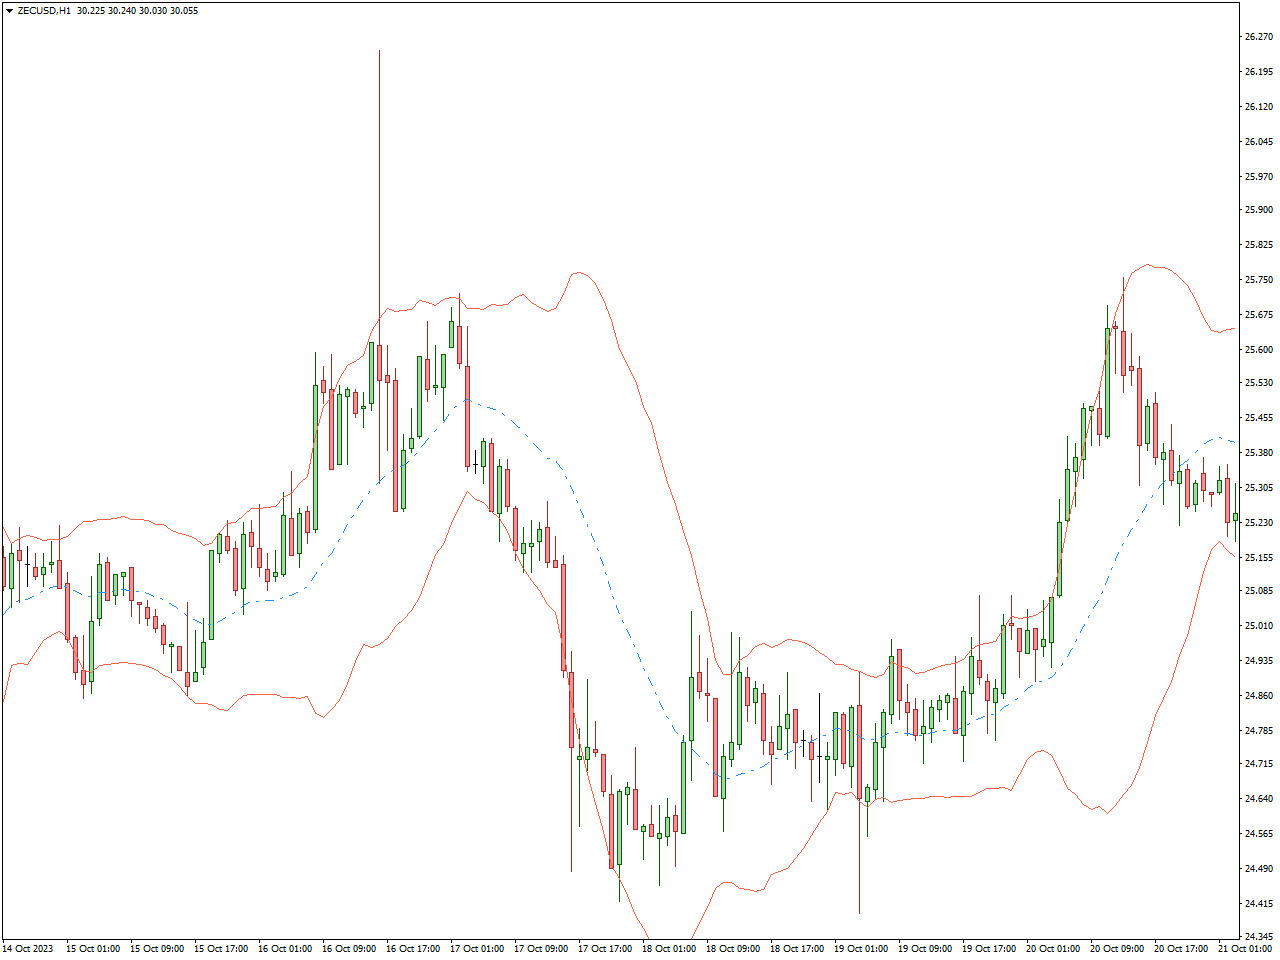
The Bollinger Bands Indicator is a widely embraced technical analysis tool across various financial markets, encompassing stocks, forex, and commodities. Its creator, John Bollinger, crafted this tool with the intention of equipping traders with valuable insights into price volatility, potential reversals, and prevailing market trends.
Bollinger Bands are commonly harnessed to pinpoint potential price reversals. Whenever prices come into contact with or surpass the upper band, it often serves as a signal for overbought conditions, hinting at a potential reversal to the downside. Conversely, when prices touch the lower band or dip below it, it tends to signify oversold conditions, indicating the potential for a reversal to the upside.
During instances when the bands undergo significant contraction, it’s referred to as a “Bollinger Squeeze.” This phenomenon suggests a phase of reduced volatility and is frequently followed by a noteworthy price breakout, although the direction of the breakout is not predetermined.
Support and Resistance Zone Indicator
The Support and Resistance Zone Indicator is a technical tool extensively utilized by traders to spot crucial levels on a price chart where disparities between buyers (support) and sellers (resistance) may be prevalent.
These zones demarcate price levels where changes in market sentiment can potentially take place, giving rise to reversals or substantial price movements. Traders often depend on these zones to guide their decisions regarding the timing of trade entries and exits.
Yet, utilizing the Support and Resistance Zone Indicator proficiently necessitates a comprehensive grasp of its inner workings, calculation techniques, and how it integrates into your overarching trading strategy.
Super Trend Indicator
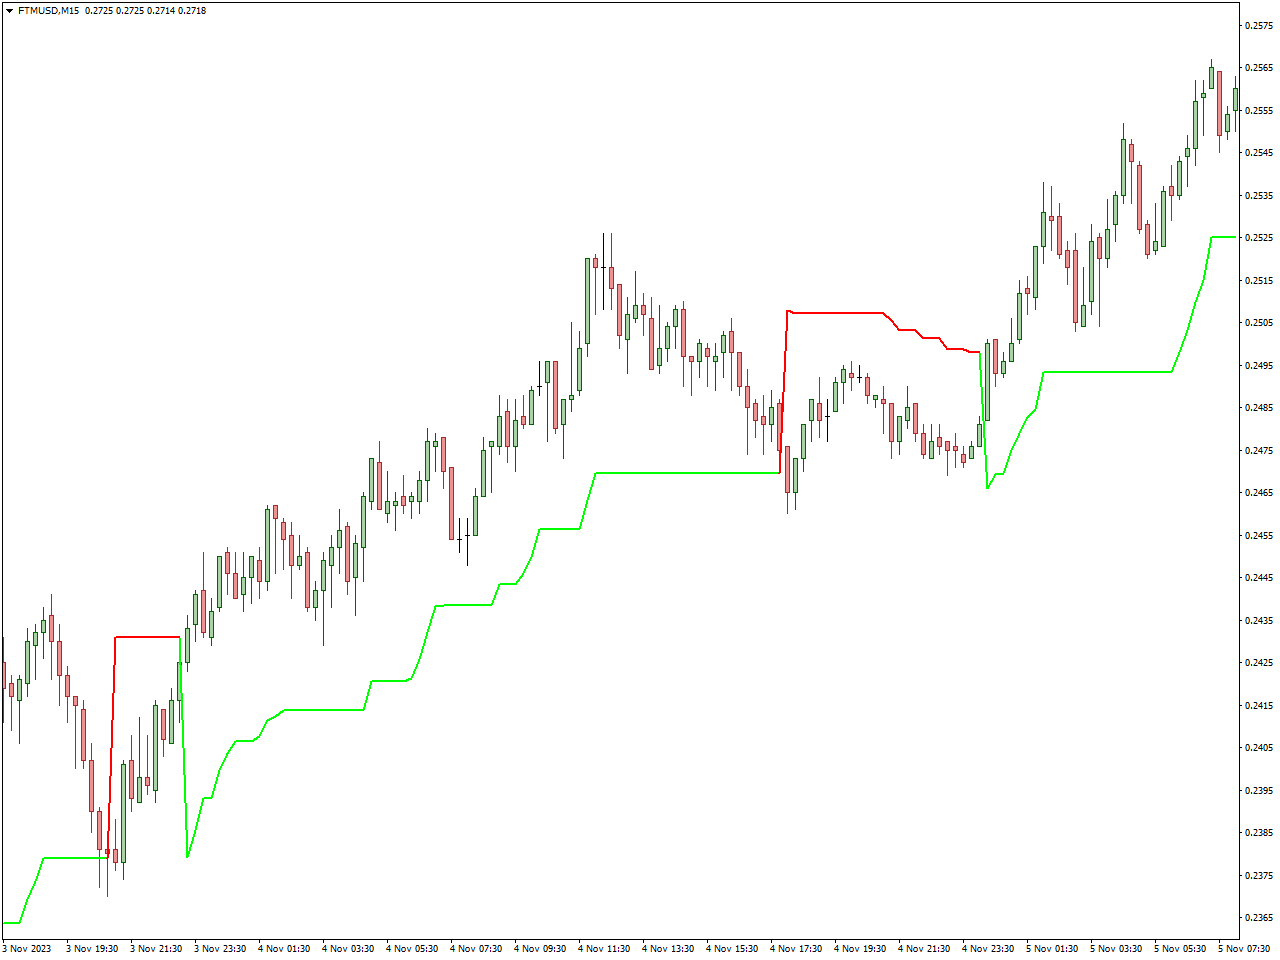
The Super Trend Indicator is a well-established technical analysis tool employed in various financial markets, such as stocks, forex, commodities, and cryptocurrencies. Its primary purpose is to assist traders in recognizing potential trends within a market and in making well-informed decisions regarding trade entry and exit.
This indicator generates visual signals on a price chart, often depicted as colored lines or dots. These signals provide traders with insights into the prevailing trend’s direction. When the Super Trend Indicator indicates an upward trend, it typically signifies a favorable moment for entering a long (buy) position. Conversely, when it identifies a downward trend, it may suggest an opportunity to enter a short (sell) position.
Traders find the Super Trend Indicator particularly valuable for implementing trend-following strategies and for identifying potential points for entering and exiting trades.
Wolfe Waves Indicator
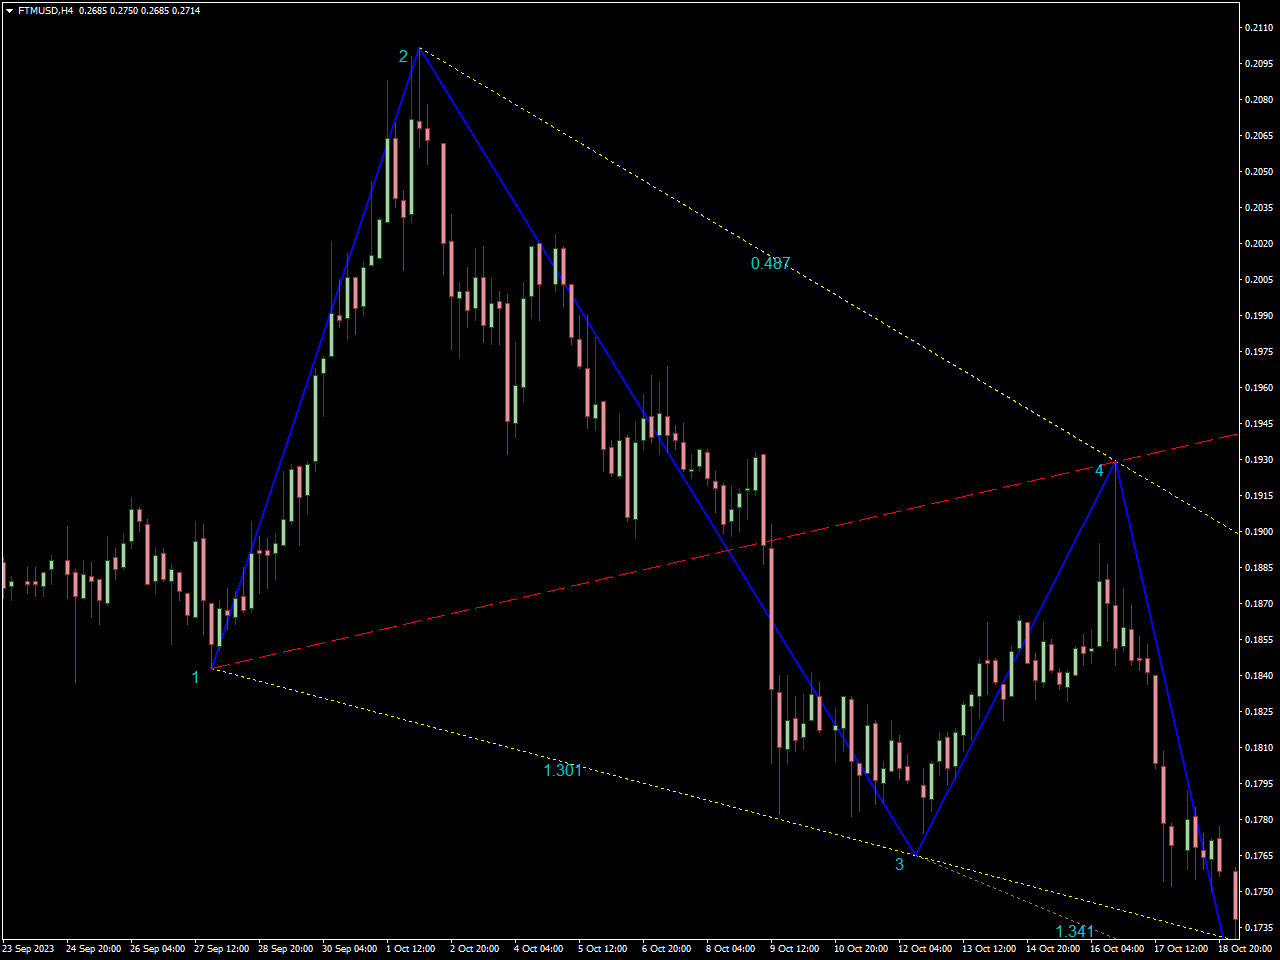
The Wolfe Waves Indicator is a technical tool frequently utilized by traders to identify prospective reversal patterns within financial markets. These distinctive patterns, referred to as Wolfe Waves, serve as predictive indicators for potential market turnarounds and forthcoming price developments.
Wolfe Waves are characterized by specific chart formations encompassing five waves. Within these formations, two smaller waves, denoted as 1 and 3, are encapsulated by two more extensive waves, designated as 2 and 4. These patterns can manifest as either bullish or bearish, signifying potential upward or downward price reversals.
The Wolfe Waves Indicator assists traders in recognizing and confirming these distinctive patterns on price charts, often through the presentation of graphical representations or visual cues. The identification of a Wolfe Wave pattern may furnish traders with valuable insights regarding potential entry and exit points for their trades. Nevertheless, it is essential for traders to comprehend the mechanics of Wolfe Waves and integrate this indicator thoughtfully into their comprehensive trading strategy for optimal effectiveness. Like any technical tool, its utility is maximized when employed in conjunction with other forms of analysis and prudent risk management practices.
MA Crossover Alerts Indicator
The MA Crossover Alerts Indicator is a popular tool frequently embraced by traders for its ability to pinpoint potential market trends and identify strategic entry and exit points in financial markets. This indicator is centered around the interaction of two moving averages, designed to generate alerts or signals at the precise juncture where these moving averages intersect.
Traders routinely harness the capabilities of the MA Crossover Alerts Indicator to pinpoint instances where a shorter-term moving average crosses above or below a longer-term moving average. When the shorter-term moving average surpasses the longer-term counterpart, it typically produces a “golden cross” or “buy” signal, indicative of a potential uptrend. Conversely, if the shorter-term moving average dips below the longer-term moving average, it typically initiates a “death cross” or “sell” signal, signaling the potential onset of a downtrend.
MTF.HighLow Indicator
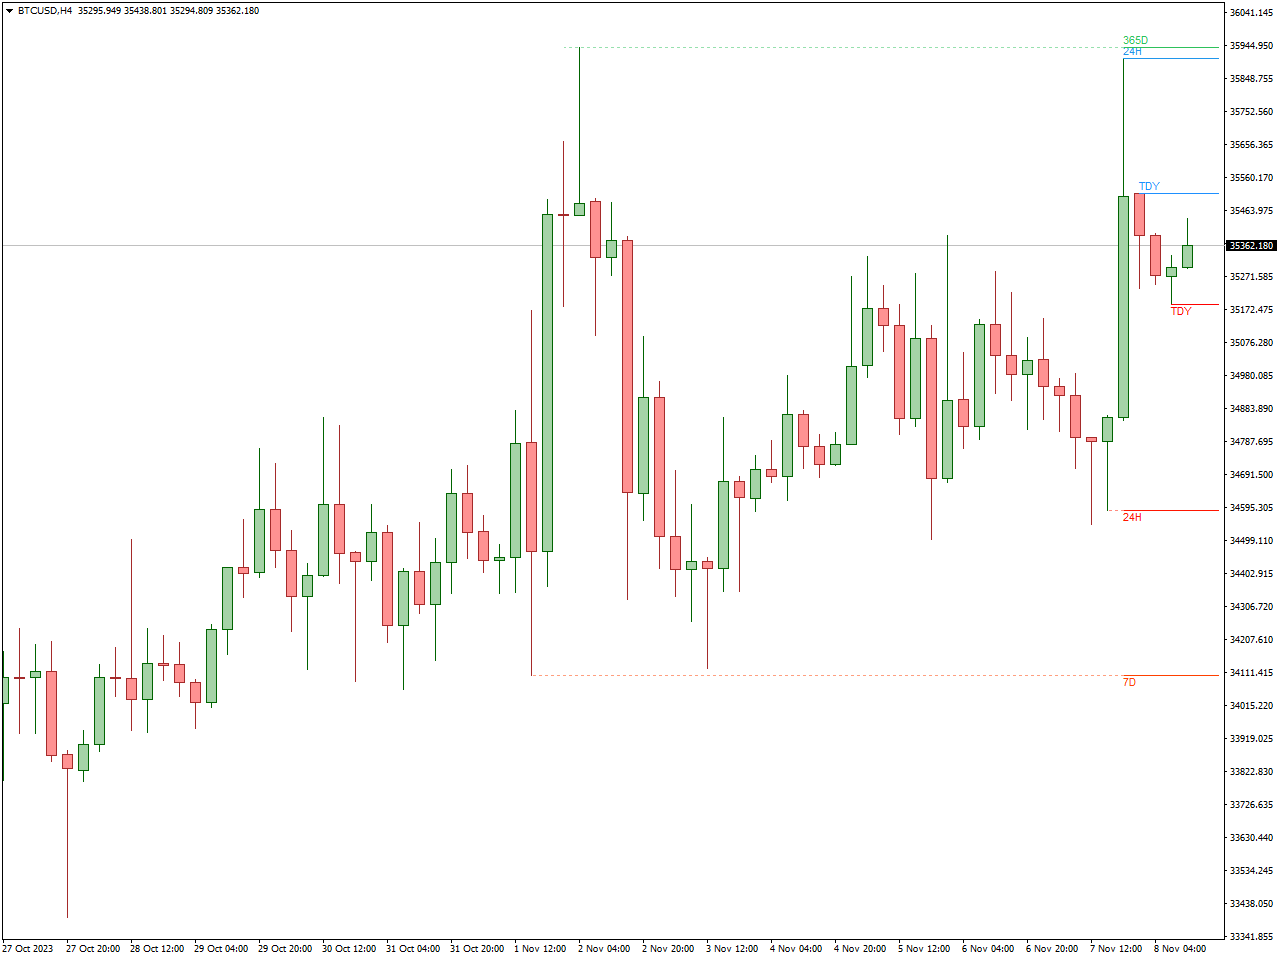
The MTF HighLow Indicator, short for the Multi-Timeframe HighLow Indicator, serves as a valuable technical analysis tool utilized by traders across diverse financial markets. This indicator plays a crucial role in assisting traders with the assessment of the highest and lowest price levels across multiple timeframes, thereby offering valuable insights into potential support and resistance levels and the overall dynamics of the market.
Through the analysis of high and low price points spanning various timeframes, traders can pinpoint essential price zones that have the potential to act as significant areas of support or resistance. Armed with this information, traders can make well-informed decisions regarding the timing of their trade entries and exits, as well as gain a deeper understanding of the prevailing price trends within the market. The MTF HighLow Indicator significantly enhances a trader’s capacity to evaluate the importance of various price levels and their relevance in the context of the current market conditions.
Spearman Correlation Indicator
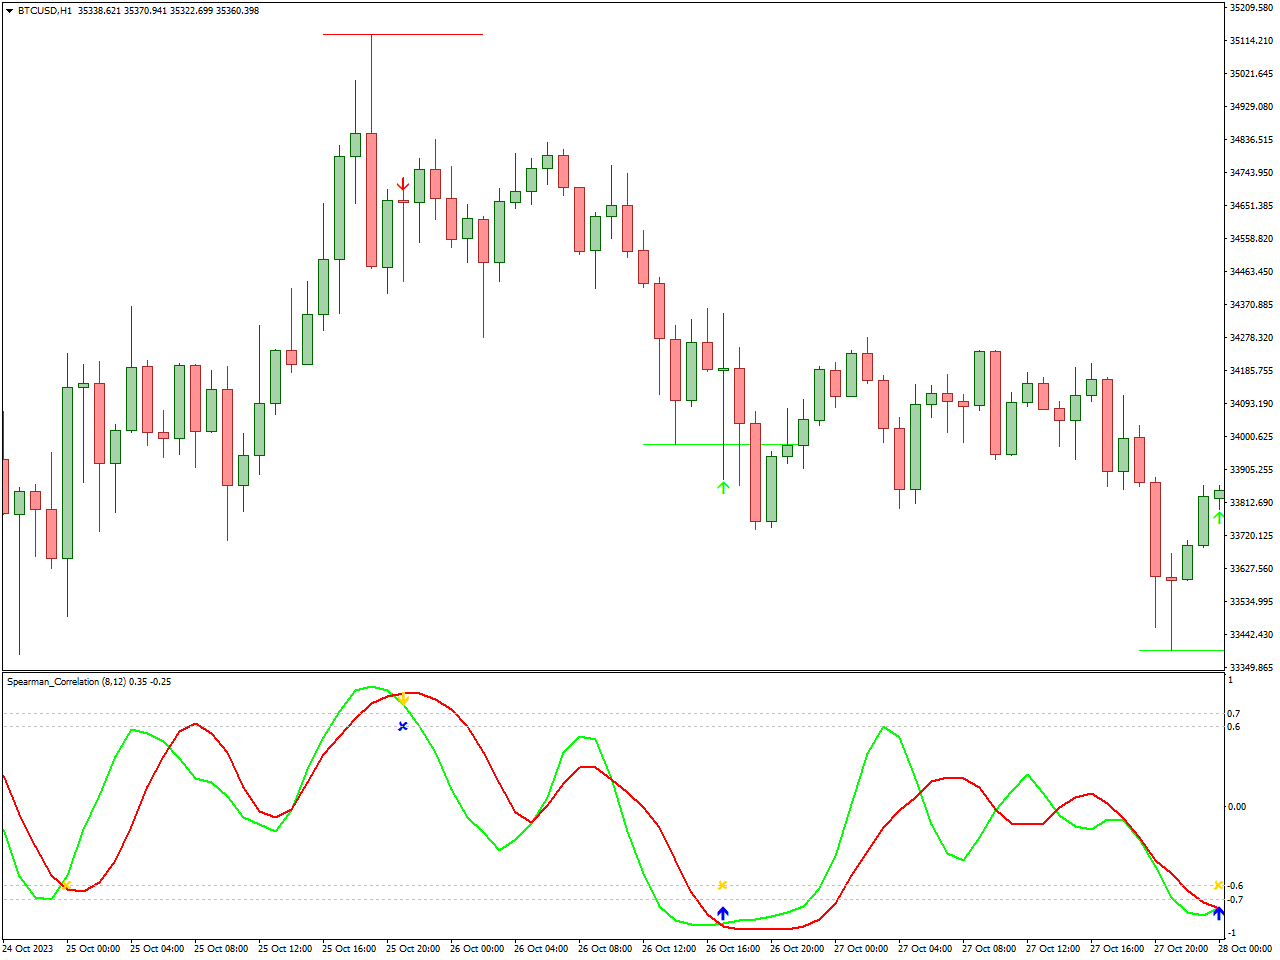
The Spearman Correlation Indicator is a statistical tool applied in financial markets, spanning across stocks, forex, and commodities. Its primary purpose is to gauge the strength and direction of the relationship between two or more sets of data. What sets this indicator apart is its capability to assess the level of correlation between price movements in distinct assets or variables, in a manner different from the Pearson correlation coefficient, which assesses linear relationships. The Spearman correlation delves into non-linear relationships, and its foundation lies in the ranking of data.
Once the data has undergone the ranking process, the Spearman correlation coefficient is calculated by analyzing the disparities between the rankings of corresponding data points in the two datasets. This coefficient quantifies the proximity of the data point rankings in both sets.
To ascertain the statistical significance of the Spearman correlation coefficient, traders and analysts frequently employ statistical tests. These tests aid in establishing whether the observed correlation is likely the result of chance or if it indicates a meaningful and noteworthy relationship.
TTM Scalper Indicator
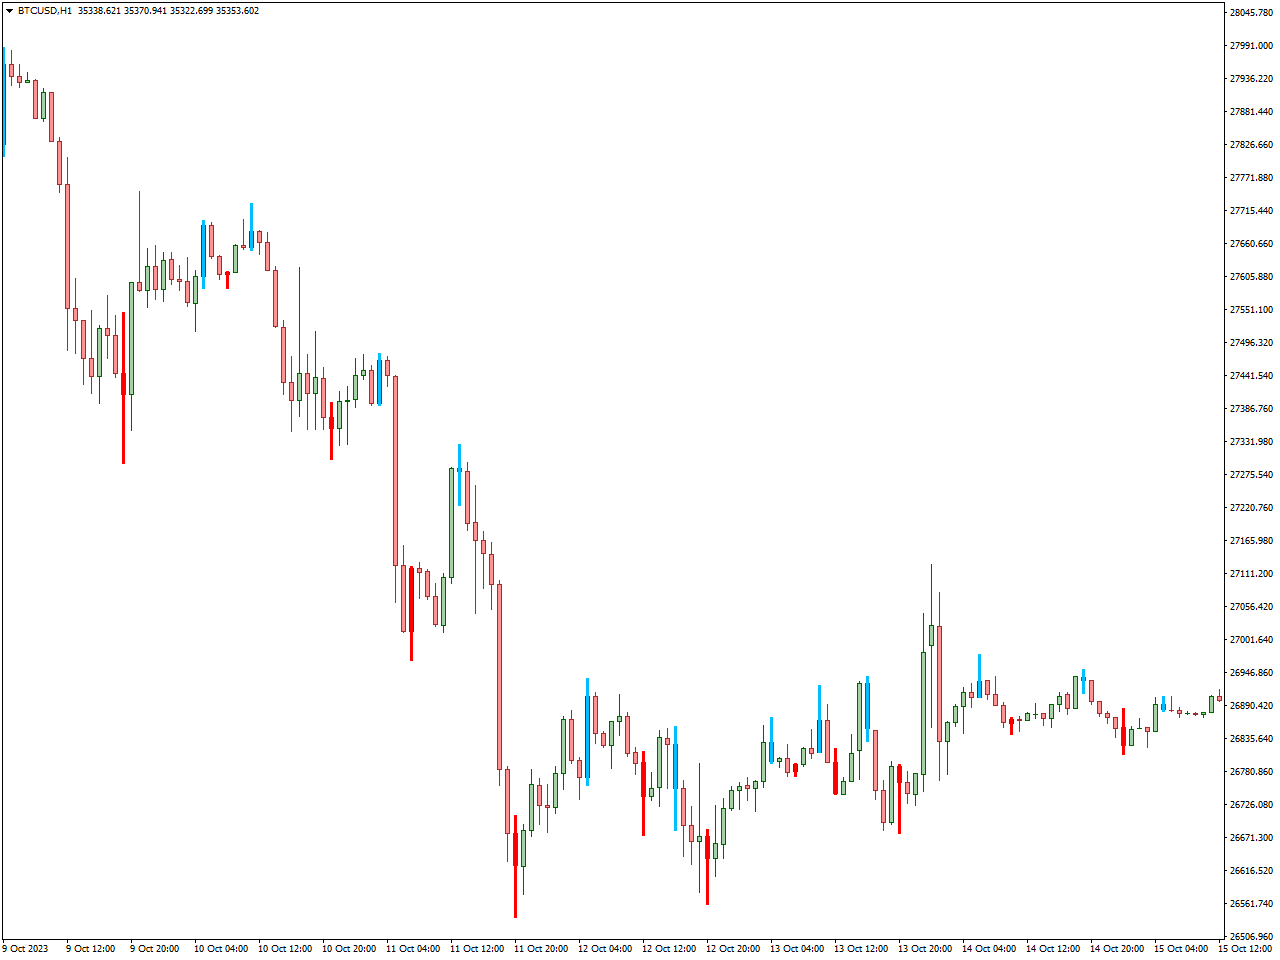
The TTM Scalper Indicator is a widely-acknowledged technical analysis tool, frequently embraced by traders, particularly those who are actively involved in day trading and scalping. Scalping is a trading approach that revolves around capturing swift, incremental profits arising from rapid price fluctuations within the market. The TTM Scalper Indicator is expertly crafted to assist traders in recognizing potential short-term trading opportunities and enables them to act swiftly.
At its core, this indicator is engineered to generate signals on a price chart. These signals are conventionally represented as colored bars or dots, which traders interpret as viable buy or sell prospects.
Scalping is rooted in the necessity for pinpoint entry and exit positions, a strategy designed to curtail risk and unlock the potential for substantial gains. In this context, the TTM Scalper Indicator plays an instrumental role by aiding traders in the identification of these critical points.
Conlusion
In the rapidly evolving world of cryptocurrency trading, achieving success relies on a trifecta of knowledge, strategic acumen, and the adept use of available tools. Throughout our comprehensive exploration of the 20 indispensable indicators, we’ve plumbed the depths of cryptocurrency trading, revealing the pivotal instruments that can serve as your guiding stars toward prosperity.
These indicators transcend being mere technical aids; they function as the very keys to unlock the boundless potential of cryptocurrency markets. They enable you to steer through the turbulent seas of volatility, make well-informed decisions, and opportunistically navigate even the most tempestuous of market conditions. As a trader, your capacity to proficiently interpret and harness these indicators will set you apart in the intricate landscape of digital asset trading.
Whether you are a seasoned trader honing your skills or an aspiring trader embarking on this journey, the 20 essential indicators are your navigational aids in this thrilling and dynamic arena. They empower you to decipher the market’s rhythms, identify trends, and recognize the opportune moments for buying or selling. With these indicators at your side, the prospect of elevating your trading endeavors to heights of success becomes tangible.
Nevertheless, it’s crucial to acknowledge that mastery in cryptocurrency trading is a continuous odyssey. Ongoing learning, relentless practice, and the ability to adapt to evolving market dynamics are paramount. As you apply these indicators and refine your strategic approach, you’ll come to realize that cryptocurrency trading is not merely exhilarating but also a potentially lucrative pursuit.
With the knowledge you’ve accrued from these indicators, coupled with assiduous research and the implementation of prudent risk management, take your next steps with unwavering confidence. The realm of cryptocurrency trading beckons, and with the right tools and insights at your disposal, the path to success lies well within your reach. Happy trading!