

Welcome to an in-depth exploration of the most potent indicators accessible on TradingView, your gateway to sophisticated technical analysis. In the ever-evolving landscape of financial markets, having the correct indicators within reach is pivotal for success. Whether you are a seasoned trader or taking your initial steps into the finance world, this guide will reveal the indispensable tools that can elevate your trading strategies to unprecedented levels.
We will navigate through a diverse range of indicators, each providing distinctive insights into market trends, volatility, and potential opportunities. From time-tested classics to cutting-edge newcomers, our journey will empower you to make judicious decisions and gain a competitive advantage in your trading pursuits.
Prepare to unleash the complete potential of your TradingView experience as we delve into the finest indicators that are set to redefine how you scrutinize and approach the markets.
TOP 13 TradingView Indicators
- Auto Fib Retracement Indicator
- Bollinger Bands Indicator
- Chaikin Oscillator Indicator
- Cumulative Volume Index Indicator
- Hull Moving Average Indicator
- Ichimoku Cloud Indicator
- Moving Average Divergence Covergence Indicator
- Parabolic SAR Indicator
- RSI Indicator
- Relative Volatility Index Indicator
- Stochastic RSI Indicator
- Triple EMA Indicator
- TRIX Indicator
Auto Fib Retracement Indicator
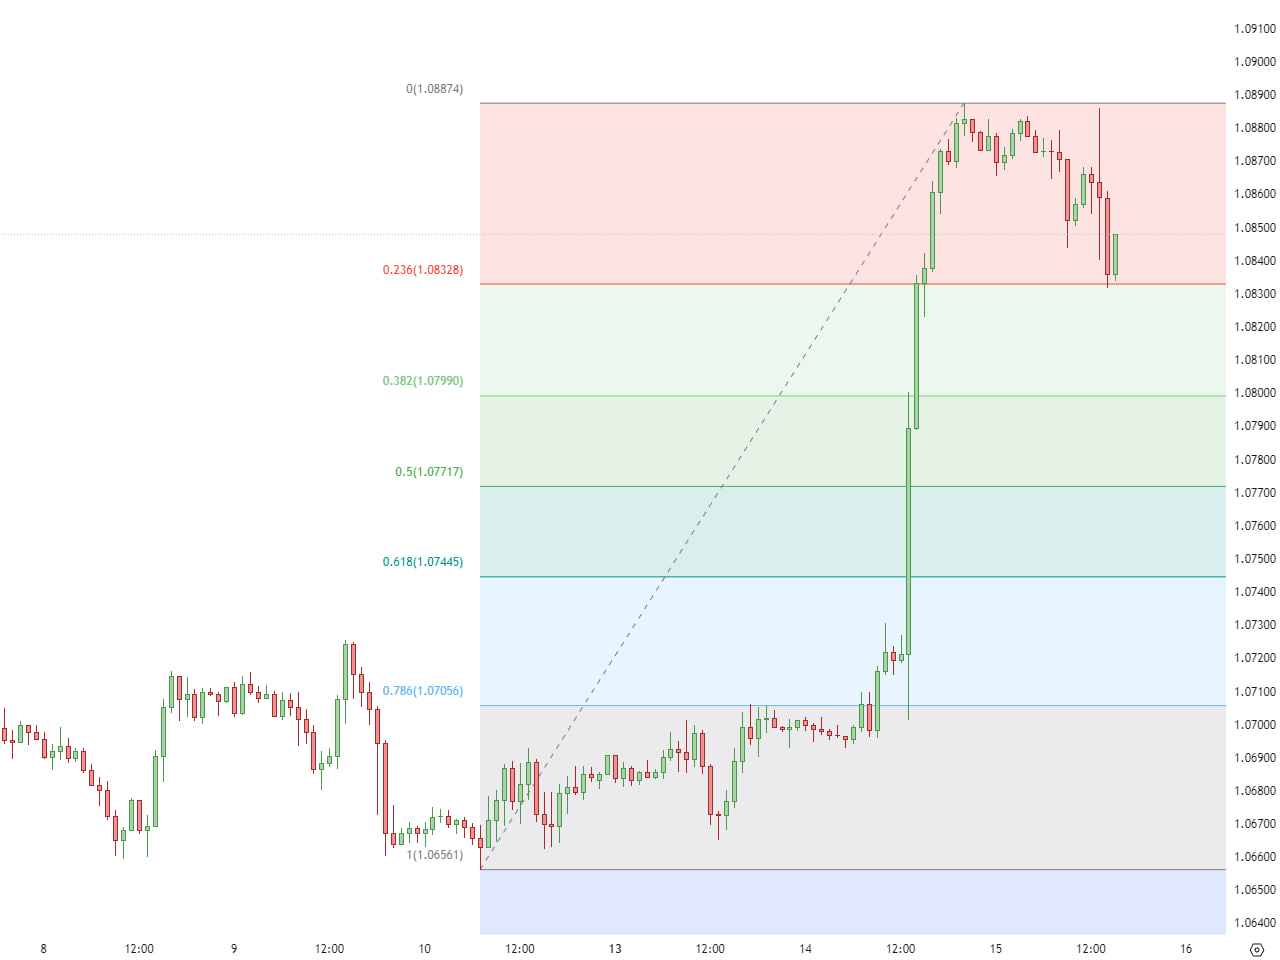
The Auto Fib Retracement Indicator stands as a widely embraced technical analysis tool among traders, serving to automate the identification of Fibonacci retracement levels on price charts. This indicator streamlines the application of Fibonacci retracement, a renowned technique for evaluating potential support and resistance levels in financial markets.
By automatically charting key Fibonacci retracement levels—such as 38.2%, 50%, and 61.8%—the Auto Fib Retracement Indicator assists traders in pinpointing potential reversal zones and evaluating the strength of price trends. This tool simplifies the intricate calculations inherent in manual Fibonacci analysis, empowering traders to make more streamlined and informed decisions regarding entry and exit points.
Deployed across diverse financial markets, spanning stocks, forex, and cryptocurrencies, the Auto Fib Retracement Indicator proves invaluable to traders aiming to incorporate Fibonacci analysis into their technical repertoire. Nonetheless, a thorough comprehension of the indicator’s parameters and its alignment with overarching trading strategies is imperative for optimal utilization.
Bollinger Bands Indicator
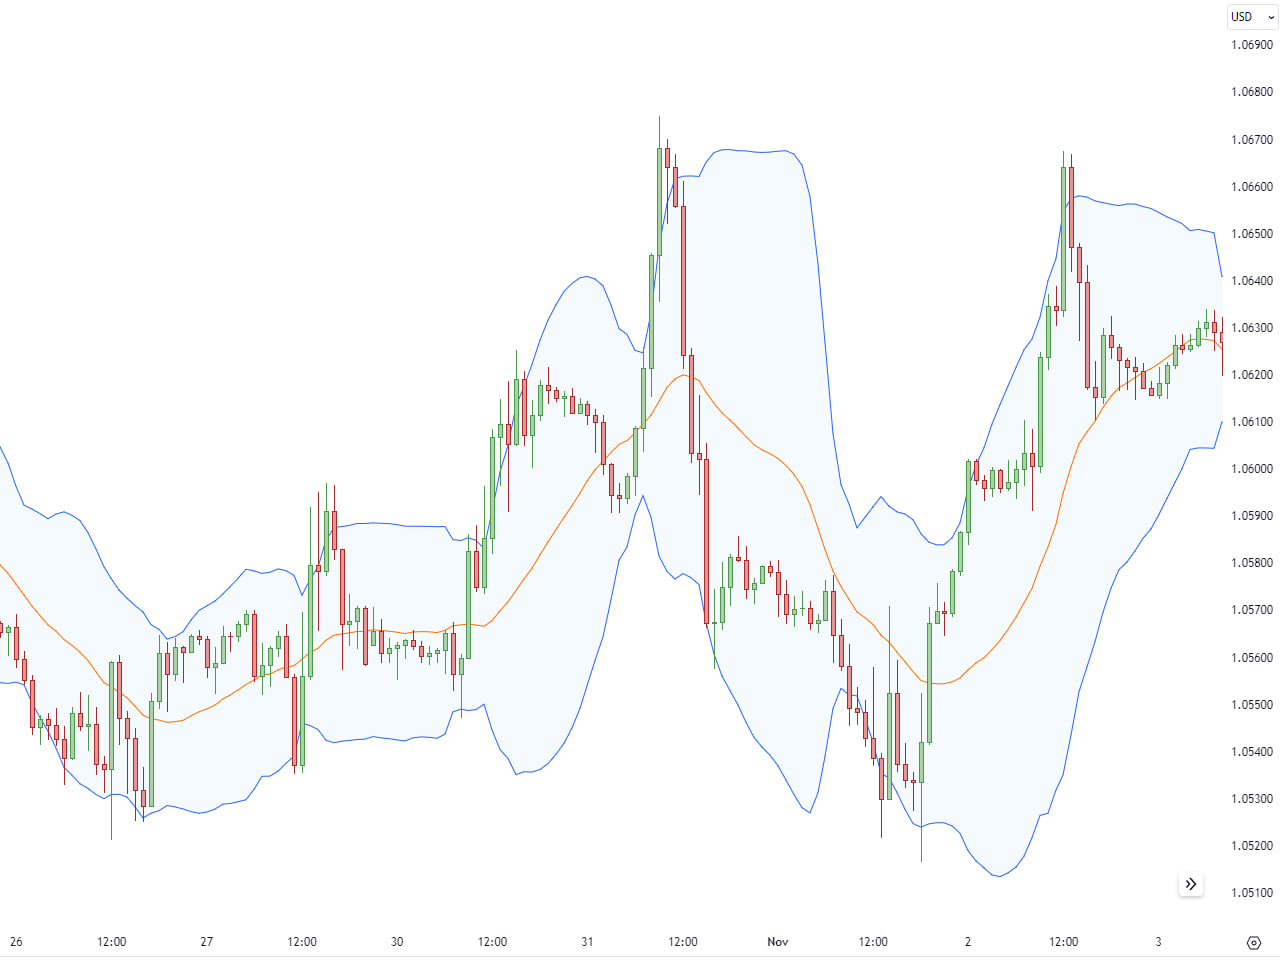
The Bollinger Bands Indicator, a fundamental component of technical analysis, is widely adopted by traders across diverse financial markets such as stocks, forex, and commodities. Created by John Bollinger, this instrument aims to furnish information on price volatility, potential reversals, and the prevailing trends in the market.
Bollinger Bands are instrumental in recognizing potential shifts in prices. When prices touch or exceed the upper band, it could indicate overbought conditions, suggesting a potential reversal to the downside. Conversely, if prices touch or drop below the lower band, it may imply oversold conditions, hinting at a potential reversal to the upside.
A noteworthy occurrence is the “Bollinger Squeeze,” which happens when the bands contract significantly, indicating a period of low volatility. This often precedes a substantial price breakout, although the direction of the breakout is not predetermined. The Bollinger Bands Indicator proves to be a versatile tool in a trader’s arsenal, providing valuable insights into market dynamics and aiding in decision-making regarding entry and exit points.
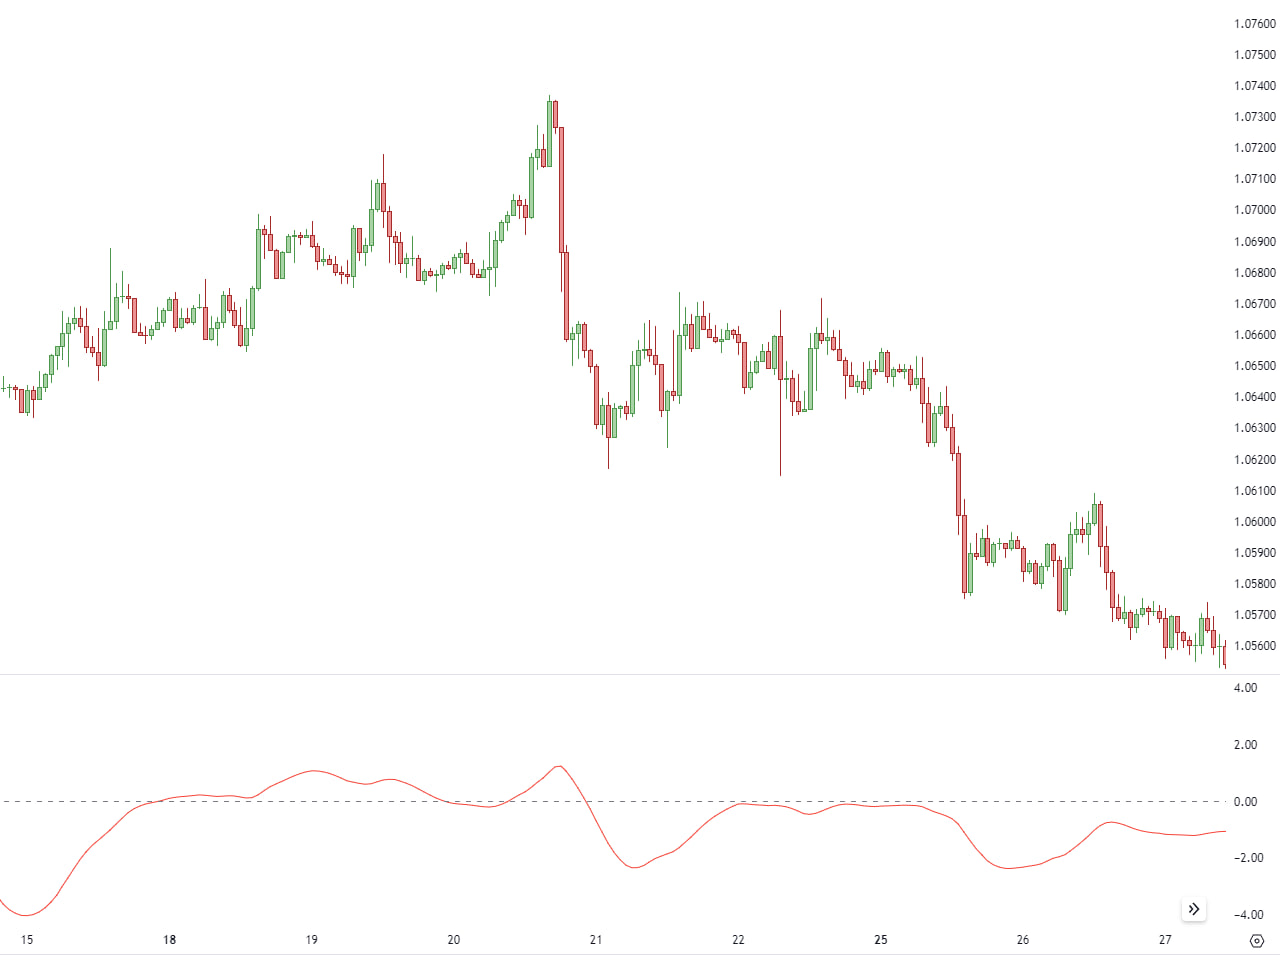
Chaikin Oscillator Indicator
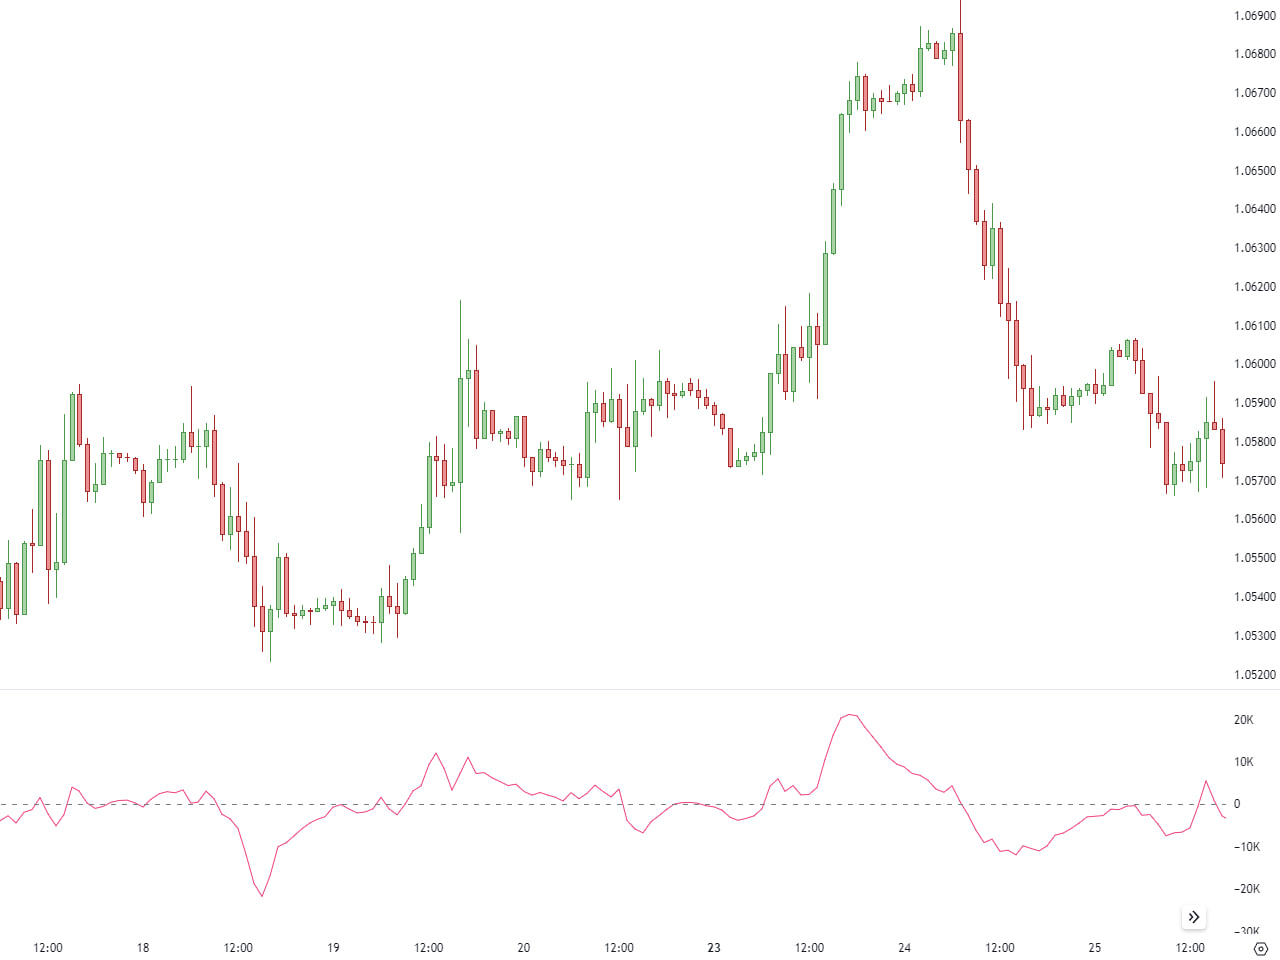
The Chaikin Oscillator serves as a technical analysis indicator employed by traders for gauging the momentum of a financial instrument. Developed by Marc Chaikin, this oscillator integrates both price and volume data to offer insights into the robustness of a trend and possible trend reversals.
Calculation-wise, the Chaikin Oscillator derives from the disparity between the 3-day exponential moving average (EMA) and the 10-day EMA of the Accumulation Distribution Line (ADL), an amalgamation of price and volume data. Subsequently, the resulting value of the Chaikin Oscillator is graphically represented.
Traders commonly utilize the Chaikin Oscillator to pinpoint potential buying and selling opportunities. An oscillator above the zero line suggests bullish momentum, indicating a rise in buying pressure. Conversely, an oscillator below the zero line signals bearish momentum, signifying an increase in selling pressure.
Furthermore, the Chaikin Oscillator proves useful in spotting potential trend reversals. Discrepancies between the oscillator and price movements may indicate a weakening current trend, potentially signaling an impending reversal.
To sum up, the Chaikin Oscillator stands as a valuable tool for traders, leveraging a combination of price and volume data to evaluate trend strength and anticipate shifts in market sentiment.
Cumulative Volume Index Indicator
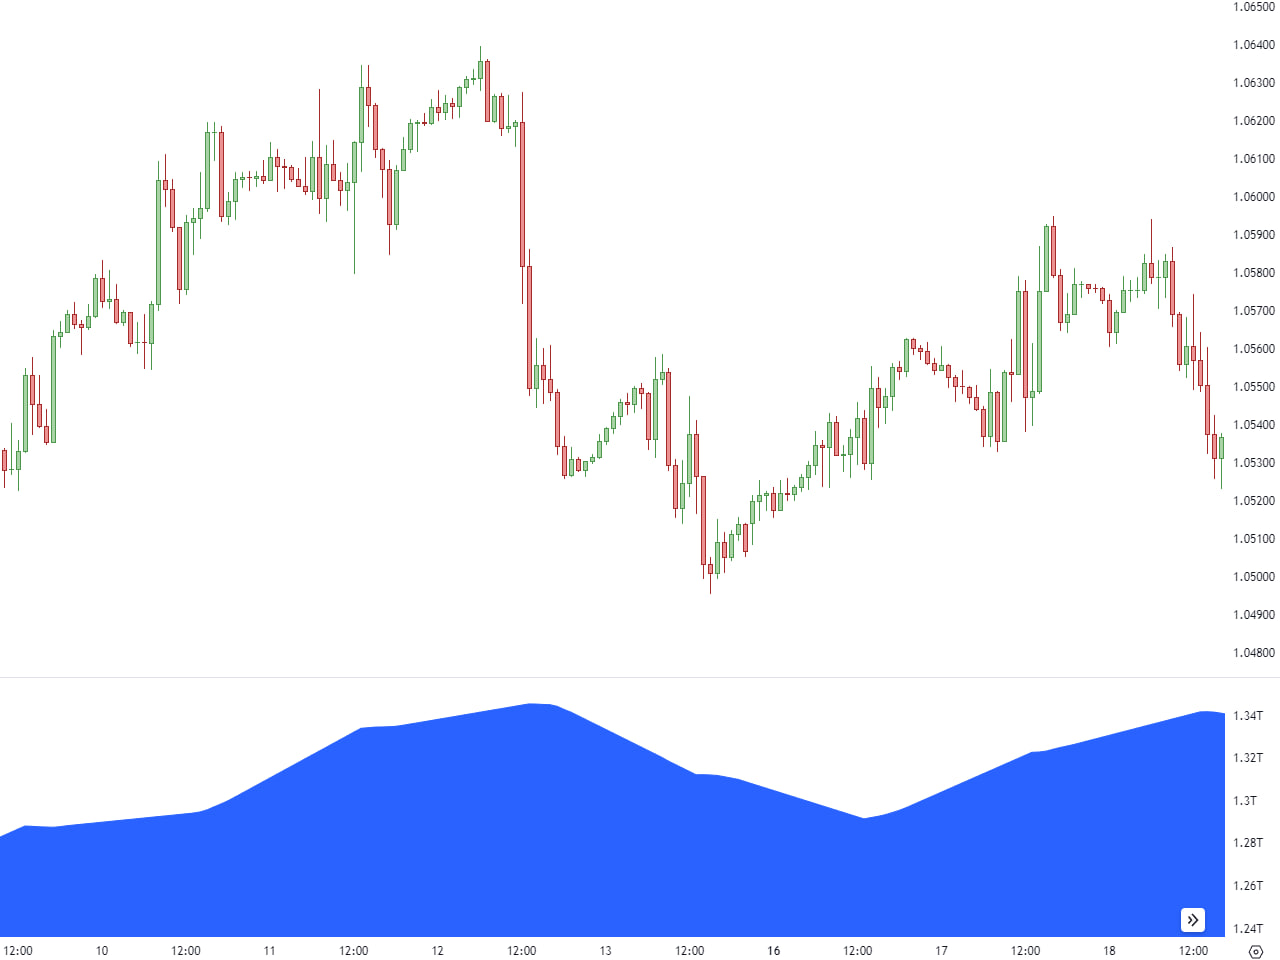
The Cumulative Volume Index (CVI) is a tool employed by traders in technical analysis to assess the strength of a price trend based on cumulative volume data, illustrating the inflow or outflow of money from a financial instrument.
To compute the Cumulative Volume Index, one adds the daily volume on up days (when the closing price is higher than the previous day) and subtracts the daily volume on down days (when the closing price is lower than the previous day). The resulting cumulative values are then graphically represented.
Traders frequently utilize the CVI to gauge the overall strength of a trend. A rising CVI is often seen as an indication of growing buying interest and a robust uptrend, whereas a declining CVI may suggest diminishing buying interest and a weakening trend. Conversely, a negative CVI may imply substantial selling interest and a downtrend.
Moreover, the Cumulative Volume Index can serve as a tool to spot potential trend reversals. Divergences between the CVI and price movements may indicate a weakening trend, potentially signaling an impending reversal.
In summary, the Cumulative Volume Index proves invaluable to traders, employing cumulative volume data to evaluate the strength of a price trend and to pinpoint potential shifts in market sentiment.
Hull Moving Average Indicator
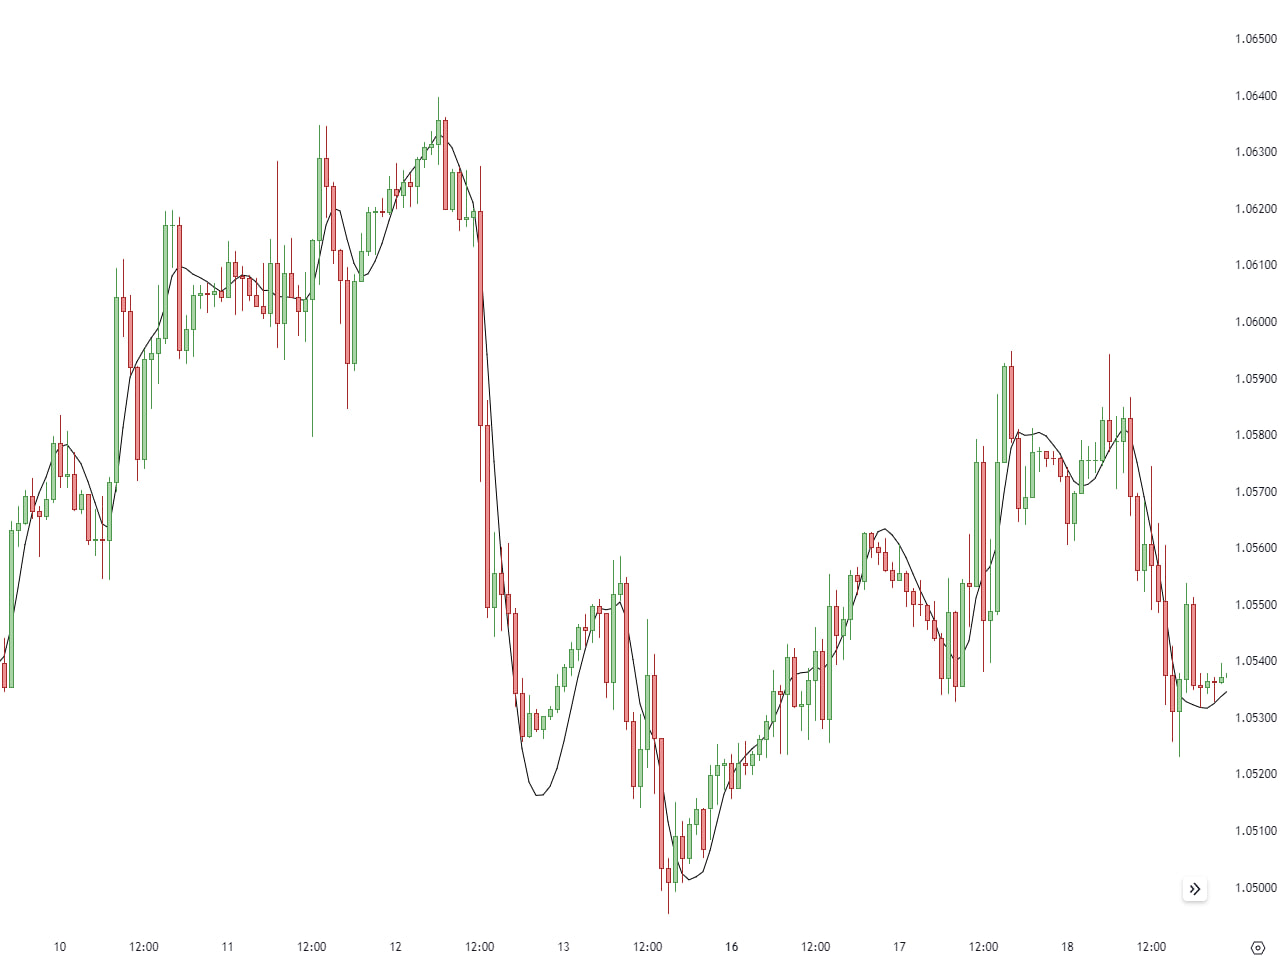
The Hull Moving Average (HMA) serves as a technical analysis tool adopted by traders to smooth price data and improve the accuracy of trend identification. Devised by Alan Hull, this moving average is specifically crafted to diminish lag and heighten responsiveness to fluctuations in prices.
The calculation of the Hull Moving Average entails a weighted sum of three distinct weighted moving averages (WMAs). The length of each WMA is adjusted to accommodate market volatility. This distinctive formula aims to present a more refined and precise depiction of the underlying price trend.
Traders frequently utilize the Hull Moving Average to ascertain the trend direction and detect potential reversals. The HMA exhibits prompt responsiveness to shifts in price direction while mitigating the impact of noise and false signals often associated with conventional moving averages.
Moreover, the Hull Moving Average can be applied in crossover strategies. A price crossing above the HMA may signify a bullish trend, whereas a crossover below the HMA could indicate a bearish trend.
In conclusion, the Hull Moving Average distinguishes itself as a valuable tool for traders, providing a more agile and less delayed indicator for evaluating trends and identifying potential reversal points in financial markets.
Ichimoku Cloud Indicator
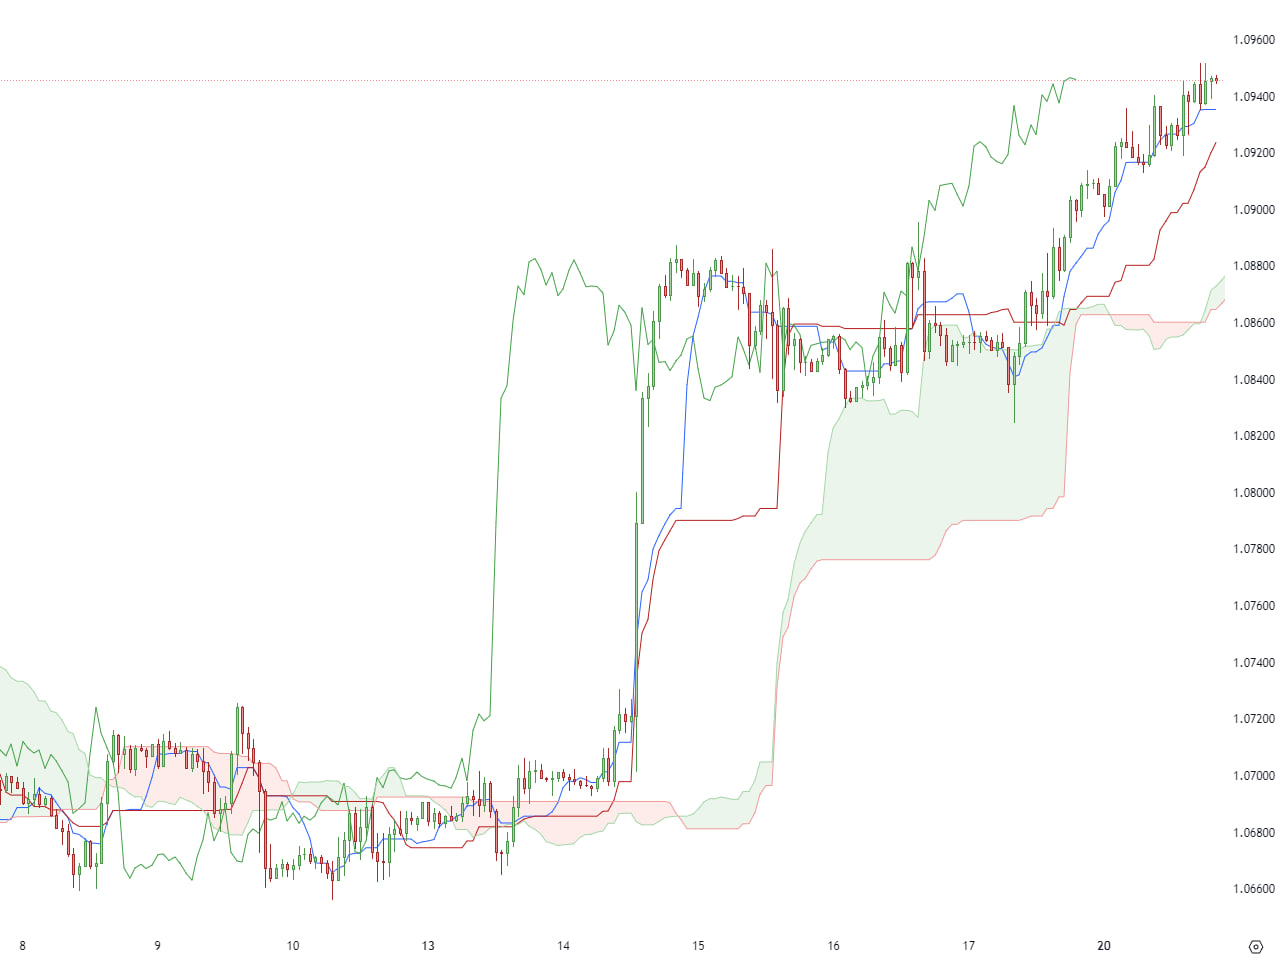
The Ichimoku Cloud, also referred to as Ichimoku Kinko Hyo, is an extensive technical analysis indicator that originated in Japan. Conceived by Goichi Hosoda, it presents a multifaceted outlook on an asset’s price action, furnishing insights into trend direction, support and resistance levels, and potential points for entering and exiting trades.
Comprising several components, the Ichimoku Cloud includes:
- Kumo (Cloud): Positioned at the core and serving as the most distinctive element, the Kumo consists of two lines, Senkou Span A and Senkou Span B, creating a shaded area between them. The cloud signifies potential support and resistance levels. A price above the cloud suggests a bullish trend, while being below indicates a bearish trend.
- Tenkan Sen (Conversion Line) and Kijun Sen (Base Line): These lines, computed with specific time parameters, offer insights into short-term and long-term price averages. Crossovers between these lines can signal potential changes in the trend.
- Chikou Span (Lagging Span): Representing the current closing price shifted backward in time, this line aids in gauging the strength of the prevailing trend and identifying potential support or resistance levels.
Traders frequently employ the Ichimoku Cloud to assess overall market sentiment, discern trend directions, and identify potential entry and exit points. The alignment of the various components in a specific manner often yields more robust signals.
In conclusion, the Ichimoku Cloud stands as a versatile and comprehensive technical analysis tool, transcending basic trend identification and providing traders with a holistic perspective on price dynamics and potential market conditions.
Moving Average Divergence Covergence Indicator
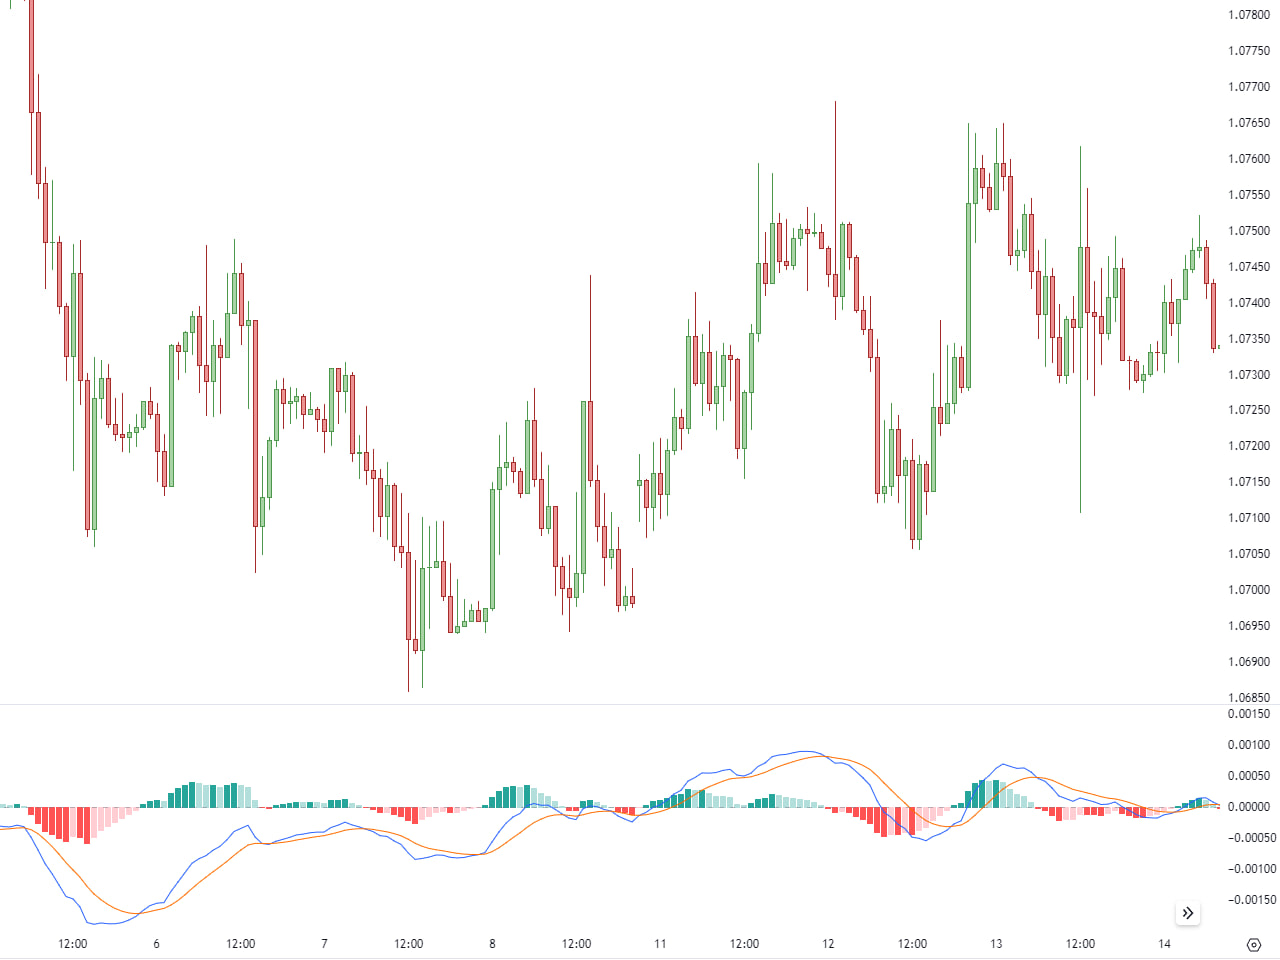
The Moving Average Divergence Convergence (MACD) indicator stands as a widely embraced technical analysis tool, aiding traders in recognizing potential shifts in trend direction, changes in momentum, and generating buy/sell signals within financial markets. Originated by Gerald Appel, the MACD’s computation involves deducting the 26-day Exponential Moving Average (EMA) from the 12-day EMA.
The MACD comprises three key components:
- MACD Line (12-day EMA – 26-day EMA): This line illustrates the variance between the 12-day and 26-day EMAs and serves as the primary identifier of momentum changes.
- Signal Line (9-day EMA of MACD Line): The Signal Line is a 9-day EMA derived from the MACD Line. It is utilized to generate trading signals. Crosses of the MACD Line above the Signal Line may suggest a bullish signal, while crosses below may indicate a bearish signal.
- Histogram: Representing the difference between the MACD Line and the Signal Line, the Histogram offers a visual depiction of trend strength and direction.
Traders commonly leverage the MACD to pinpoint potential buy and sell signals. A crossover of the MACD Line above the Signal Line often signifies a potential buying opportunity, while a crossover below may suggest a potential selling opportunity.
Furthermore, traders frequently utilize MACD Divergence, where the MACD Line diverges from the price action, as a tool for identifying potential reversals in the trend.
In summary, the MACD is a versatile and extensively employed indicator that furnishes valuable insights into market momentum, trend vigor, and possible trading prospects.
Parabolic SAR Indicator
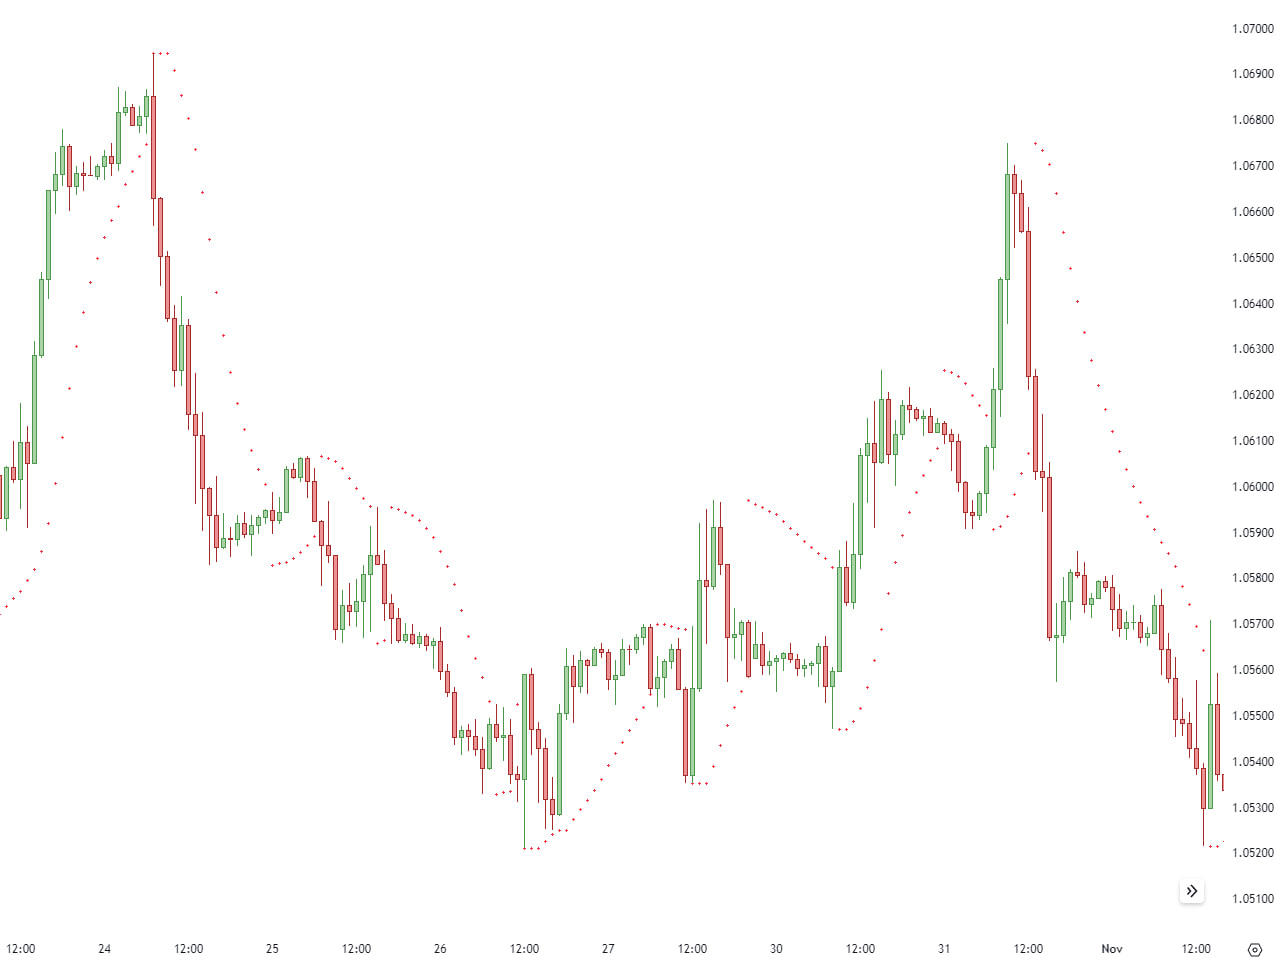
The Parabolic Stop and Reverse (SAR) indicator serves as a technical analysis tool crafted to detect potential shifts in trends within financial markets. Developed by Welles Wilder, this indicator assists traders in establishing trailing stop-loss levels that adapt as a trend unfolds.
Represented as dots above or below the price chart, the Parabolic SAR indicates trend direction. When the dots are situated below the price, they signify an uptrend, and conversely, when positioned above the price, they imply a downtrend.
As the trend advances, the acceleration factor rises, prompting the SAR to move closer to the price. A crossing of the price over the SAR often signals a potential reversal.
Traders employ the Parabolic SAR to effectively manage their positions, implementing stop-loss orders based on the indicator’s values. Its utility is particularly evident in trending markets, where it aids in capturing and safeguarding profits during prolonged price movements.
RSI Indicator
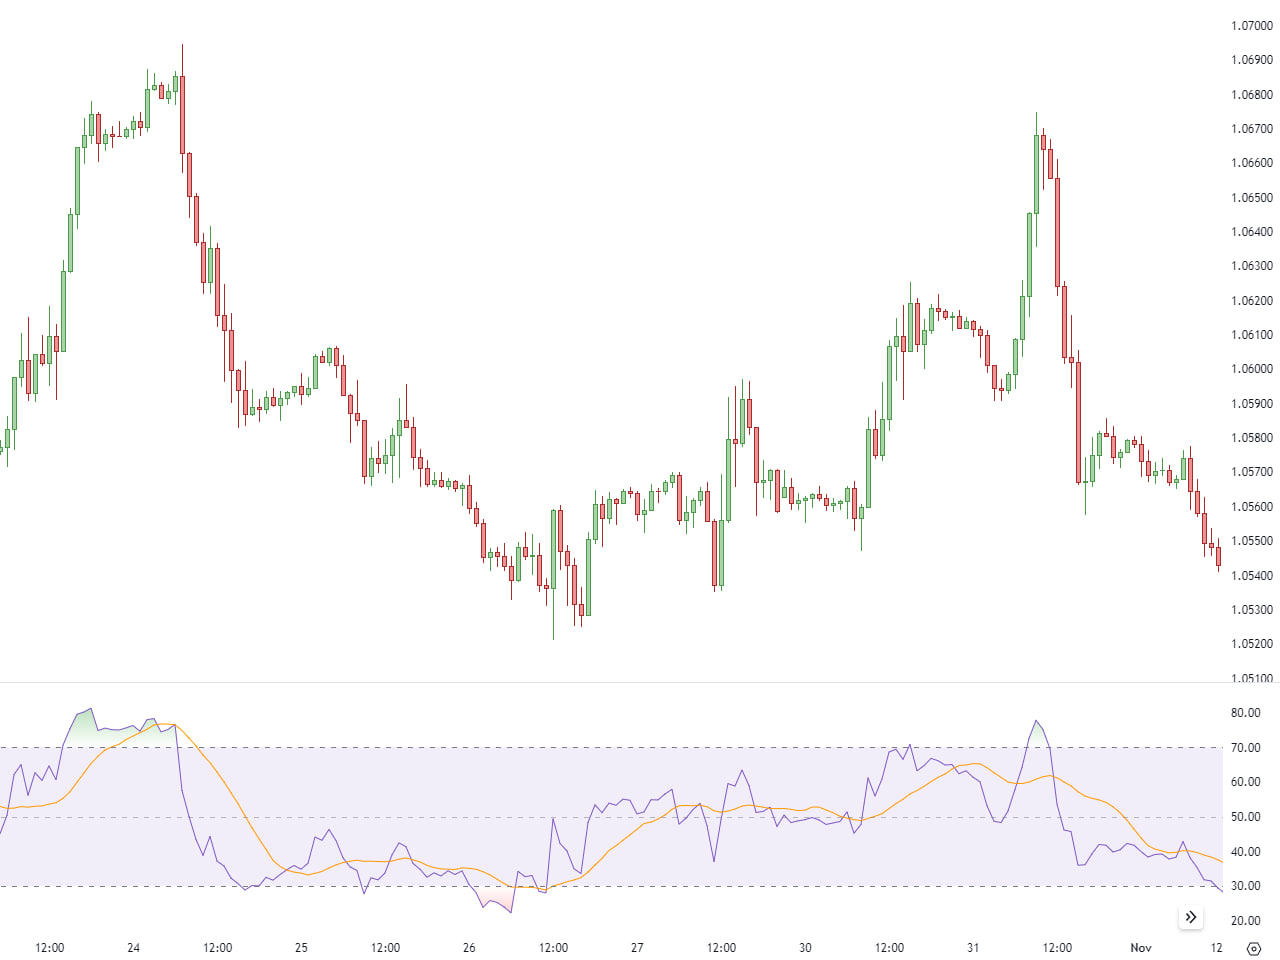
The Relative Strength Index (RSI) stands as a widely embraced technical analysis indicator employed by traders to evaluate the strength and momentum of a price trend. Conceived by J. Welles Wilder, the RSI is frequently utilized to pinpoint overbought or oversold conditions in a market.
Represented on a scale from 0 to 100, the RSI provides a gauge of market conditions. Traditionally, an RSI reading exceeding 70 is interpreted as overbought, suggesting a potential correction or a reversal to the downside. Conversely, an RSI below 30 is seen as oversold, indicating the possibility of a price rebound or reversal to the upside.
Traders commonly utilize the RSI to confirm the robustness of a trend, spot potential reversals, and generate signals for buying or selling. Divergences observed between the RSI and price movements can also serve as indicators of potential shifts in trend direction.
Relative Volatility Index Indicator
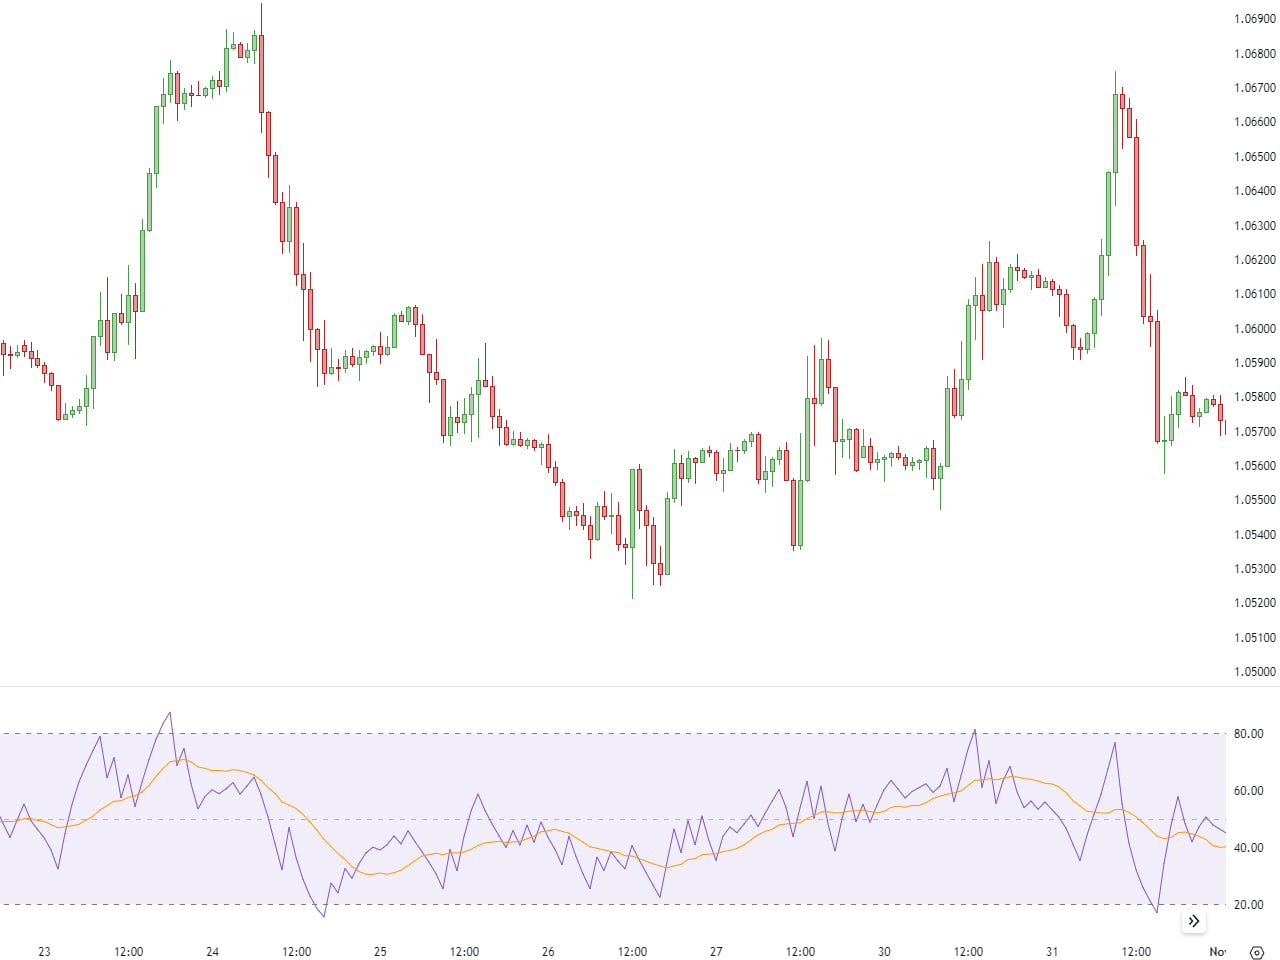
The Relative Volatility Index (RVI) is essentially the Relative Strength Index (RSI), but with a notable distinction: it is computed using the standard deviation over the past several bars in lieu of price change. This variance allows the RVI to serve as a confirming indicator, as it employs a measurement other than price to interpret market strength.
Operating on a scale from 0 to 100, the RVI assesses the direction of volatility. Readings surpassing 50 signify a prevalence of upside volatility, while readings below 50 indicate a predominance of downside volatility.
For traders seeking to enhance the precision of their trading signals, the RVI proves beneficial as a confirming indicator alongside other tools. Its foundation in the standard deviation of price changes renders it particularly valuable for evaluating market volatility.
It’s crucial to differentiate the RVI from the Relative Strength Index (RSI), despite their shared characteristics. While the RSI gauges the magnitude of price changes, the RVI concentrates on the standard deviation of price changes, making it a more suitable instrument for assessing market volatility.
Stochastic RSI Indicator
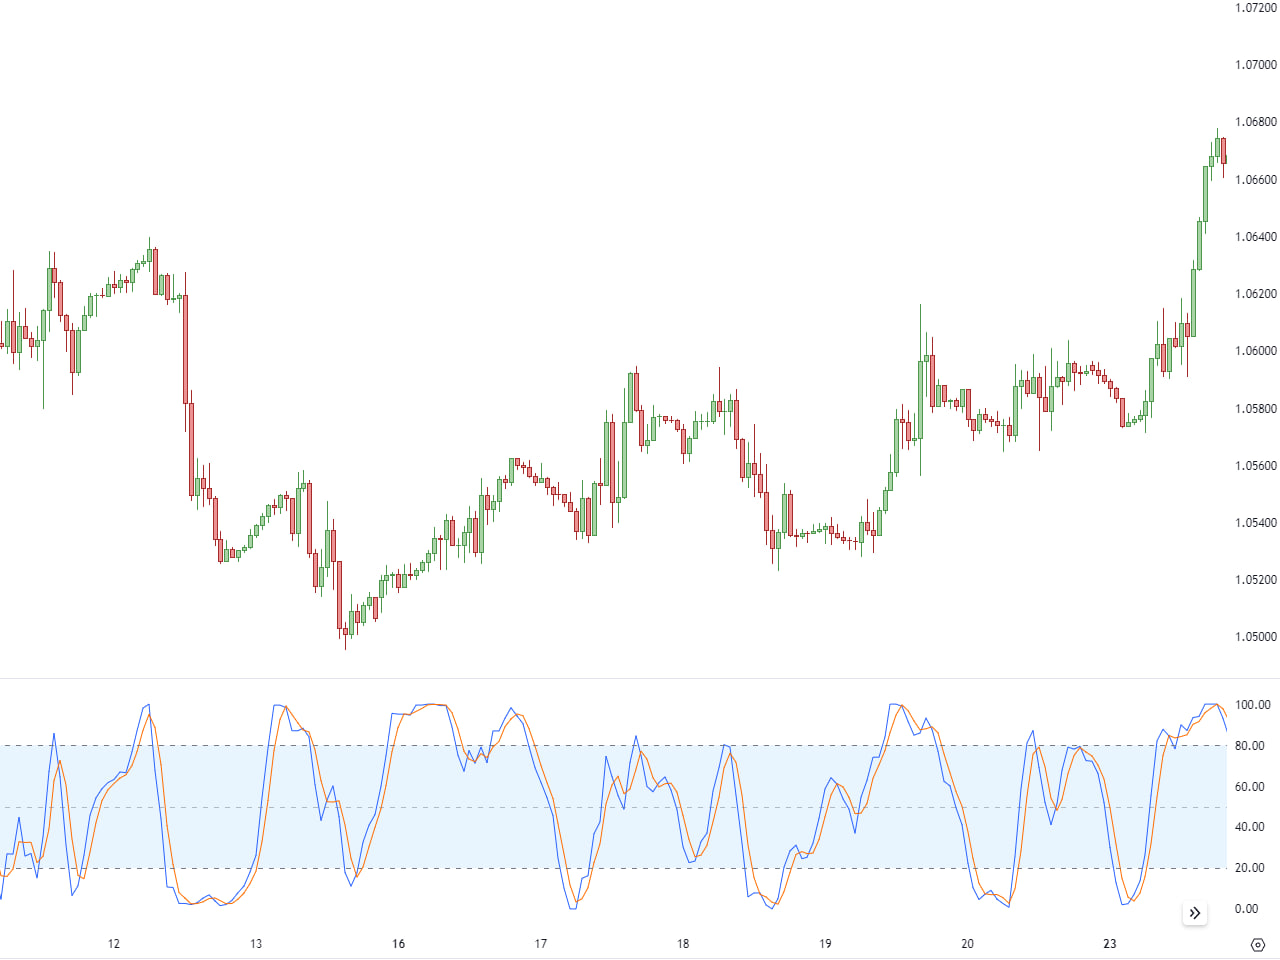
The Stochastic RSI (Relative Strength Index) is a technical analysis indicator that amalgamates features from both the Stochastic Oscillator and the RSI. Its primary purpose is to discern overbought and oversold conditions within a market, akin to the RSI, while incorporating the momentum and sensitivity characteristics of the Stochastic Oscillator.
The computation of the Stochastic RSI involves two pivotal steps:
- Calculate the RSI: Initially, the RSI is determined over a specified period, typically spanning 14 days. This computation establishes the relative strength of an asset’s recent price gains in relation to its recent price losses.
- Apply the Stochastic Oscillator formula to the RSI values: The resultant RSI values serve as input for the Stochastic Oscillator formula. This process entails calculating the %K and %D values, where %K denotes the current RSI position within its range, and %D represents a smoothed average of %K.
Much like the Stochastic Oscillator, the Stochastic RSI is graphed on a scale ranging from 0 to 100. Readings surpassing 80 are generally interpreted as overbought, suggesting a potential reversal to the downside. Conversely, readings below 20 are viewed as oversold, indicating a potential reversal to the upside.
Traders frequently employ the Stochastic RSI to pinpoint potential buy or sell signals, assess overbought or oversold conditions, and confirm prevailing trends. By amalgamating features from both the RSI and the Stochastic Oscillator, it provides a more holistic perspective on market conditions.
Triple EMA Indicator
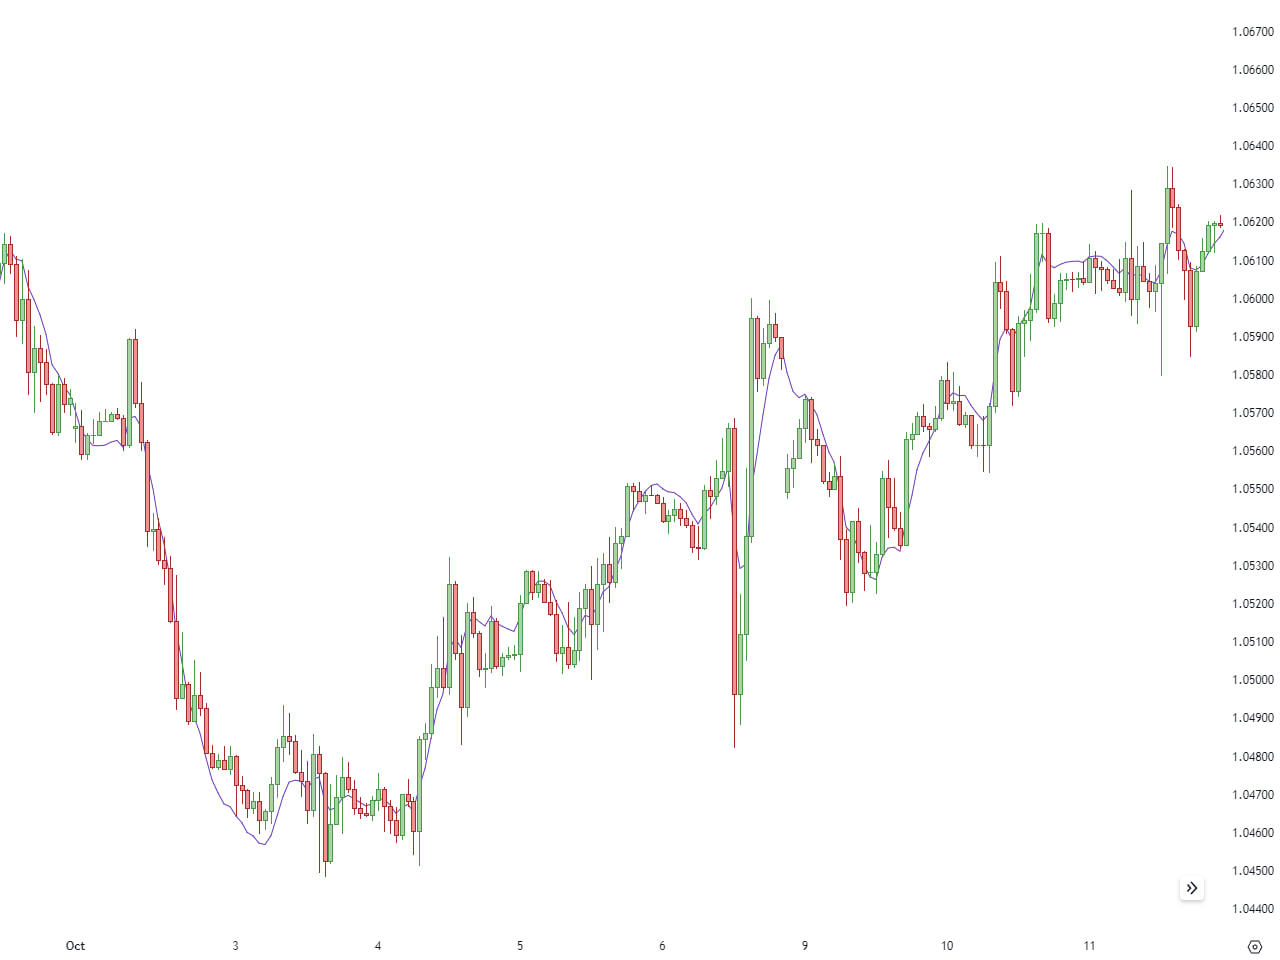
The Triple Exponential Moving Average (Triple EMA) is a technical analysis indicator categorized under exponential moving averages. Distinguishing itself from the conventional exponential moving average, the Triple EMA integrates a triple smoothing process, yielding a more nimble trend-following indicator.
The computation of the Triple EMA involves the following steps:
- Calculate the First EMA: Initiate the process by determining the EMA over a designated period, commonly denoted as the short-term EMA.
- Calculate the Second EMA: Subsequently, apply the EMA formula anew to the outcome obtained in the initial step. This is frequently termed the medium-term EMA.
- Calculate the Third EMA: Conclude the procedure by once again applying the EMA formula to the result from the second step. This is commonly known as the long-term EMA.
The Triple EMA is then graphed on a price chart, portraying the smoothed average of the underlying price data, with a heightened emphasis on recent prices due to the triple smoothing process.
Traders commonly leverage the Triple EMA to identify trends, potential reversals, and to generate signals for buying or selling. The Triple EMA’s responsiveness to recent price changes makes it especially advantageous for traders who prioritize current market conditions.
In summary, the Triple EMA stands as an exponential moving average incorporating a triple smoothing process, furnishing traders with a responsive instrument for analyzing trends and identifying potential entry or exit points in the financial markets.
TRIX Indicator
The TRIX (Triple Exponential Moving Average) indicator serves as a momentum oscillator, smoothing price data to discern trends. Developed by Jack Hutson in the 1980s, TRIX is crafted to eliminate short-term price fluctuations and spotlight the overall trend direction.
This results in a line that fluctuates around a zero baseline, representing the percentage rate of change in a triple-smoothed Exponential Moving Average (EMA).
Interpretation:
- A TRIX line crossing above zero suggests bullish momentum.
- Conversely, a crossing below zero indicates bearish momentum.
- Signal line crossovers and divergence/convergence with price trends can also guide trading signals.
It’s crucial to recognize that TRIX primarily identifies the trend’s direction and strength, rather than generating specific buy or sell signals. Like any technical indicator, TRIX is commonly used alongside other analytical tools for a comprehensive market perspective. Traders and analysts should also remain mindful of potential false signals and market noise.
Conclusion
In the rapidly changing and dynamic realm of financial trading, having the appropriate indicators serves as your guide through the intricacies of the markets. Our exploration of the top indicators on TradingView has provided you with the insights to elevate your analysis, fine-tune your strategies, and meet the challenges of the trading landscape with confidence.
As you incorporate these robust tools into your trading routine, bear in mind that expertise is honed through practice and a profound understanding of how each indicator aligns with your distinct approach. Embrace the opportunities that these indicators bring, stay inquisitive, and may your trading journey be characterized by success and continual growth. Happy trading!