

Welcome to the world of scalping, where precision and speed are paramount. Scalping is a trading method that aims to capitalize on small price movements within the shortest time frames. To succeed in this fast-paced arena, traders need a set of powerful indicators that can provide quick and accurate signals.
In this extensive manual, we’ll present you with the best 20 indicators tailored for scalping. These instruments are indispensable for traders aiming to make swift judgments, capitalize on opportunities, and confidently traverse the ever-shifting realm of scalping. Whether you’re a seasoned scalper or a novice embarking on this exhilarating trading approach, these indicators will serve as your reliable companions in the quest for precise trading. Join us as we delve into the domain of scalping and unveil the tools that can elevate your mastery of this dynamic strategy.
Top 20 indicators for scalping
- Best Scalping Indicator
- Bollinger Bands Indicator
- 3 Level ZZ Semafor Indicator
- Best Moving Average Indicator
- EMA Indicator
- FXSSI.CurrentRatio Indicator
- RSI Divergence Indicator
- Stochastic Divergence Indicator
- QQE Indicator
- VWAP Bands Indicator
- Tipu Parabolic SAR Panel Indicator
- FXSSI.OrderBook Indicator
- Scalper Signal Indicator
- TTM Scalper Indicator
- ATR Trailing Stop Indicator
- Forex Entry Point Indicator
- Forex Factory Calendar (FFCal) Indicator
- Stochastic Bollinger Bands Indicator
- FX5 MACD Divergence Indicator
- Fibonacci Retracement Indicator
Best Scalping Indicator
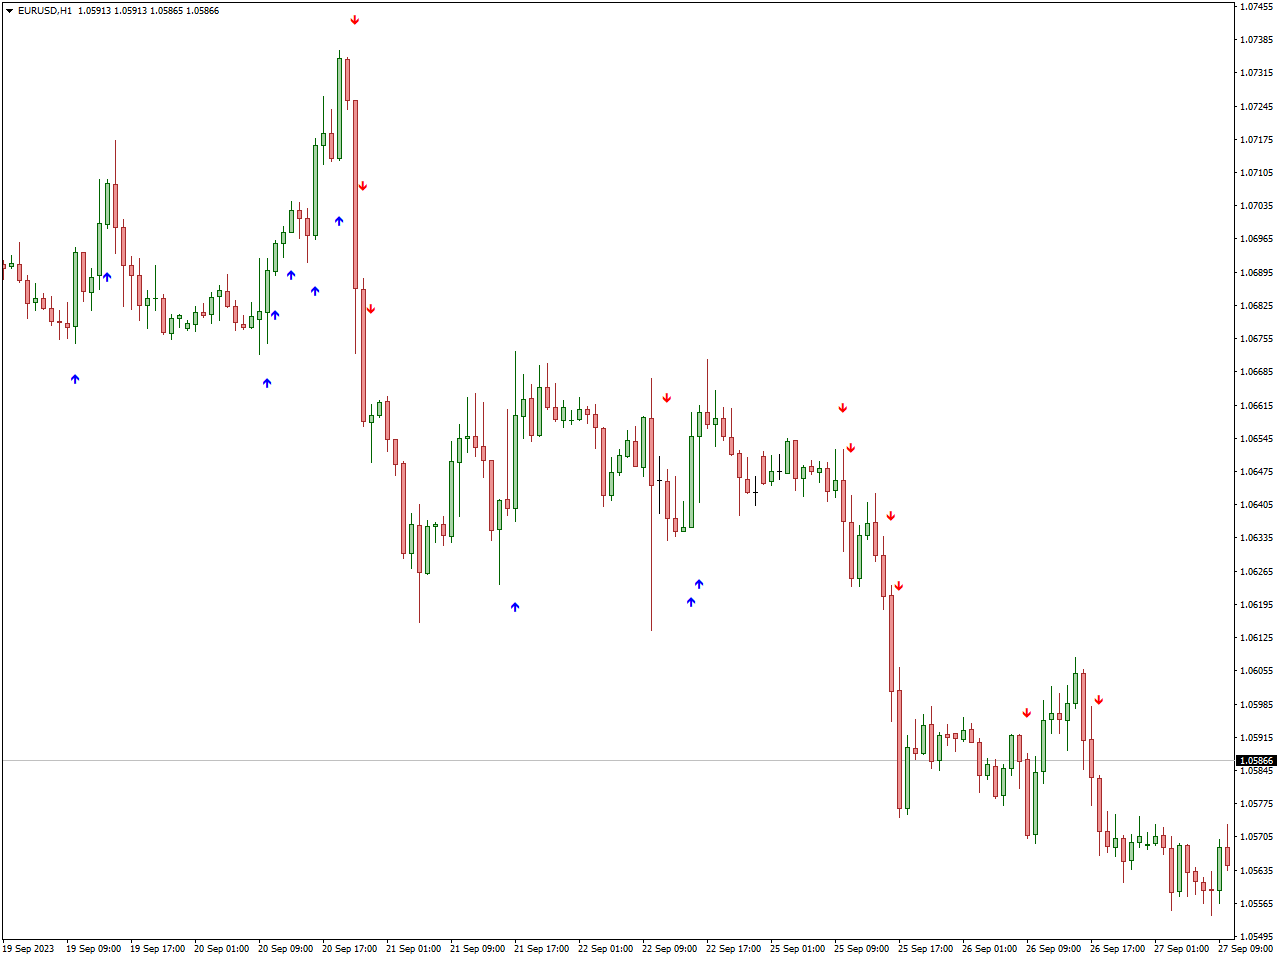
The Best Scalping Indicator is a new and highly regarded free forex tool designed for MT4, specifically catering to scalping-focused traders. Its approach combines moving averages with an oscillator to identify ideal entry and exit points for short-term trading ventures.
Furthermore, this indicator offers a customizable alert system, allowing traders to receive prompt notifications regarding potential trade opportunities.
This provided scalping indicator is meticulously crafted to harness real-time analysis and execute short-term positions as traders actively search for daily prospects, often participating in numerous trades during the day. The primary goal of this trading tool is to capture modest profits efficiently.
Bollinger Bands Indicator
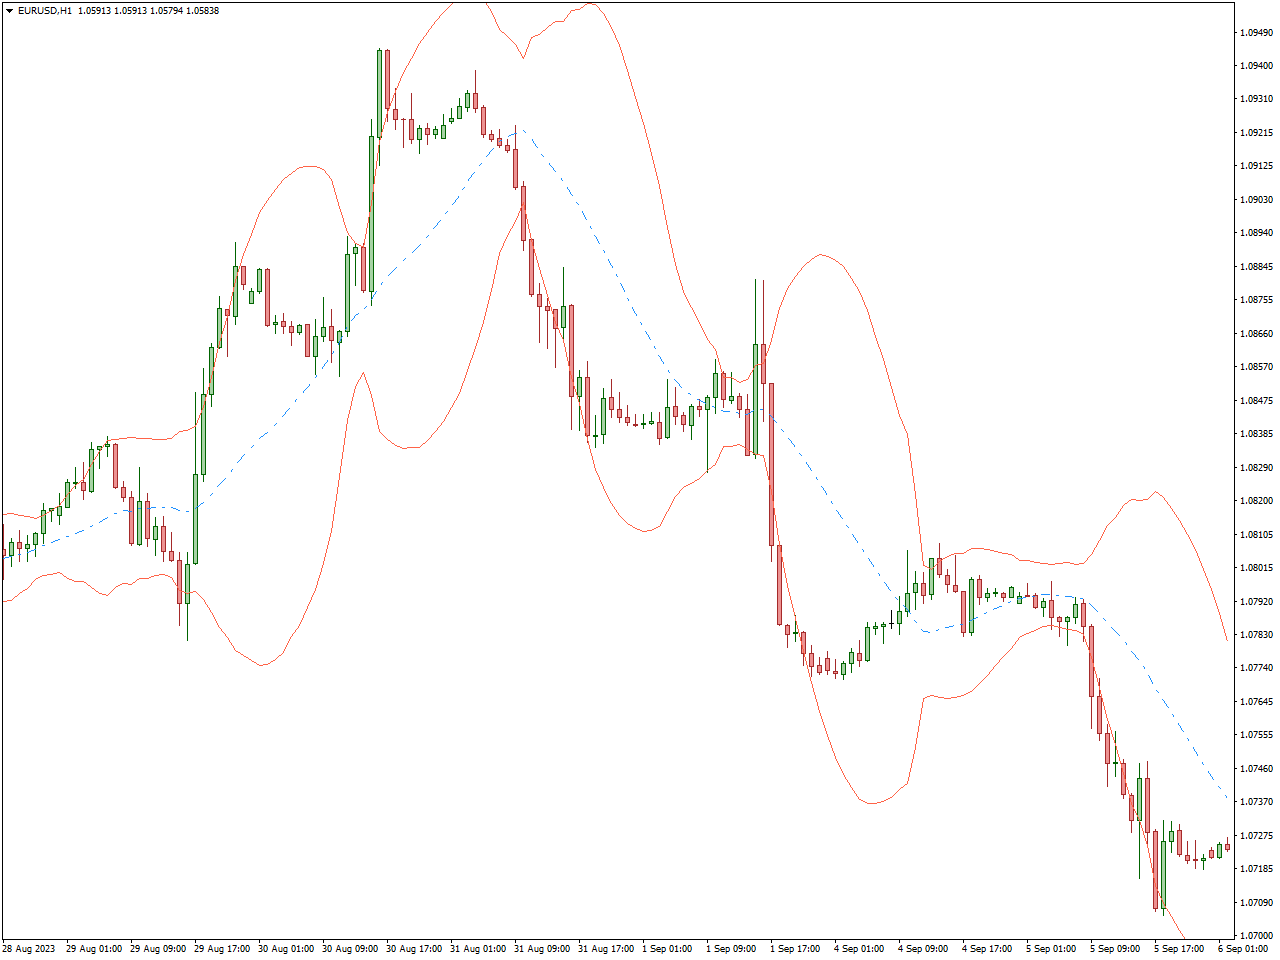
The Bollinger Bands Indicator is a widely used technical analysis tool in various financial markets, including stocks, forex, and commodities. It was developed by John Bollinger and is designed to provide traders with insights into price volatility, potential price reversals, and market trends.
Bollinger Bands are often used to identify potential price reversals. When prices touch or exceed the upper band, it may signal overbought conditions, suggesting a potential reversal to the downside. Conversely, when prices touch or fall below the lower band, it may signal oversold conditions, indicating a potential reversal to the upside.
When the bands contract significantly, it’s known as a “Bollinger Squeeze.” This suggests a period of low volatility and is often followed by a significant price breakout, although the direction of the breakout is not predetermined.
3 Level ZZ Semafor Indicator
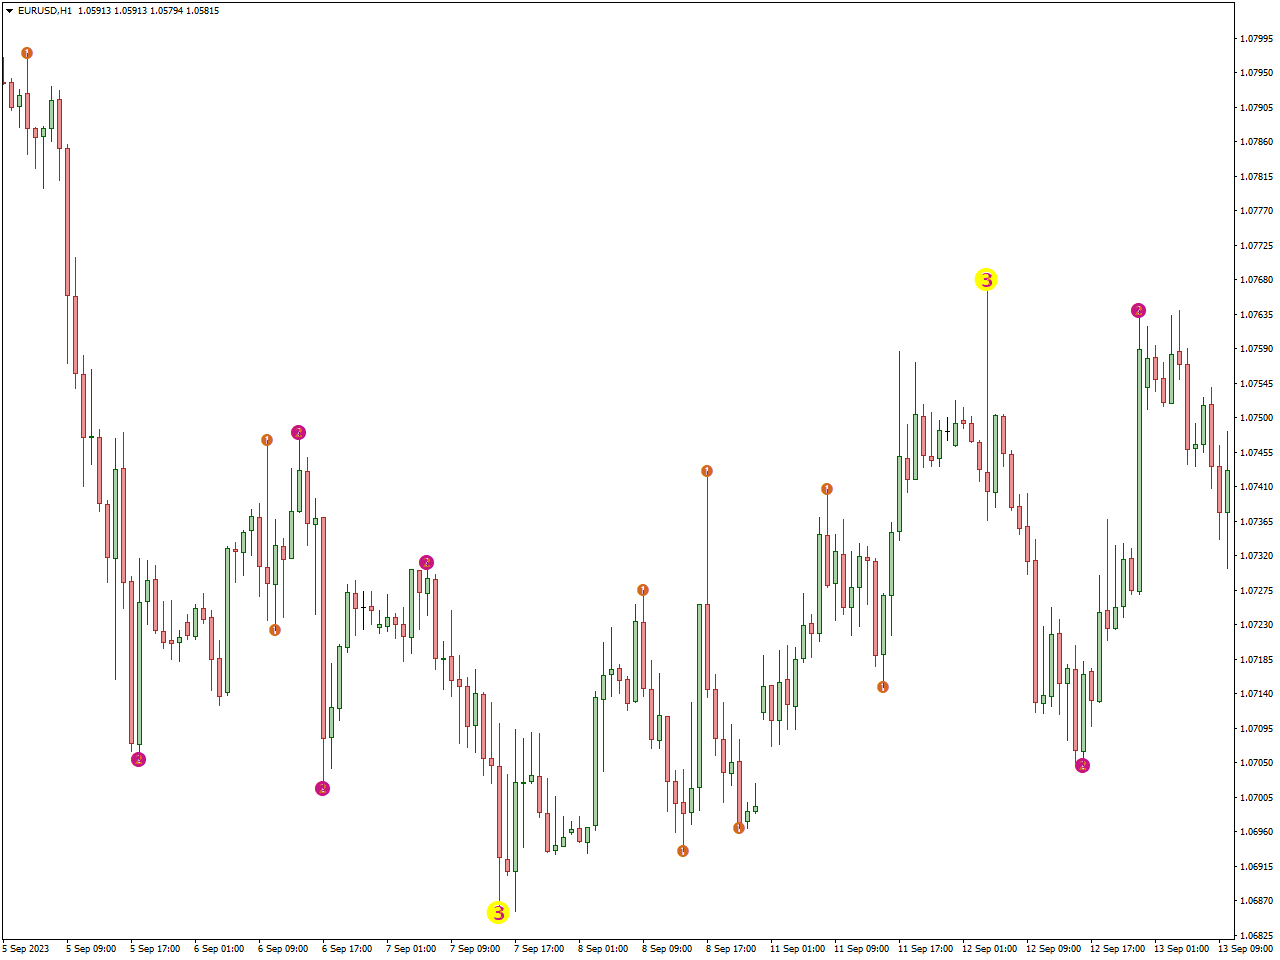
The 3 Level ZZ Semafor Indicator is a technical analysis tool used in various financial markets, including forex and stocks, to identify potential trend reversals and turning points in price movement. This indicator is based on the concept of zigzag patterns and provides traders with visual signals on price charts.
The indicator displays three levels or “Semafor” points on the price chart. These levels are typically marked with different colors or shapes for easy identification.
Traders typically use the appearance of Level 1 and 2 for scalping and daytrading. However, it’s essential to use additional technical analysis tools or indicators to confirm the reversal before making trading decisions.
Moving Averages Indicator
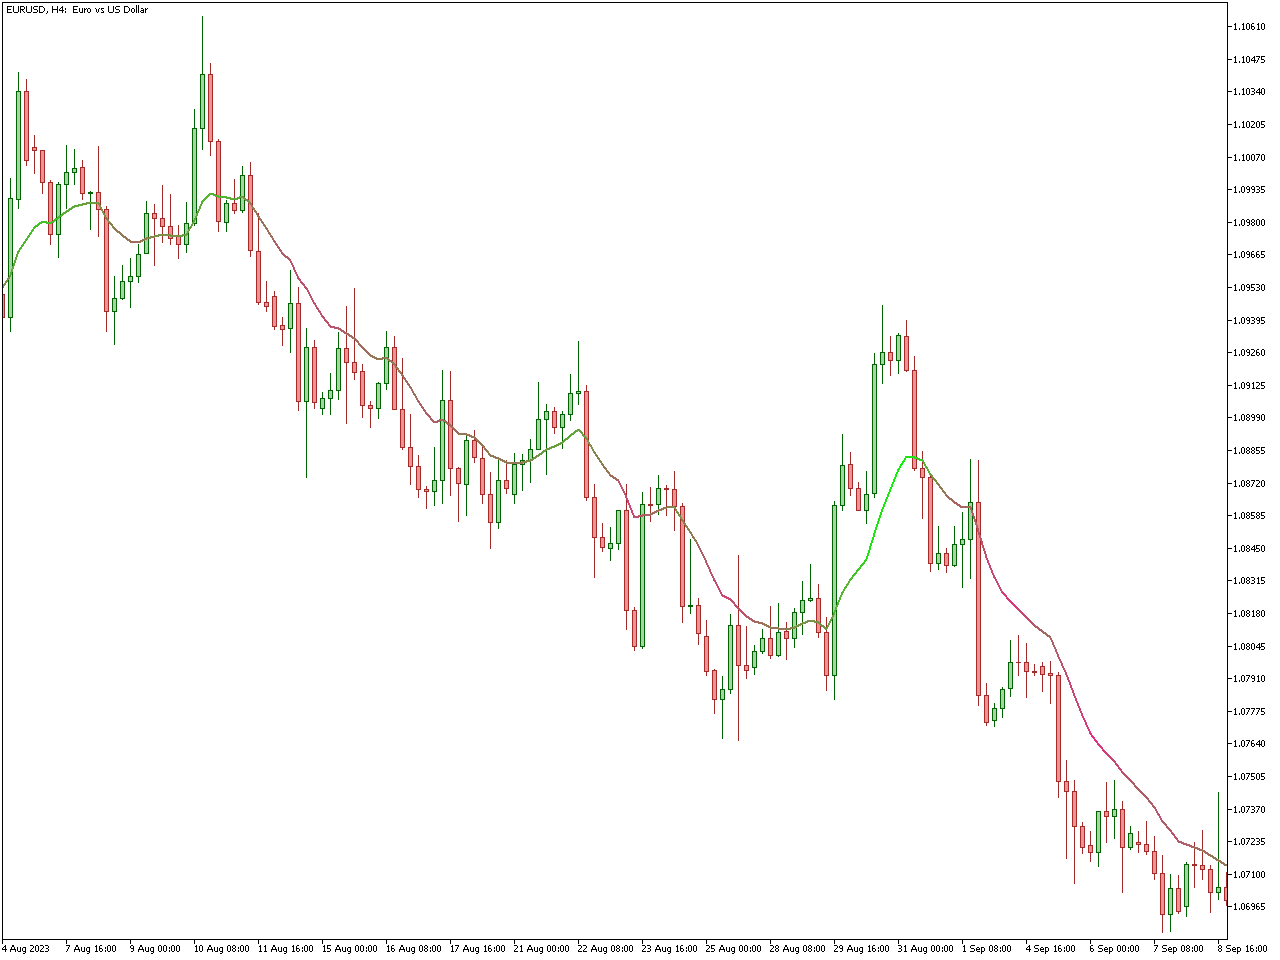
The Moving Averages Indicator is a fundamental and widely used technical analysis tool in financial markets, including stocks, forex, commodities, and cryptocurrencies. It plays a crucial role in helping traders identify trends, potential support and resistance levels, and potential entry and exit points in the market.
Moving averages serve as a fundamental tool for trend identification in price movement analysis. An above-average current price indicates an uptrend, while a below-average price signifies a downtrend. Traders frequently employ various moving averages with differing time periods to discern both short-term and long-term trend patterns.
The Moving Averages Indicator is versatile and can be adapted to various trading strategies, whether it’s trend following, mean reversion, or breakout trading.
EMA Indicator
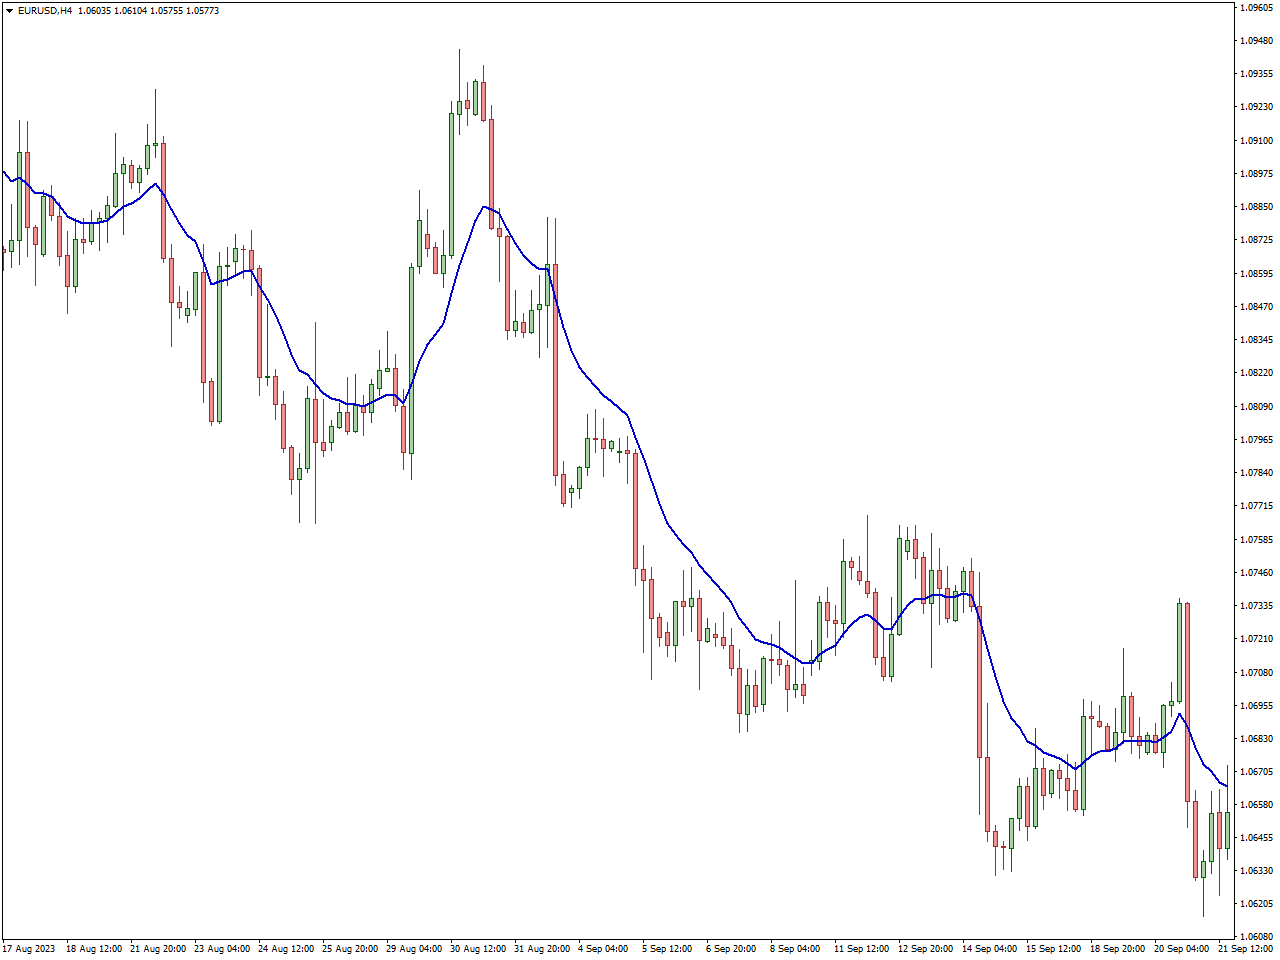
The Exponential Moving Average Indicator, commonly referred to as the EMA Indicator, is a highly regarded technical analysis tool utilized across a range of financial markets, encompassing stocks, forex, commodities, and cryptocurrencies. Distinguished by its responsiveness to recent price changes, this moving average assigns greater significance to recent price data, setting it apart from traditional moving averages.
The key feature of the EMA is its responsiveness to recent price changes. Because it gives more weight to recent data, it reacts more quickly to price movements compared to the SMA. This responsiveness makes it a popular choice for traders who want to identify short-term trends and potential entry and exit points.
Some traders use the EMA to identify divergence between the indicator and the price chart, which can signal potential trend reversals.
FXSSI.CurrentRatio Indicator
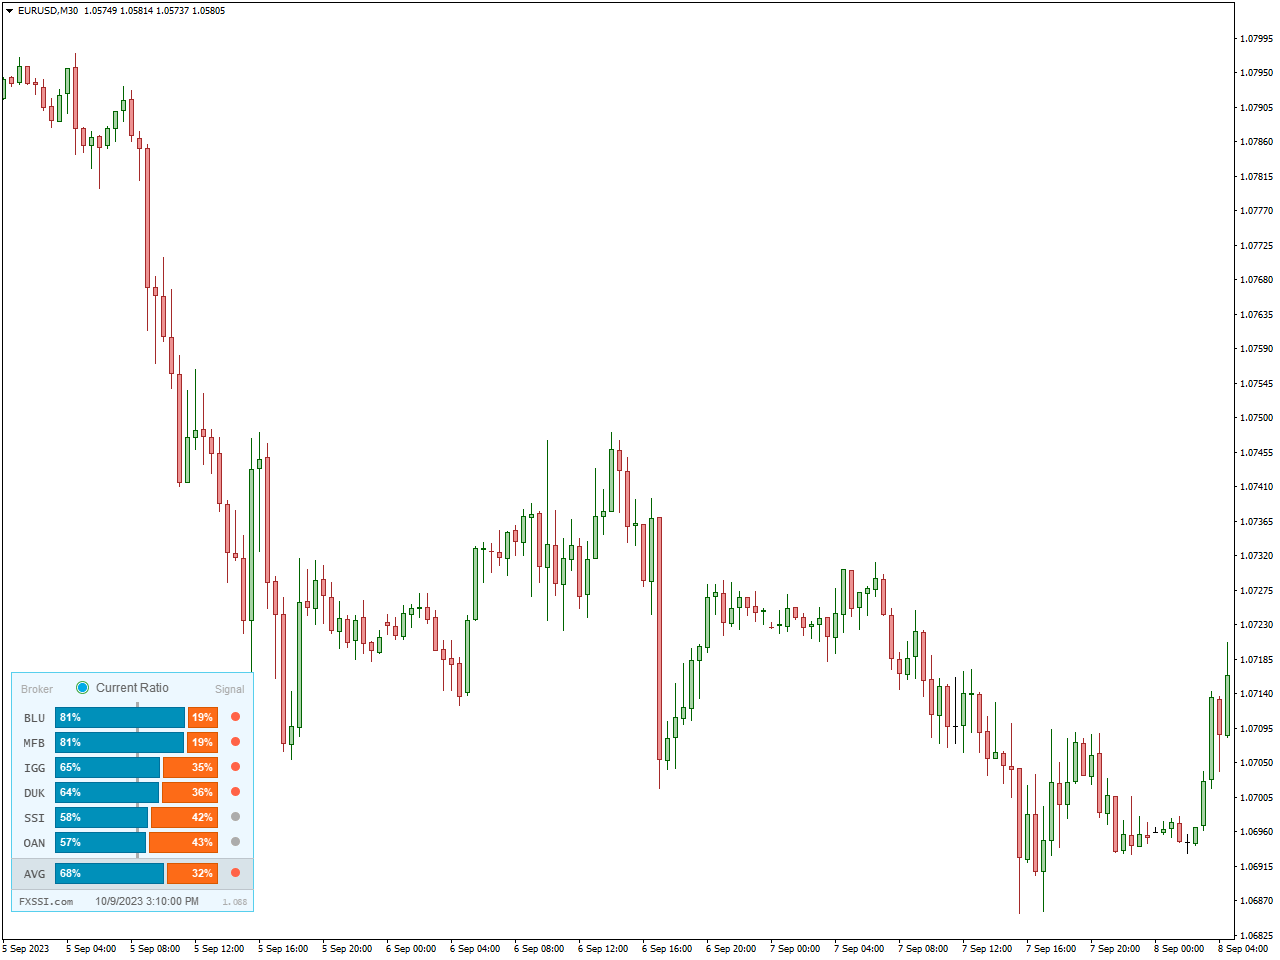
The FXSSI.CurrentRatio Indicator is a technical analysis tool used by traders in the foreign exchange (forex) market to gain insights into market sentiment and positioning. It provides information about the ratio of buyers to sellers in the market at a given time, helping traders assess market dynamics and potential price movements.
The indicator analyzes the number of open buy and sell positions among traders at any given moment. It then calculates the ratio of buyers (those with open long positions) to sellers (those with open short positions).
Some traders use the FXSSI.CurrentRatio Indicator as a contrarian signal. For instance, when the indicator shows an extremely high buyer-to-seller ratio, it may signal an overcrowded long position, potentially leading to a market reversal. Conversely, an extremely low ratio might suggest an overcrowded short position and the possibility of a reversal in the opposite direction.
RSI Divergence Indicator
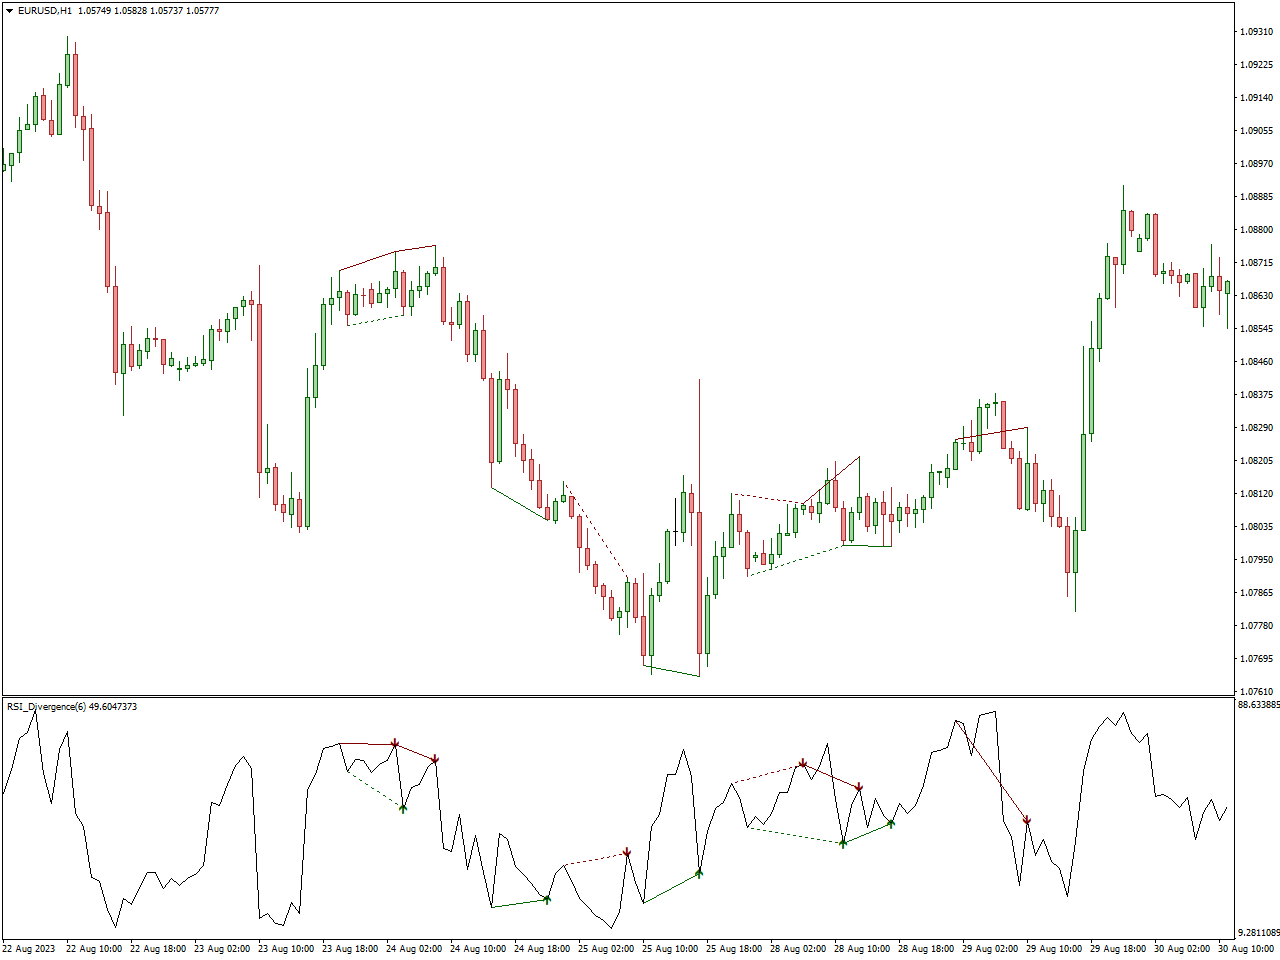
The RSI Divergence Indicator is a technical analysis instrument employed by traders across diverse financial markets, including stocks, forex, and commodities. Rooted in the Relative Strength Index (RSI), a widely recognized momentum oscillator, this tool is crafted to assist traders in pinpointing potential shifts in trend direction or alterations in market momentum.
The RSI Divergence Indicator typically displays regular and hidden divergence on the price chart, often using arrows or other visual cues to highlight potential reversal points.
Traders use the RSI Divergence Indicator to identify potential trade signals. For example, when the indicator shows regular bearish divergence (price makes a higher high while RSI makes a lower high) in an uptrend, it may suggest a possible trend reversal, and traders may consider short positions. Conversely, regular bullish divergence (price makes a lower low while RSI makes a higher low) in a downtrend could signal a potential trend reversal to the upside.
Stochastic Divergence Indicator
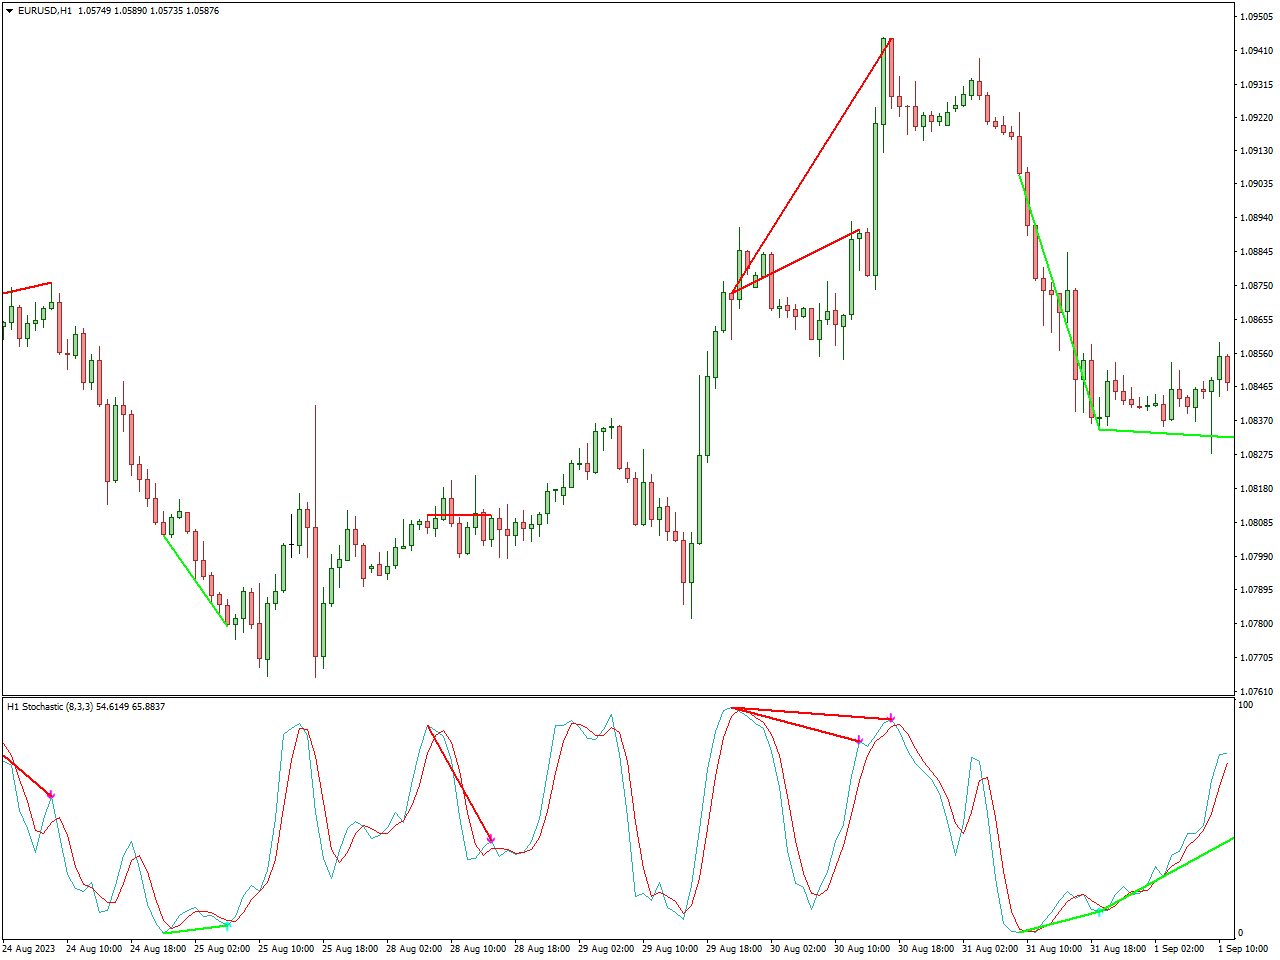
The Stochastic Divergence Indicator is a technical analysis instrument employed by traders in multiple financial markets, encompassing stocks, forex, and commodities. It derives its foundation from the Stochastic Oscillator, a momentum-based oscillator, and is specifically devised to aid traders in recognizing potential divergence patterns. These patterns serve as potential signals for trend reversals or shifts in market momentum.
The Stochastic Divergence Indicator typically displays regular and hidden divergence patterns on the price chart, often using arrows or other visual cues to highlight potential reversal points.
Like other divergence indicators, the Stochastic Divergence Indicator is often used in conjunction with other technical indicators and analysis methods to confirm signals and reduce false positives.
QQE Indicator
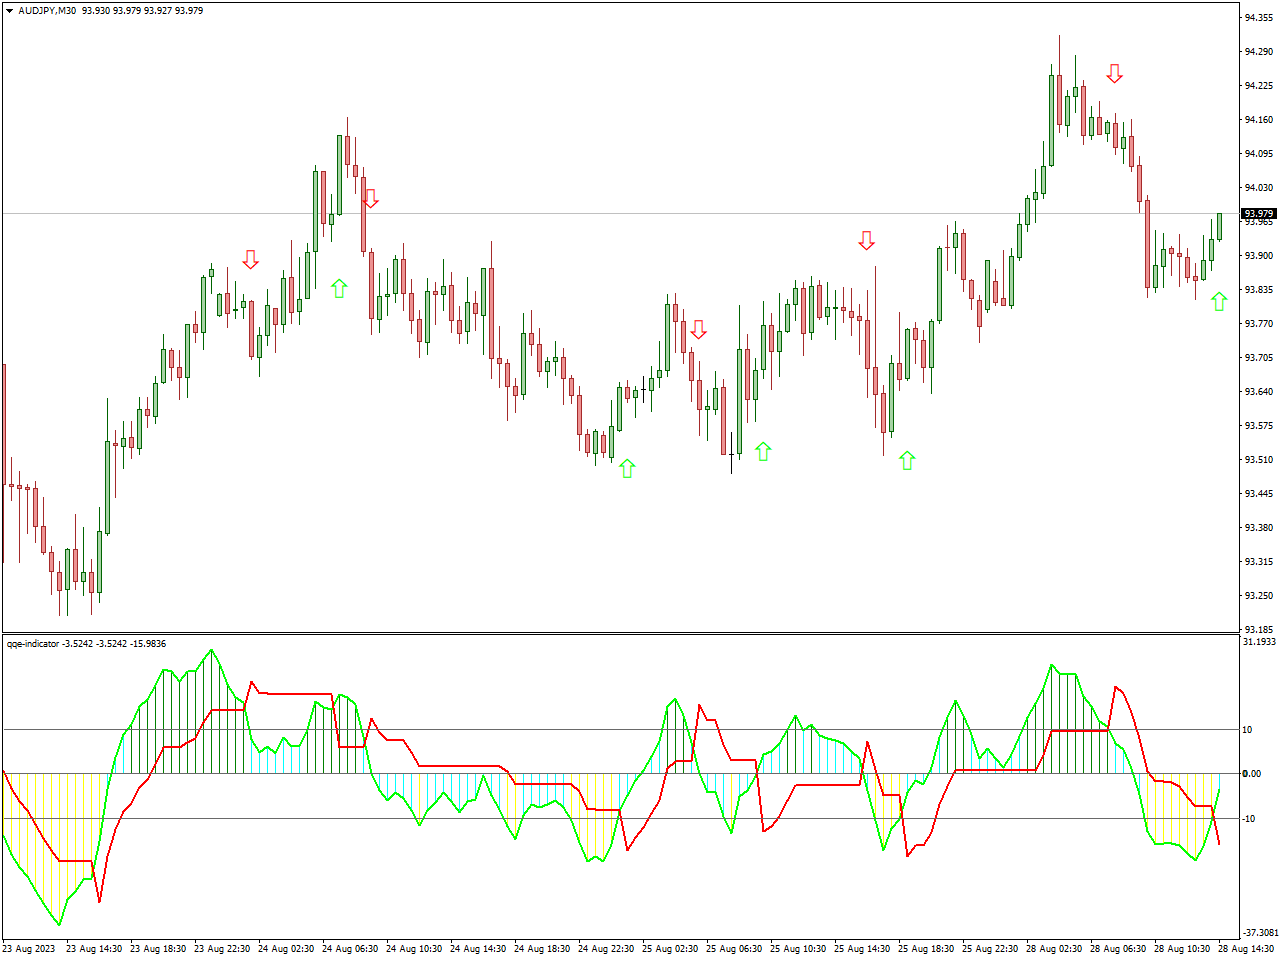
The Qualitative Quantitative Estimation (QQE) Indicator is a valuable tool utilized by traders to evaluate both the qualitative and quantitative aspects of price trends and momentum. It particularly comes into play when traders are considering “long” trading positions, anticipating upward price movements in the market. The QQE Indicator has been meticulously designed to blend qualitative and quantitative assessments of market trends, making it a versatile asset for traders.
In the context of “long” trades, where traders are expecting prices to rise, the QQE Indicator serves as a guide. Traders may contemplate closing their positions if they observe the QQE line crossing below the signal line or if there are indications of a potential trend reversal. To secure gains as prices continue to ascend, traders often employ profit targets or trailing stop orders. This proactive approach aids traders in managing their positions effectively and maximizing potential profits.
VWAP Bands Indicator
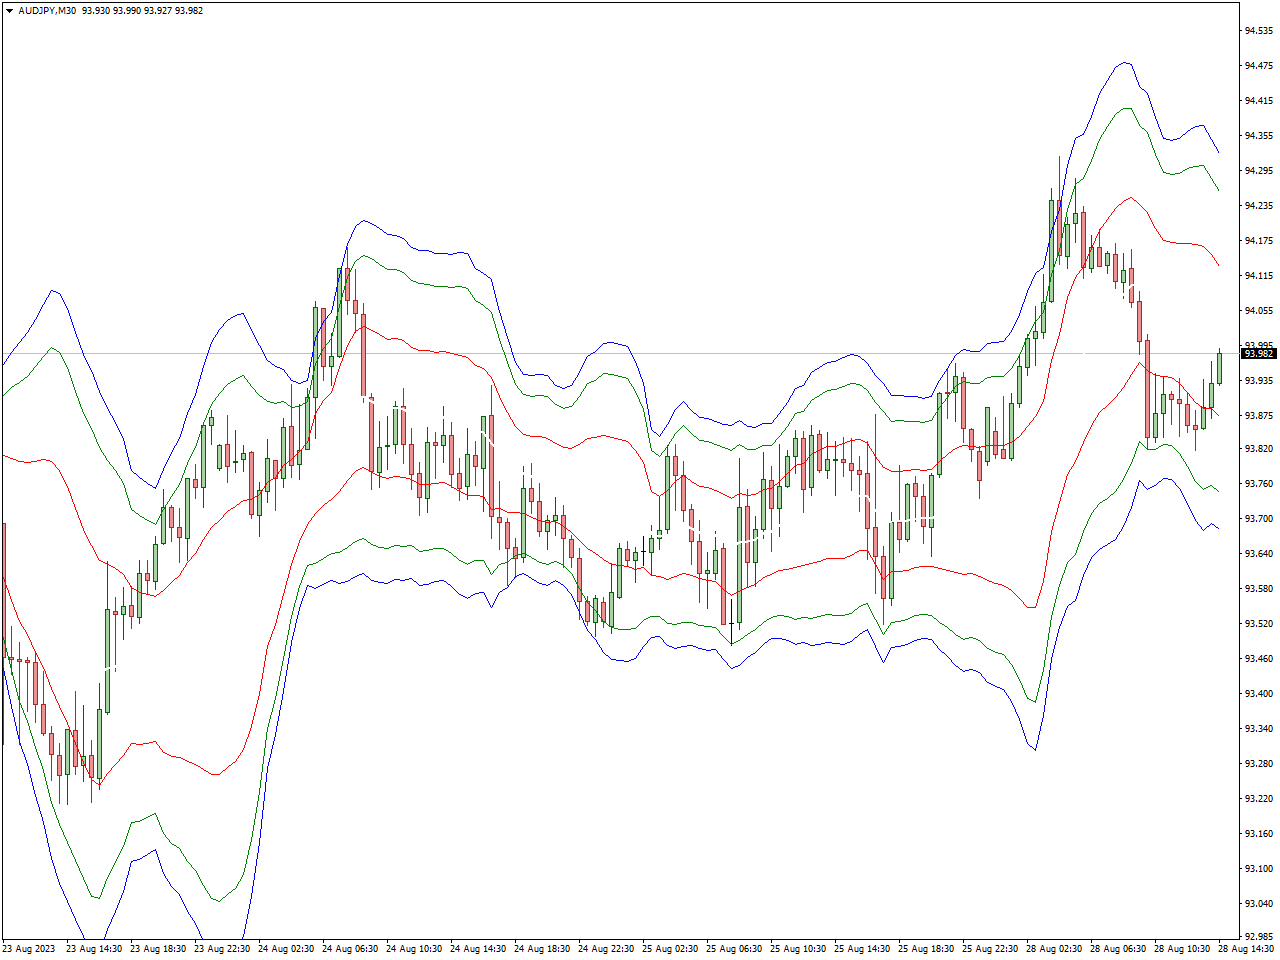
The VWAP Bands Indicator is a technical analysis tool with applications in various financial markets, including stocks, futures, and forex. It is rooted in the concept of the Volume Weighted Average Price (VWAP) and serves as a valuable tool for identifying potential support and resistance levels displayed on price charts.
The VWAP, a widely embraced trading indicator, calculates the average price at which an asset has traded over a specific time frame. It does so by considering the trading volume at each price level, thus providing traders with insights into the fair value of an asset and potential intraday support and resistance levels.
Traders often turn to the VWAP Bands to validate trends. For instance, if the price consistently remains above both the VWAP and the upper band, it may indicate a robust bullish trend. Conversely, when the price consistently stays below both the VWAP and the lower band, it may suggest a robust bearish trend. This utilization of the VWAP Bands assists traders in confirming the prevailing market sentiment and trend direction.
Tipu Parabolic SAR Panel Indicator
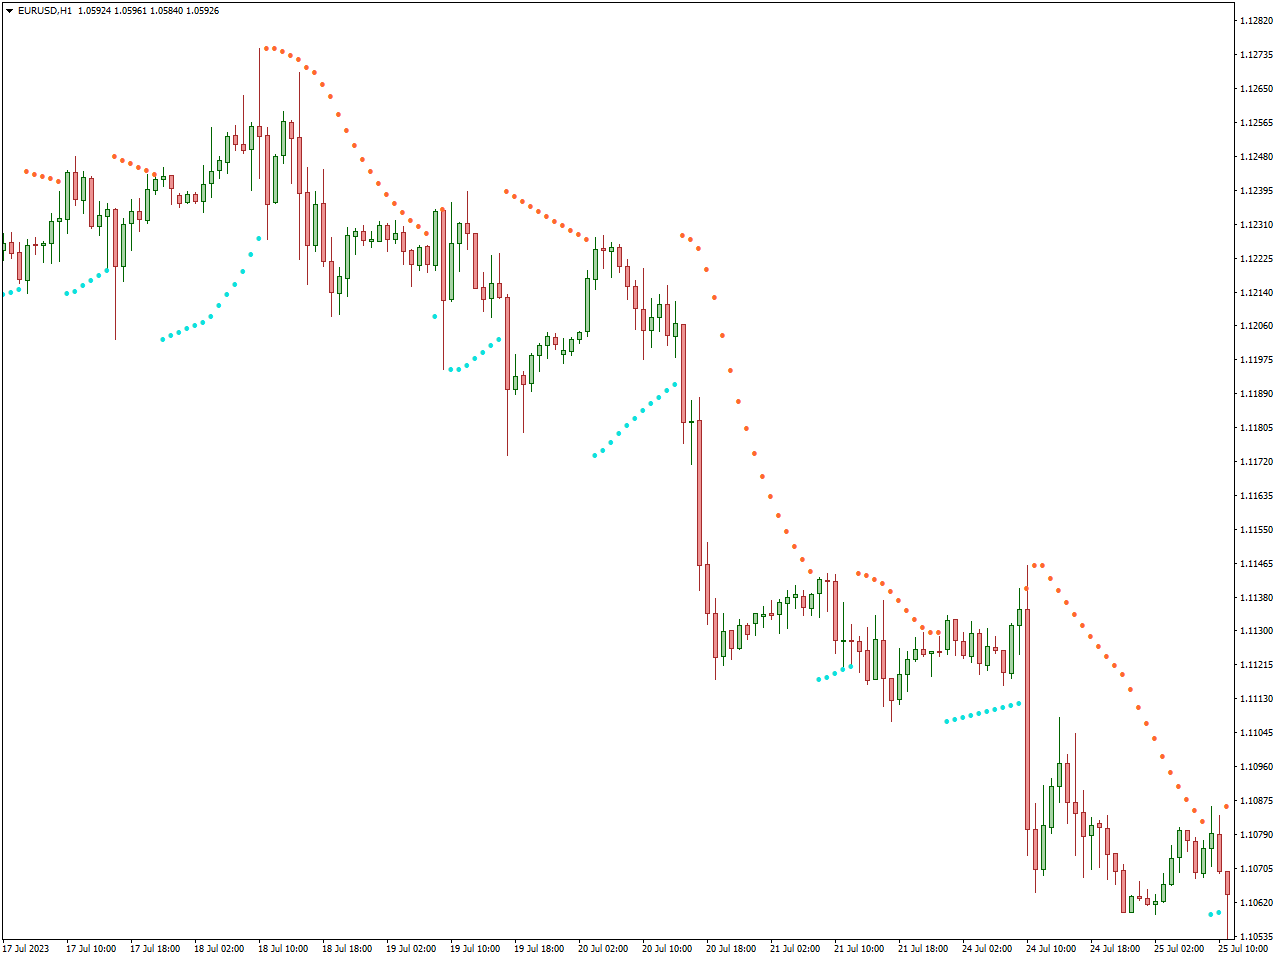
The Tipu Parabolic SAR Panel Indicator is a technical analysis instrument harnessed by traders across diverse financial markets, encompassing stocks, forex, and commodities. Its primary purpose is to aid traders in spotting potential shifts in trends and pinpointing the most advantageous moments for entering or exiting a trend.
The indicator is based on the Parabolic Stop and Reverse (SAR) indicator, a popular trend-following indicator developed by Welles Wilder. The Parabolic SAR helps traders identify the direction of a trend and provides potential reversal points. It does so by plotting dots above or below the price chart, with the placement of these dots changing as the trend develops.
Traders often use the Parabolic SAR for entry and exit signals. For example, when the SAR dots switch from being above the price chart to below it, it can signal an entry point for a long (buy) position. Conversely, when the dots switch from below to above, it can signal an exit point or a potential short (sell) entry.
FXSSI.OrderBook Indicator
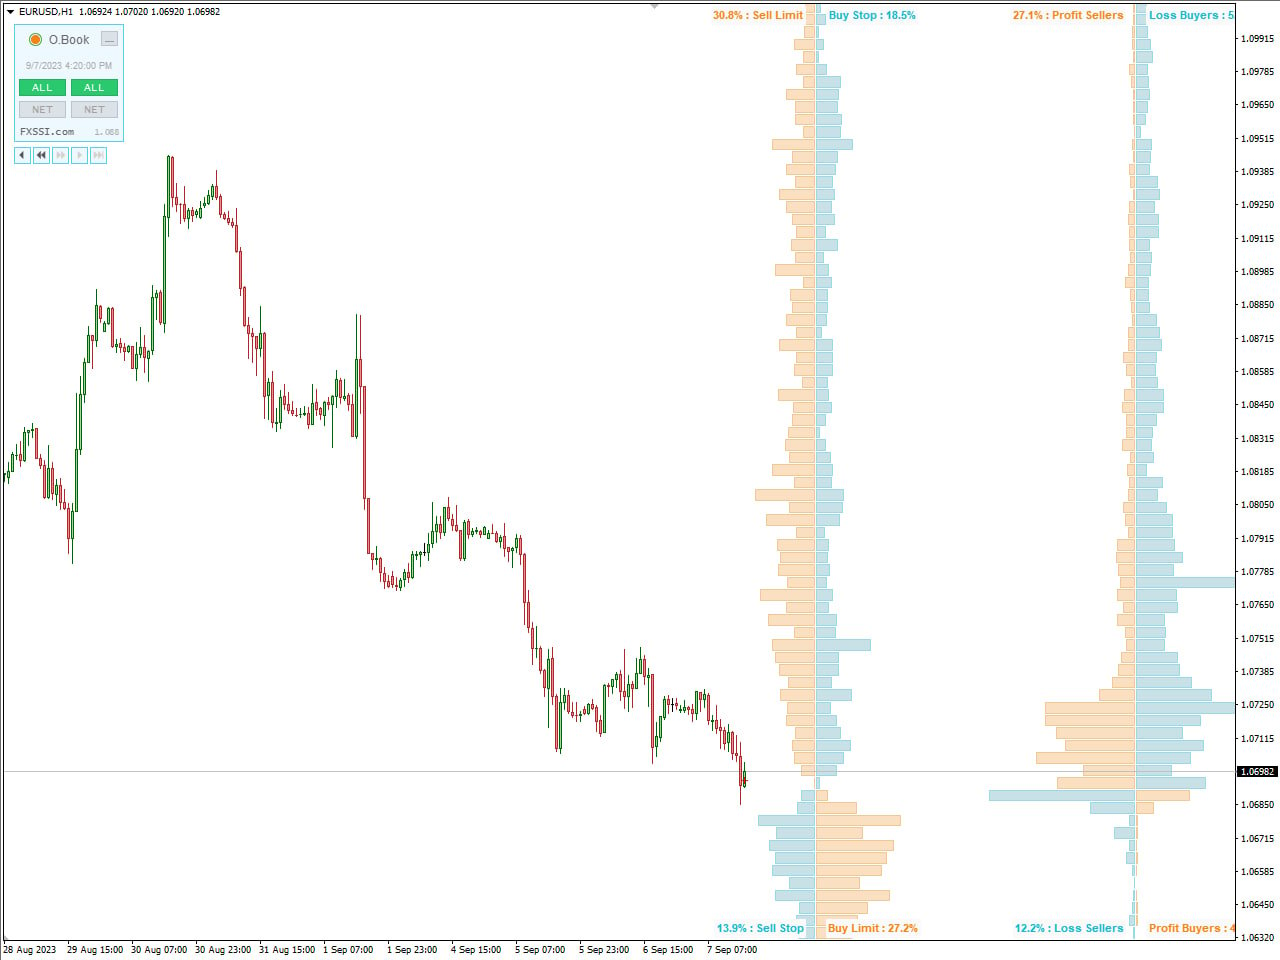
FXSSI.OrderBook is a trading tool and service provided by FXSSI (Forex Sentiment & Volume Analysis), a platform dedicated to offering a wide range of resources and data to assist traders in the foreign exchange (forex) market. Specifically, FXSSI.OrderBook focuses on providing order book data and conducting sentiment analysis for major currency pairs.
The Order Book provides insights into the volume and orders at various price levels, facilitating the examination and assessment of past market dynamics. Additionally, it discloses the quantity of assets accessible at each price level, enabling traders to detect regions characterized by notable buying or selling interest. Certain traders harness Order Book information to formulate trading strategies, including scalping or momentum trading, which rely on short-term order flow.
FXSSI.OrderBook has been thoughtfully designed to empower forex traders with a deeper understanding of market dynamics and trends, facilitating more informed trading decisions. It accomplishes this by granting access to both real-time and historical order book data, complemented by comprehensive sentiment analysis. This comprehensive tool equips traders with valuable insights to navigate the forex market effectively.
Scalper Signal Indicator
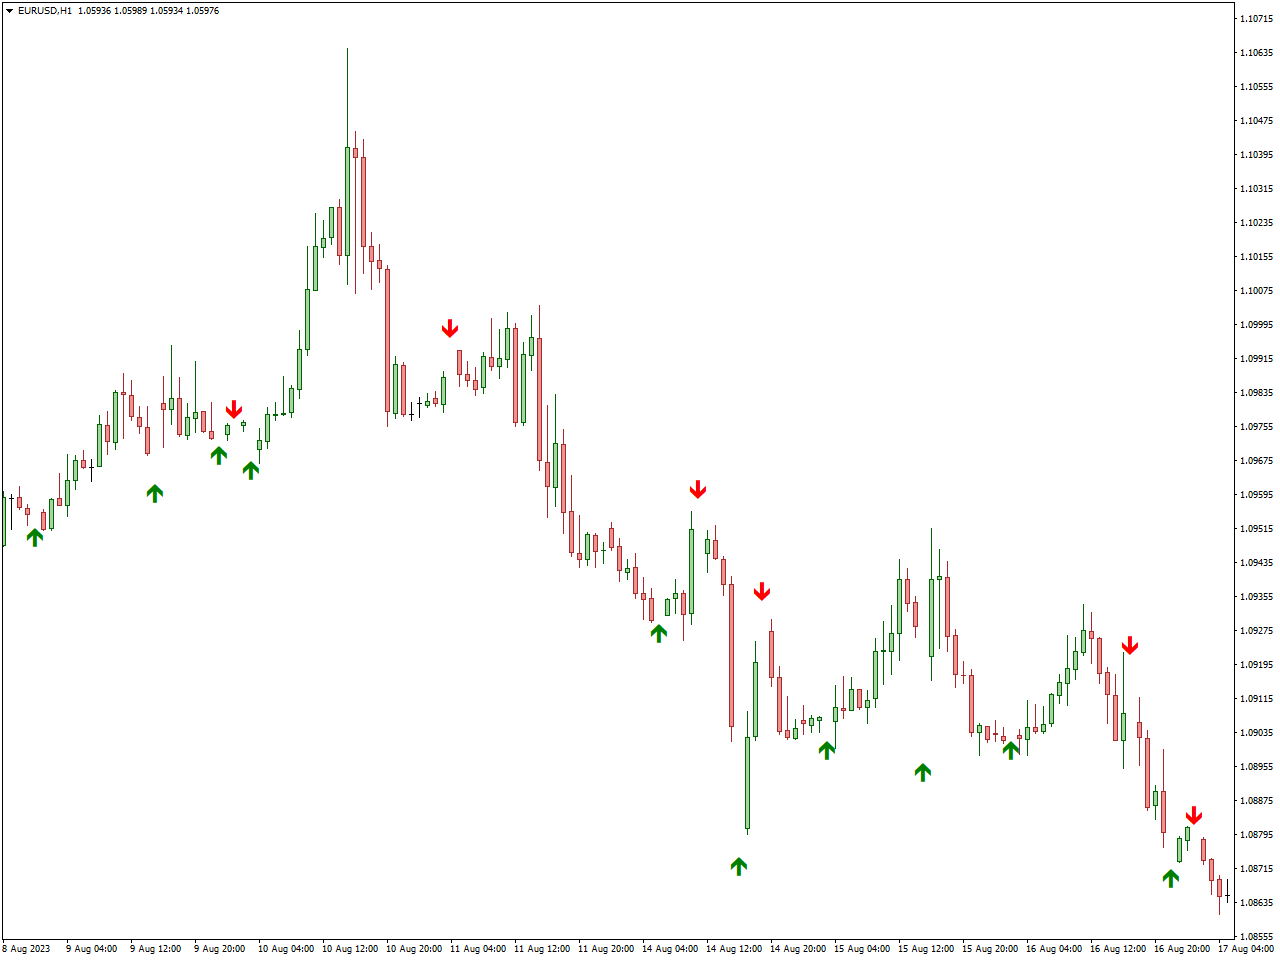
The Scalper Signal Indicator is a frequently employed technical analysis instrument, especially favored by traders involved in the practice of scalping, across a range of financial markets, including stocks, forex, and commodities. Scalping is a trading strategy with a short-term focus, aiming to capitalize on minor price fluctuations within the market.
The Scalper Signal Indicator is designed to provide traders with signals that can assist in identifying potential entry and exit points for quick, short-term trades. Scalpers aim to capitalize on rapid price fluctuations, and this indicator aims to support that objective.
Scalping requires precise timing, and the indicator is designed to provide signals that align with short-term price movements. Traders rely on these signals for their accuracy and quick response.
TTM Scalper Indicator
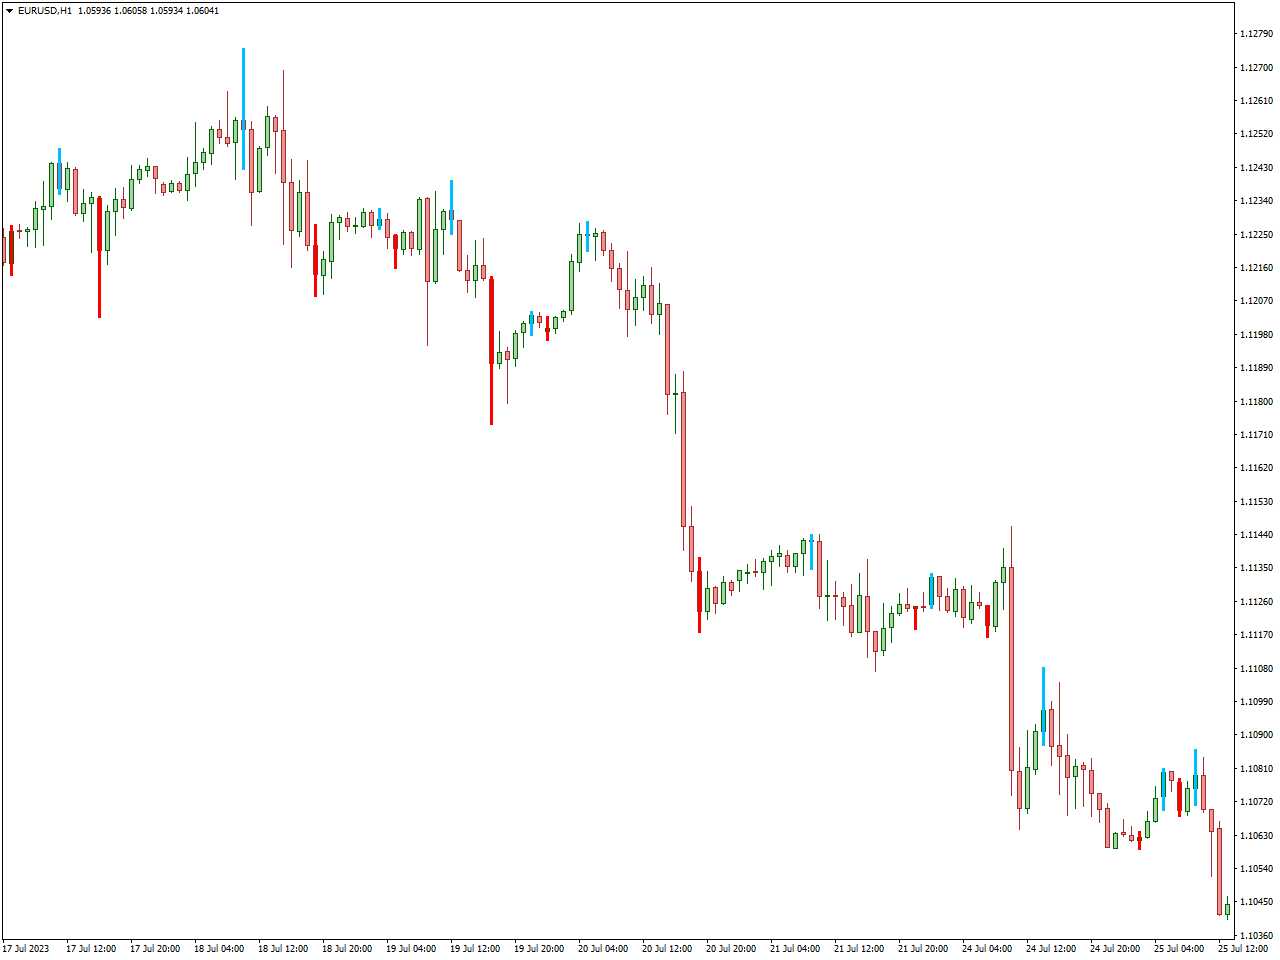
The TTM Scalper Indicator is a well-recognized technical analysis instrument commonly utilized by traders, particularly those engaged in the realms of day trading and scalping. Scalping is a trading strategy concentrated on reaping swift, incremental profits from the rapid price shifts within the market. With its design, the TTM Scalper Indicator aids traders in spotting potential short-term trading prospects and taking prompt action.
The primary function of this indicator is to generate signals on a price chart. These signals are typically displayed as colored bars or dots. Traders interpret these signals as buy or sell opportunities.
Scalpers rely on precise entry and exit points to minimize risk and maximize potential gains. The TTM Scalper Indicator is designed to assist in identifying these points.
ATR Trailing Stop Indicator
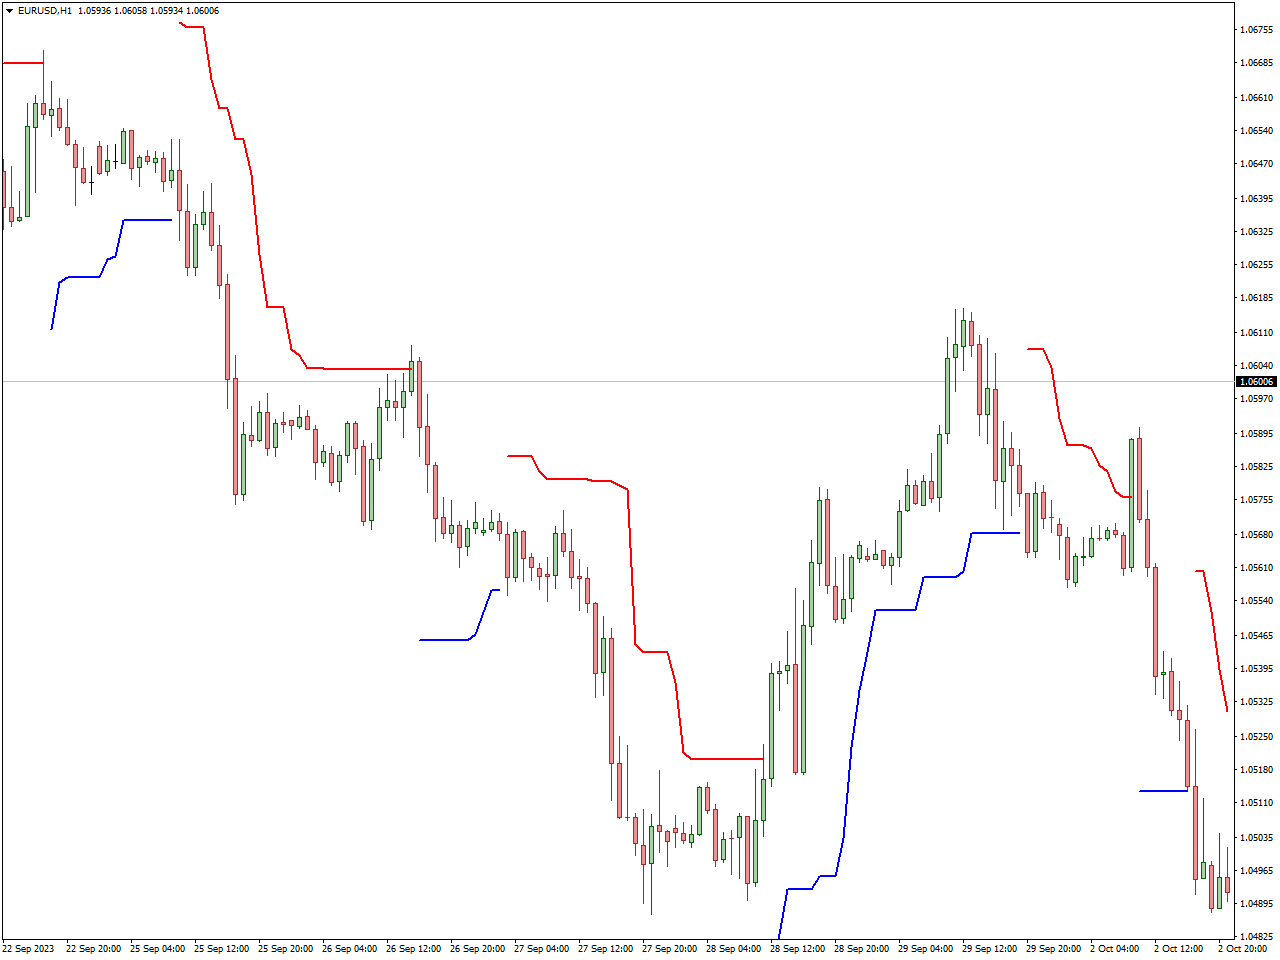
The ATR Trailing Stop Indicator is a technical analysis tool used by traders to set trailing stop levels based on market volatility. ATR stands for Average True Range, and it is a measure of price volatility. The indicator calculates the ATR value and uses it to determine the distance between the current price and the trailing stop level.
One of the key advantages of the ATR Trailing Stop is that it adjusts dynamically to changes in market volatility. When volatility increases, the trailing stop widens to accommodate larger price swings, helping traders stay in a trade during strong trends. Conversely, during periods of lower volatility, the trailing stop tightens to protect profits.
The trailing stop functions as an exit plan. It shifts along with the price as it moves favorably for the trader. If the price turns around and reaches the trailing stop level, the trade is automatically terminated, securing the accumulated profits.
Forex Entry Point Indicator
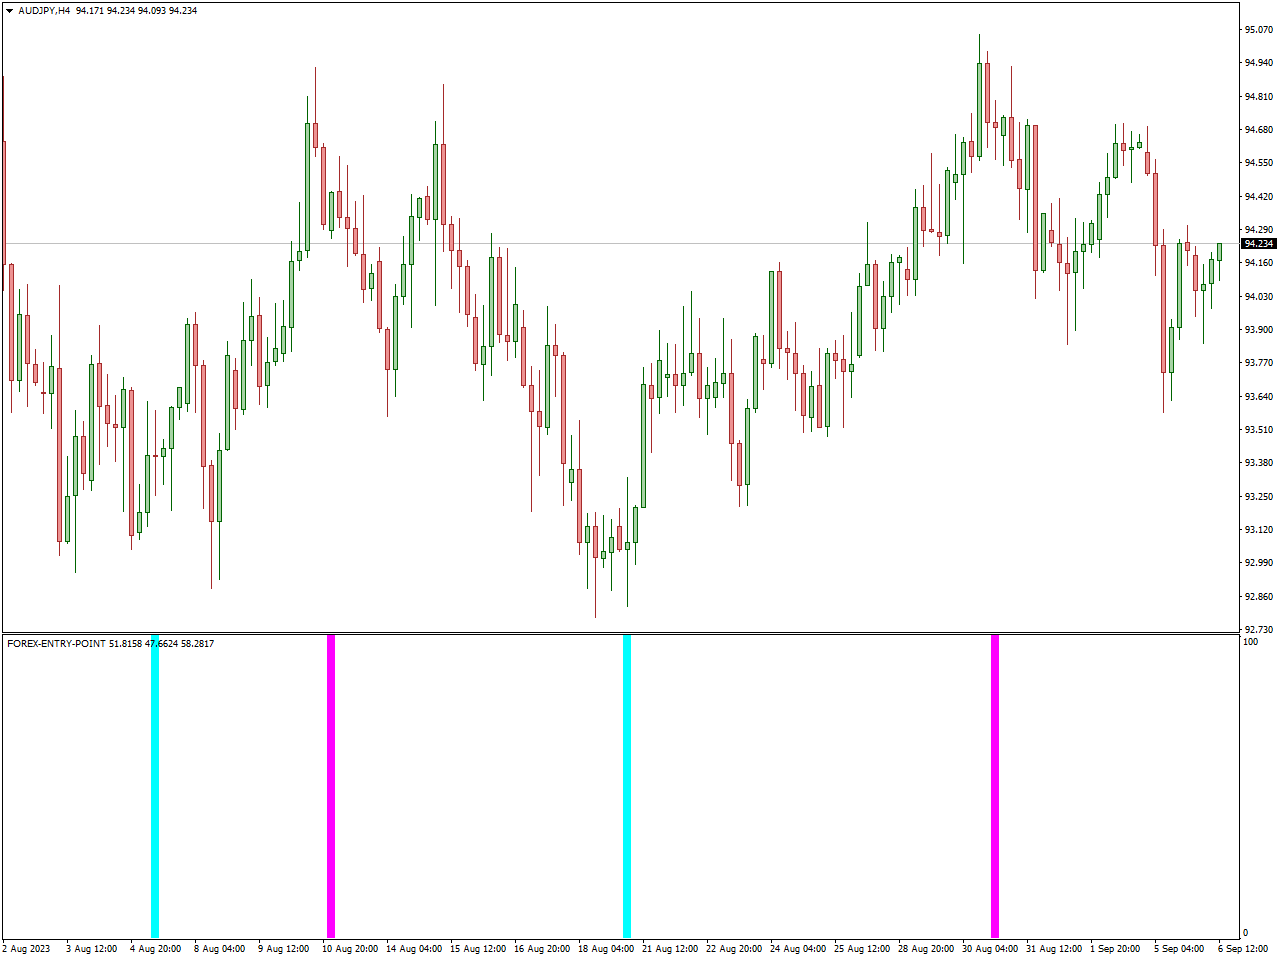
The Forex Entry Point Indicator is a valuable resource employed by forex traders to enhance their decision-making process when entering the market. It serves as a tool to identify opportune moments for trade initiation based on predetermined technical parameters.
Typically, this indicator takes into account a range of factors, including price patterns, moving averages, oscillators, and various technical indicators, to generate signals that pinpoint optimal entry points. The ultimate objective is to align market conditions with the trader’s strategy, thereby increasing the probability of executing successful trades.
Forex Factory Calendar (FFCal) Indicator
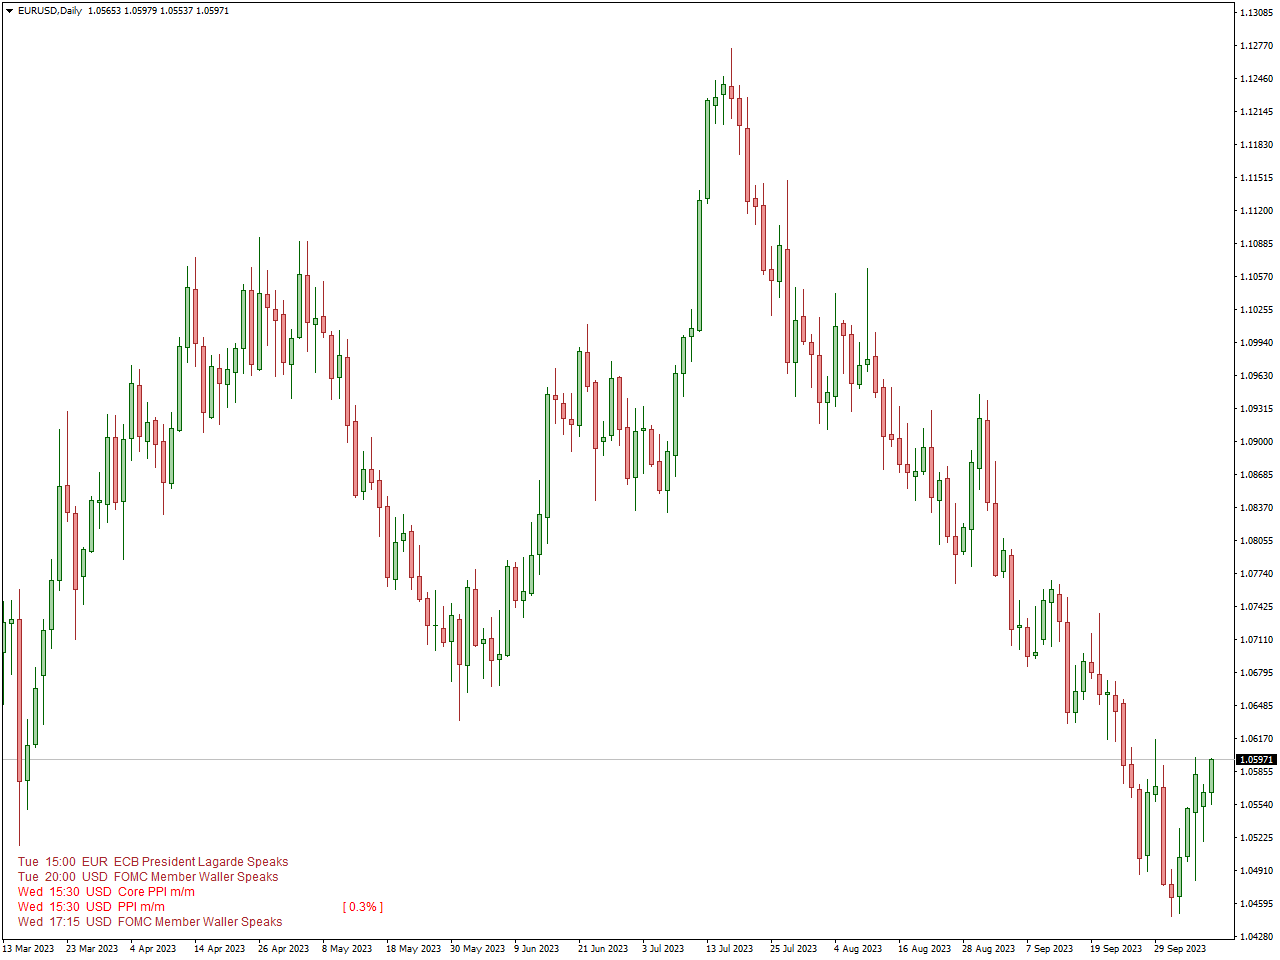
The Forex Factory Calendar (FFCal) Indicator is a popular tool used by traders in the foreign exchange (forex) market to stay updated on important economic events, news releases, and announcements that can impact currency prices. It is designed to provide traders with a visual representation of scheduled economic events and their potential market impact.
The indicator displays a calendar with dates and times of upcoming economic events, such as central bank interest rate decisions, GDP releases, employment reports, and more. Each event is categorized by its expected level of impact on the market, such as “Low,” “Medium,” or “High” impact.
The FFCal Indicator uses color-coding to indicate the potential impact of each event on the market. High-impact events are often highlighted in red, indicating significant market volatility and potential price movements. Medium and low-impact events are marked in orange and yellow, respectively.
Stochastic Bollinger Bands Indicator
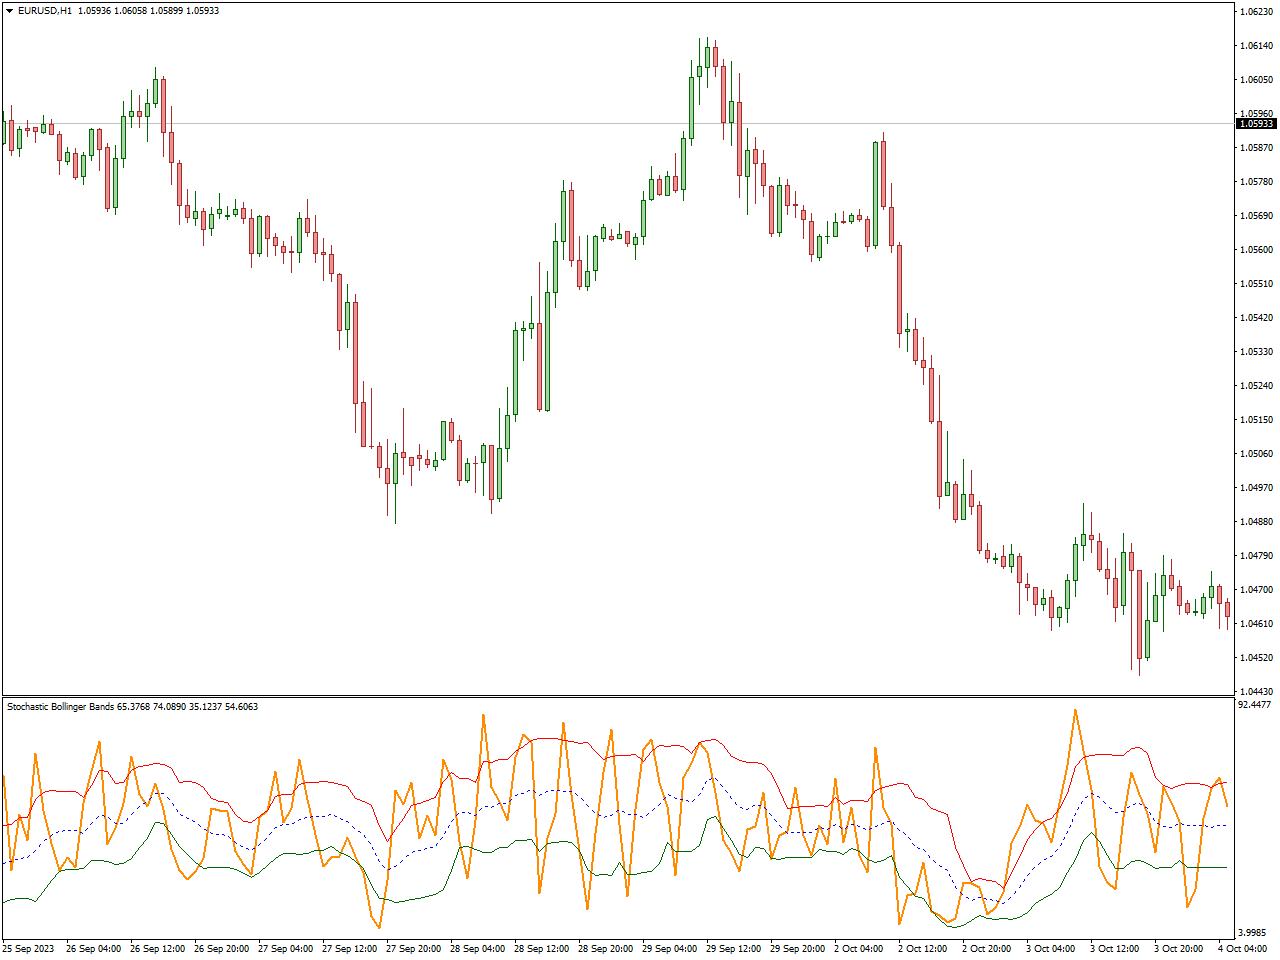
The Stochastic Bollinger Bands Indicator is a technical analysis instrument employed by traders in diverse financial markets, such as stocks, forex, and commodities. It amalgamates two widely used indicators: the Stochastic Oscillator and Bollinger Bands, with the aim of offering traders further information regarding potential trend reversals and conditions of being overbought or oversold.
The Stochastic Bollinger Bands Indicator combines the Stochastic Oscillator and Bollinger Bands. Traders use it to identify potential reversals when the Stochastic Oscillator reaches overbought or oversold levels and the price touches or crosses the Bollinger Bands. These confluence points can suggest significant turning points in price action.
Traders typically look for specific signals generated by the Stochastic Bollinger Bands Indicator. For example, when the Stochastic Oscillator is in the overbought zone (above 80) and the price touches or crosses the upper Bollinger Band, it may signal a potential bearish reversal. Conversely, when the Stochastic Oscillator is in the oversold zone (below 20) and the price touches or crosses the lower Bollinger Band, it may suggest a potential bullish reversal.
FX5 MACD Divergence Indicator
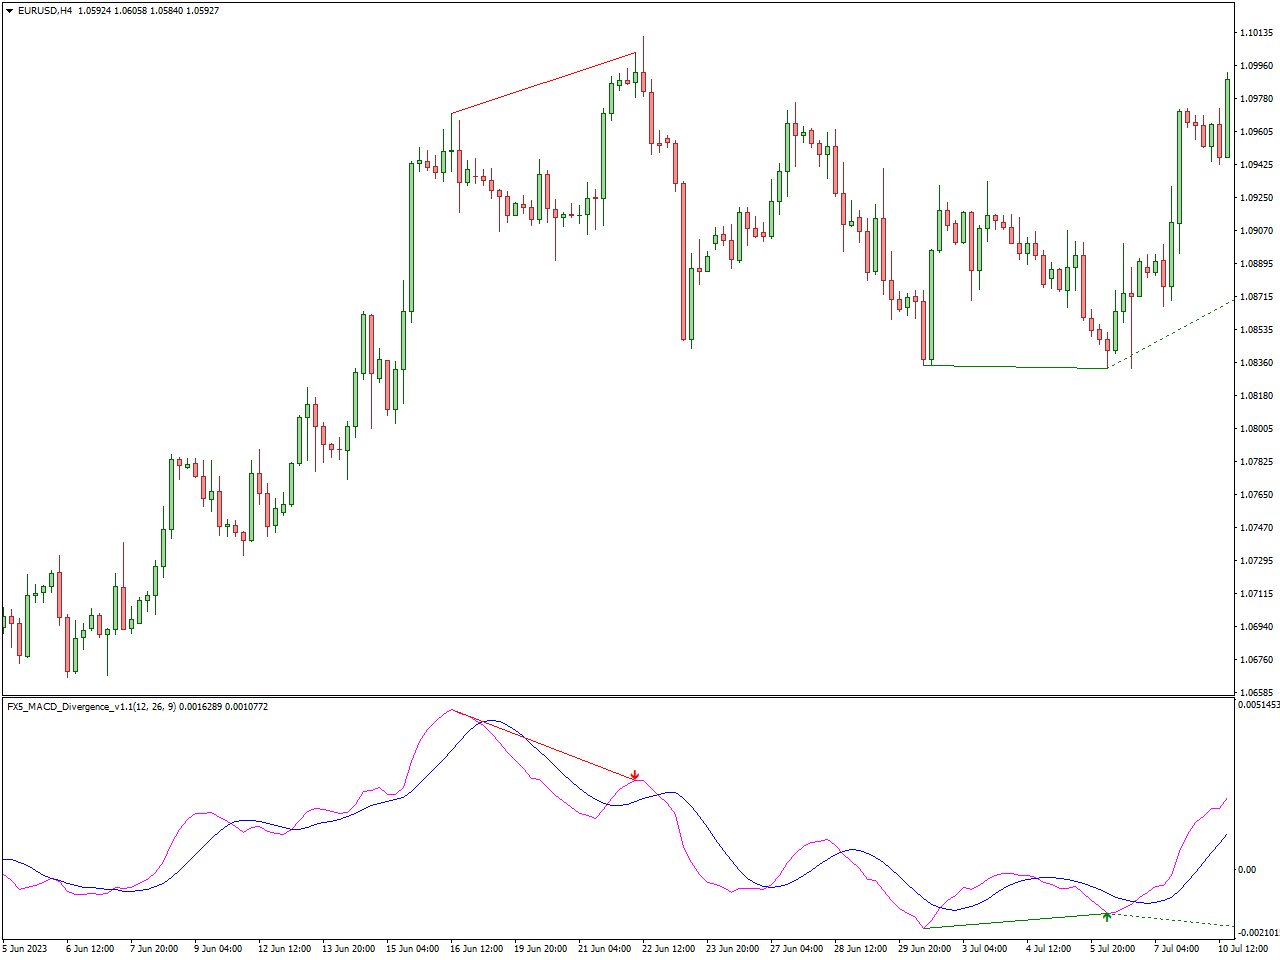
The FX5 MACD Divergence Indicator is a technical analysis tool used by traders in the foreign exchange (forex) market to identify potential divergences between the Moving Average Convergence Divergence (MACD) indicator and the price action of a currency pair. Divergence occurs when the MACD indicator and price movement move in opposite directions, suggesting a potential reversal or shift in market momentum.
The FX5 MACD Divergence Indicator is explicitly crafted to spot these divergences. As soon as it identifies a bullish or bearish divergence between the MACD indicator and price movements, it promptly displays visual signals on the price chart. These signals are valuable for traders in recognizing potential reversal points and facilitating well-informed trading choices.
Fibonacci Retracement Indicator
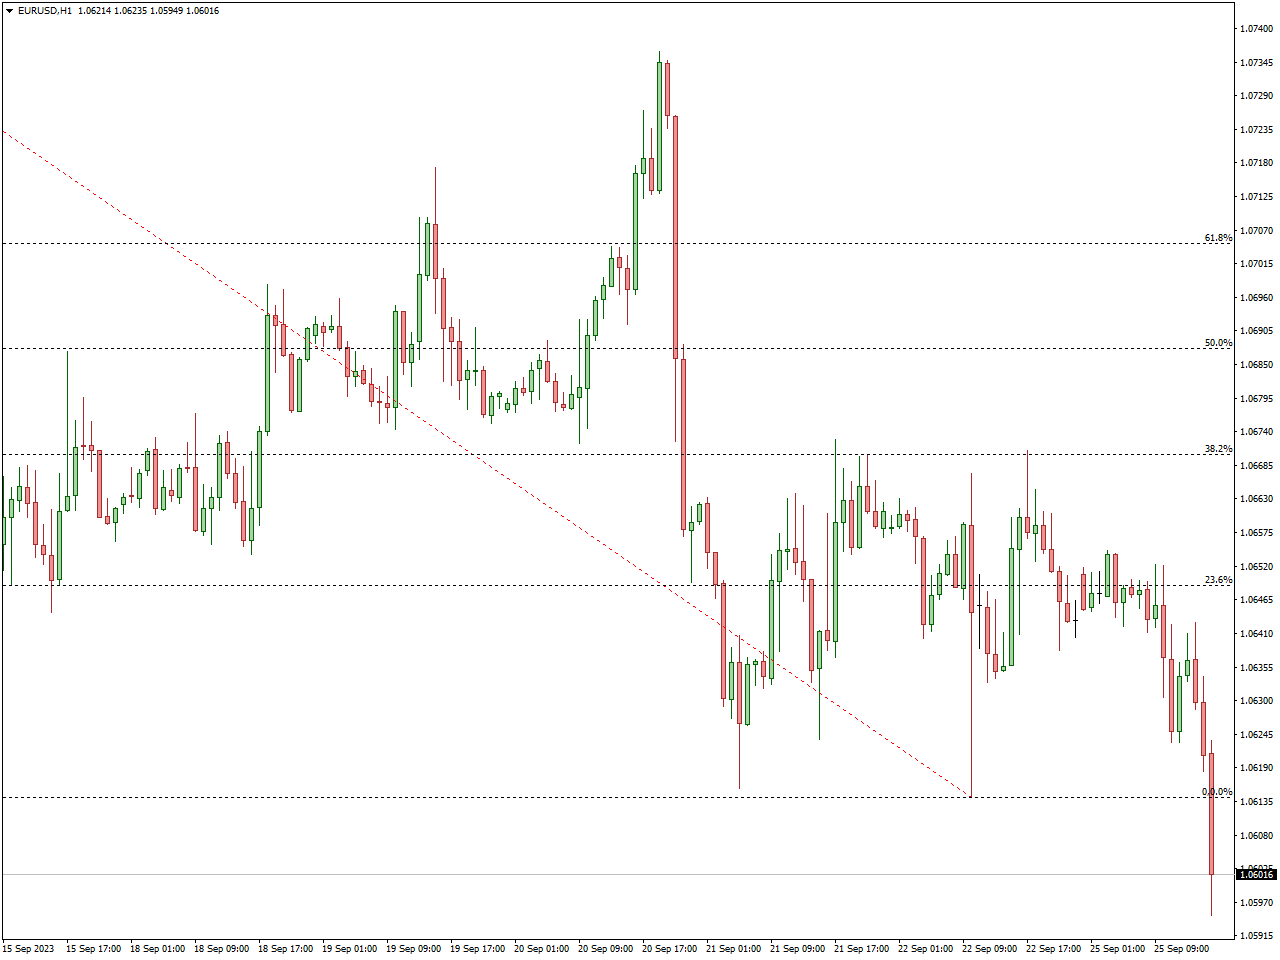
The Fibonacci Retracement Indicator is a frequently employed technical analysis instrument in financial markets, particularly the forex market. It derives its foundation from the Fibonacci sequence, a mathematical principle utilized in trading to pinpoint potential levels of support and resistance, along with price retracements.
This indicator computes and displays horizontal lines on the price chart corresponding to specific Fibonacci retracement levels. These levels are determined by the Fibonacci sequence and are frequently employed by traders to recognize significant price levels where price reversals or retracements could potentially take place.
Traders often use Fibonacci retracement levels in conjunction with other technical analysis tools, such as trendlines, moving averages, or candlestick patterns, to identify confluence zones where multiple factors suggest a potential reversal or continuation of the trend. This comprehensive approach to analysis can enhance the precision of trading decisions and help traders navigate the dynamic forex market with greater confidence.
Conlusion
In the world of scalping, precision is the name of the game, and the top 20 indicators we’ve explored in this guide are your keys to success. These indicators provide you with the edge you need to stay ahead of the curve.
As you embark on your scalping journey or refine your existing strategy, remember that practice and discipline are as crucial as the tools themselves. It’s not just about mastering the indicators; it’s about mastering yourself as a trader. Stick to your plan, manage your risk diligently, and continue learning and adapting.
With the right mindset and the power of these indicators at your fingertips, you can navigate the fast-paced world of scalping with confidence. Every tick, every pip, and every moment in the market becomes an opportunity. Now, armed with these top indicators, you have the tools to seize those opportunities and become a master of precision trading in the world of scalping.