

Navigating through the often-tricky terrain of sideways markets can be a daunting task for traders. These phases, where prices move within a relatively narrow range, can test even the most seasoned traders’ patience and strategy. However, armed with the right tools and knowledge, traders can not only survive but also thrive in such market conditions. In this comprehensive article, we unveil the top 20 indicators that will empower you to confidently navigate sideways markets. Whether you’re a beginner or an experienced trader, these indicators will provide you with the insights and strategies you need to make informed decisions and potentially profit even when the market seems to be treading water.
Top 20 indicators for swing trading
- MACD 2 Line Indicator
- Schaff Trend Cycle Indicator
- MACD 4C Indicator
- Advanced ADX Indicator
- Woodies CCI Arrows Oscillator Indicator
- Spearman Correlation Indicator
- TRIX Indicator
- Heiken Ashi Oscillator Indicator
- AO Divergence Indicator
- DAT MACD Indicator
- RSI Trend Catcher Signal Indicator
- FXSSI.TradingActivity
- Wave Trend Oscillator Indicator
- StochRSI Indicator
- Commodity Channel Index (CCI) Indicator
- Vortex Indicator
- FXSSI.OpenInterest
- Trend Arrow Indicator
- Synthetic VIX Indicator
- RSI 3TF Alert Indicator
MACD 2 Line Indicator
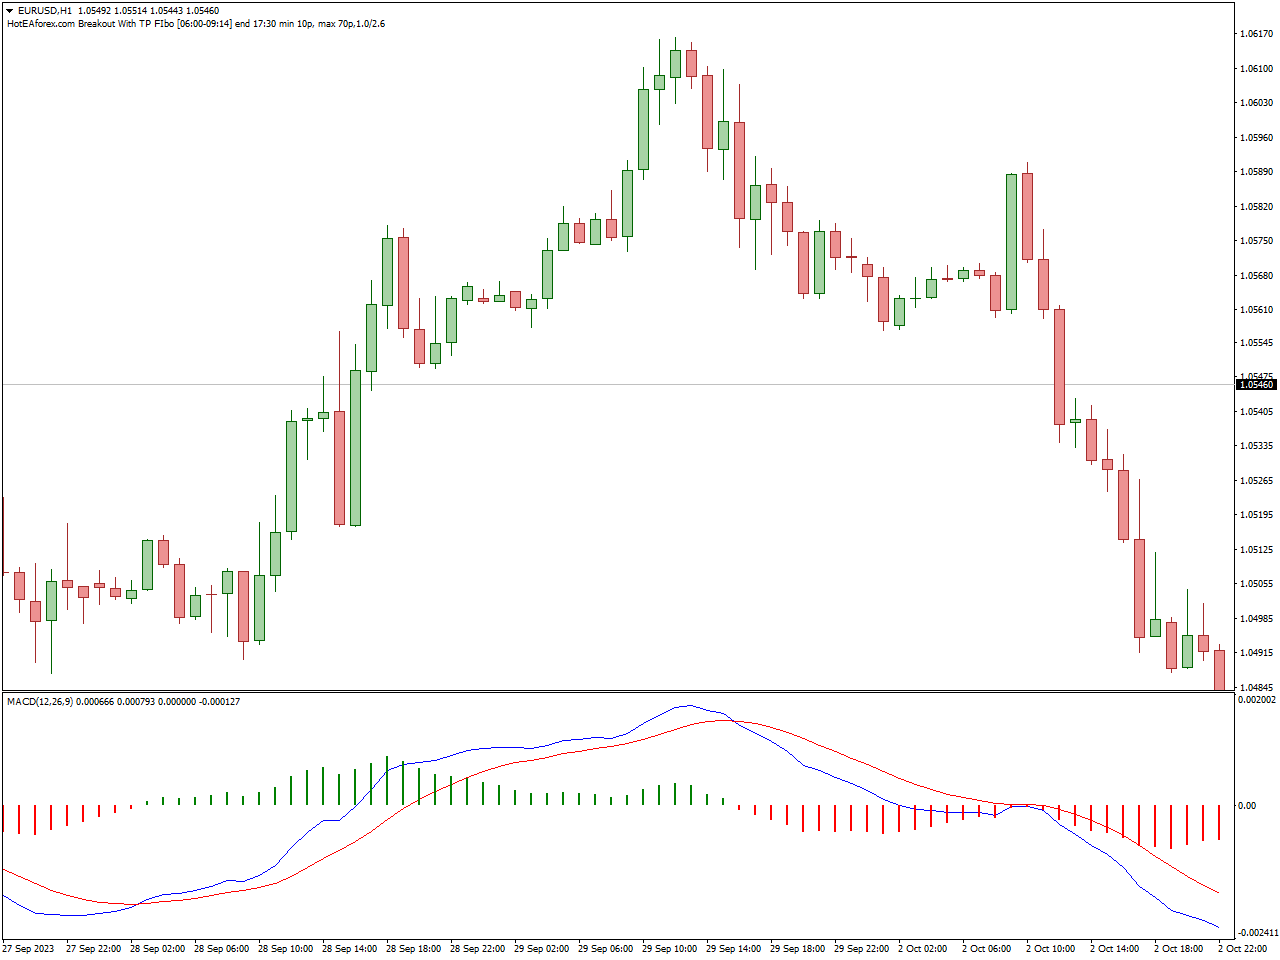
The MACD 2 Line Indicator is a widely adopted technical analysis tool applied in various financial markets, including stocks and forex, to aid traders in identifying potential trends, trend reversals, and alterations in market momentum. MACD, denoting Moving Average Convergence Divergence, stands as a prominent indicator highly regarded by traders and analysts alike. The MACD 2 Line Indicator represents a modification of the traditional MACD indicator, which typically encompasses three primary components: the MACD line, the signal line, and a histogram.
When the MACD line surpasses the signal line in an upward direction, it generates a bullish signal, suggesting the potential for upward momentum within the market. Conversely, when the MACD line crosses below the signal line, it produces a bearish signal, indicating the likelihood of downward momentum in the market. This occurrence of crossovers between the MACD line and the signal line constitutes a pivotal aspect of the MACD indicator, frequently employed by traders to pinpoint shifts in market sentiment and potential alterations in the trend’s direction.
Schaff Trend Cycle Indicator
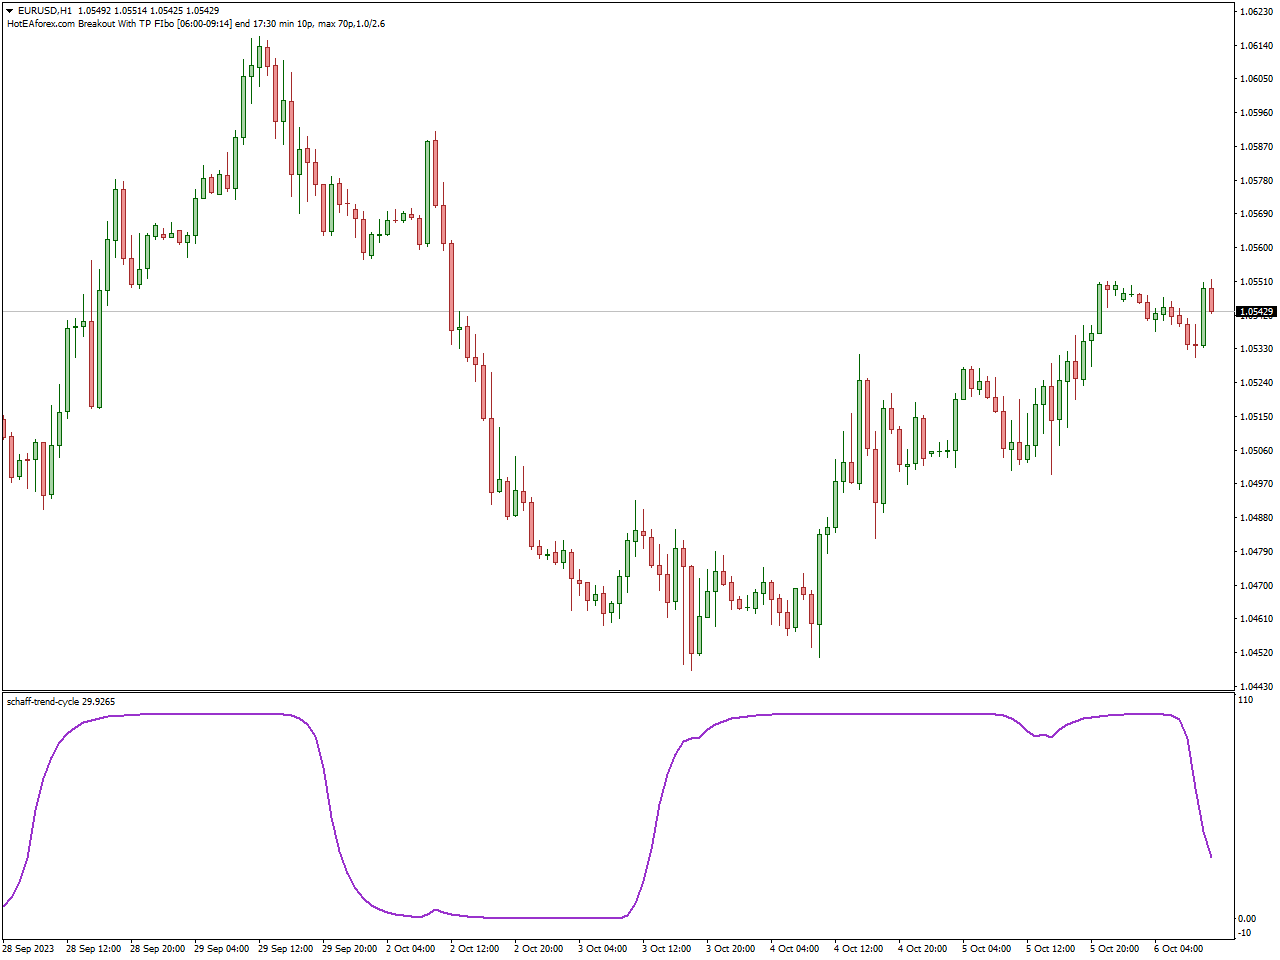
The Schaff Trend Cycle (STC) Indicator is a technical analysis tool used in financial markets, including the stock market and forex market, to identify potential trends and trend reversals. Developed by Doug Schaff, this indicator aims to provide a smoother and more responsive representation of market trends compared to traditional moving averages. The Schaff Trend Cycle Indicator is designed to help traders make more informed trading decisions.
The indicator is based on a complex mathematical formula that incorporates various inputs, including price data (often closing prices), short-term and long-term moving averages, and a smoothing factor. This calculation aims to filter out noise and provide a more accurate representation of trends.
One common trading signal generated by the Schaff Trend Cycle Indicator is the crossing of the signal line. When the indicator crosses above a certain threshold (e.g., 25 or 50), it can generate a bullish signal. Conversely, when it crosses below a specific level (e.g., 75), it can generate a bearish signal.
MACD 4C Indicator
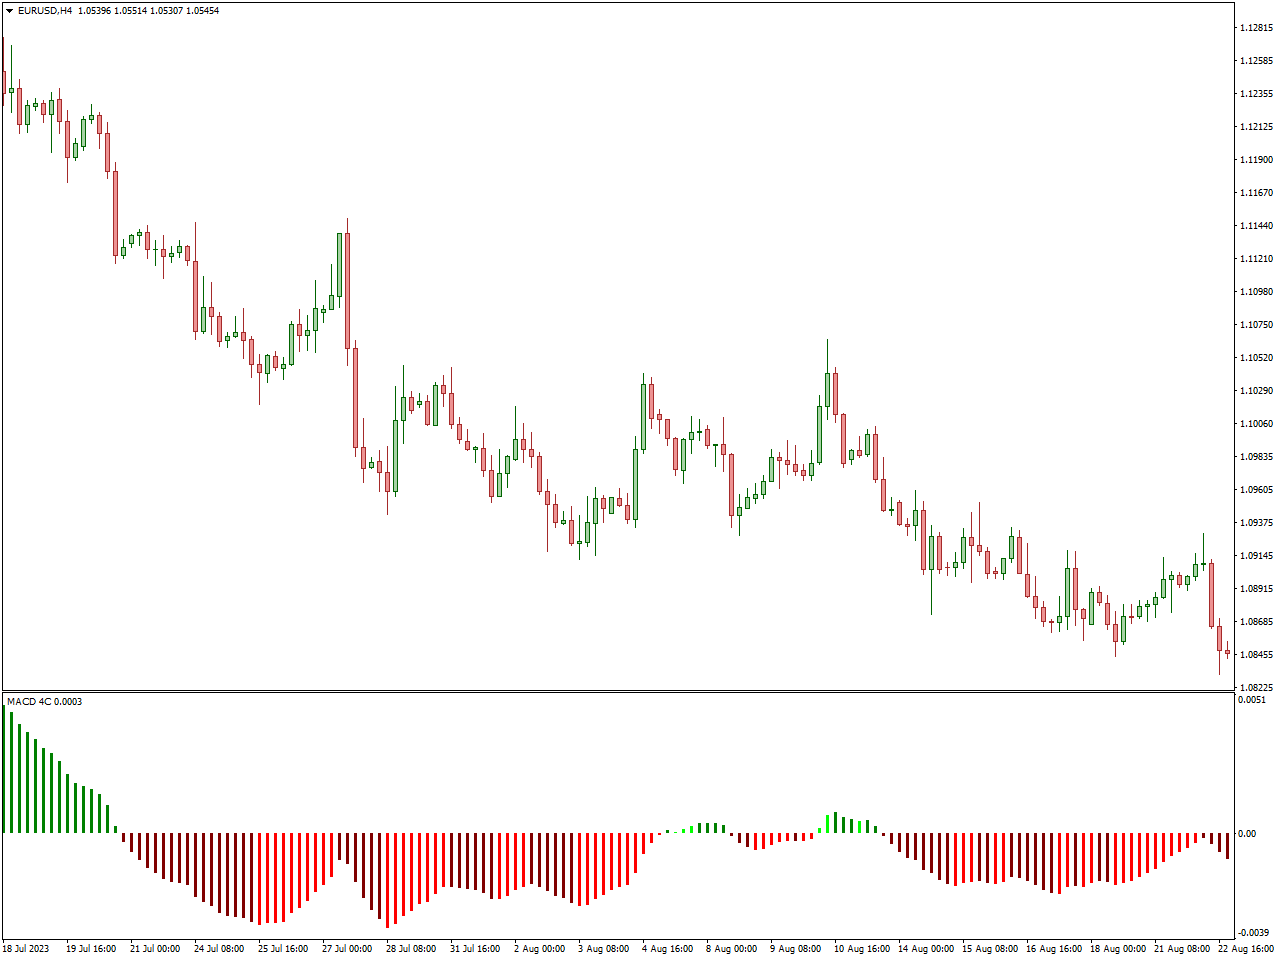
The MACD 4C Indicator is a technical analysis tool used in financial markets, including stocks, forex, and commodities, to help traders identify potential trends, trend reversals, and momentum shifts. MACD stands for Moving Average Convergence Divergence, and the “4C” in this indicator’s name refers to the inclusion of four distinct components within the MACD framework. These components provide traders with a more comprehensive view of market dynamics.
The MACD 4C Indicator introduces a central reference line, often referred to as the zero line or centerline, into the traditional MACD framework. Traders focus on crossovers that occur between the MACD line, the signal line, and this central line. Specifically, when the MACD line crosses above the centerline, it may indicate a transition from bearish to bullish momentum, potentially signaling a shift in market sentiment toward the positive. Conversely, when the MACD line crosses below the centerline, it can suggest a shift from bullish to bearish momentum, indicating a potential change in market sentiment toward the negative. These interactions with the centerline are critical components of the MACD 4C Indicator, helping traders identify shifts in market direction and momentum.
Advanced ADX Indicator
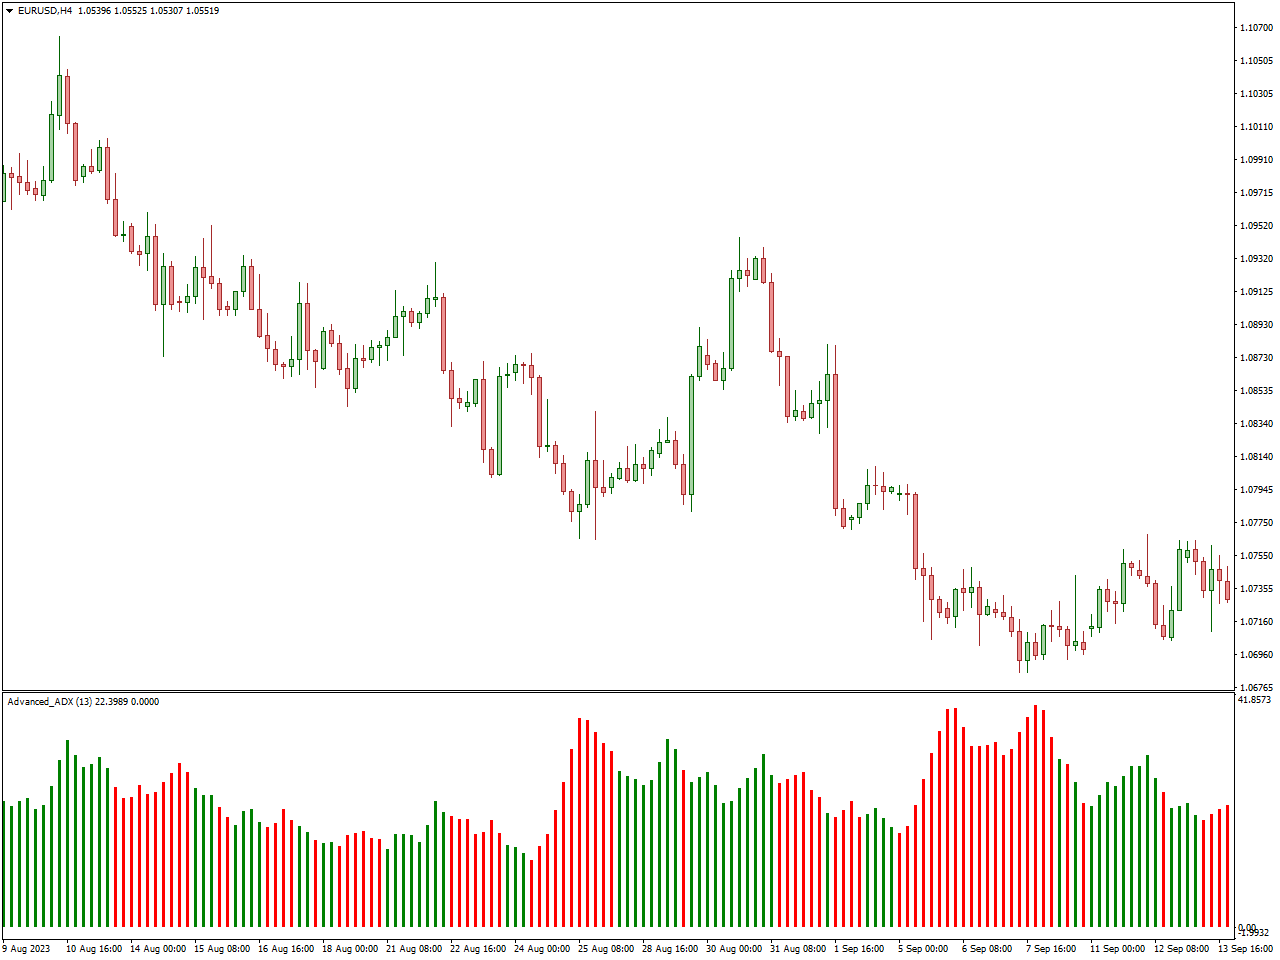
The Advanced ADX Indicator is a technical analysis tool used in financial markets, including stocks, forex, and commodities, to assess the strength and direction of a trend. ADX stands for Average Directional Index, and it is a popular indicator among traders and analysts. The “Advanced” version of the ADX indicator typically includes additional features or customizations to provide more insights into market trends.
The primary purpose of the Advanced ADX Indicator is to measure the strength of a trend. It does this by calculating a numerical value, often referred to as the ADX line, which ranges from 0 to 100. A higher ADX value indicates a stronger trend, while a lower value suggests a weaker or sideways market.
Some versions of the Advanced ADX Indicator include overbought and oversold levels (typically at 25 and 75). When the ADX rises above 25, it suggests that the market is in a trending phase, and when it surpasses 75, it may indicate an extremely strong trend. Traders watch for potential reversals when the ADX approaches these levels.
Woodies CCI Arrows Oscillator Indicator
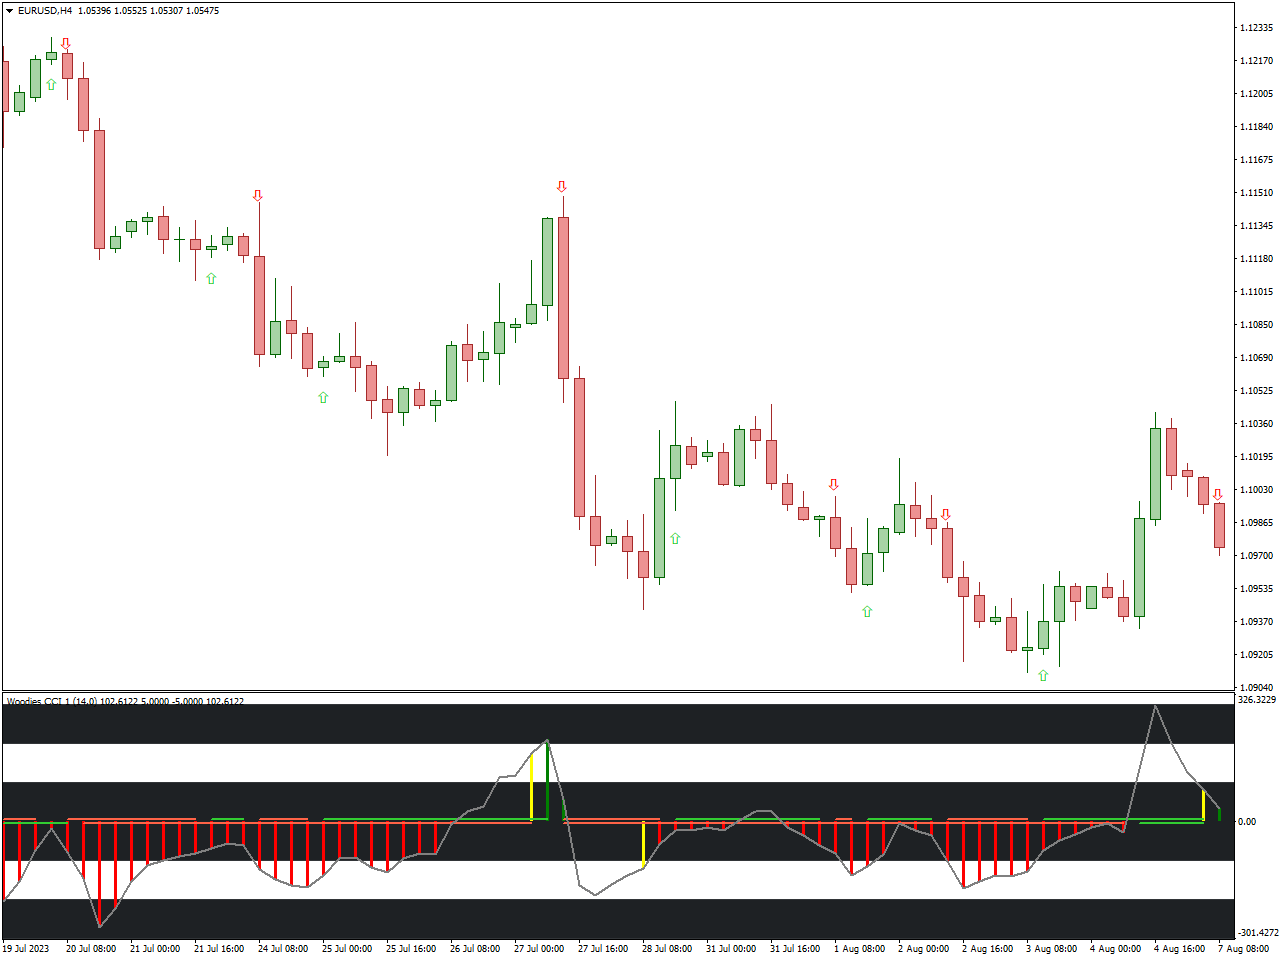
The Woodies CCI Arrows Oscillator Indicator is a valuable technical analysis instrument applied in financial markets, with a particular focus on forex trading. Its primary purpose is to aid traders in identifying potential trends and reversal points within the market. The foundation of this indicator lies in the Commodity Channel Index (CCI), which is a widely recognized momentum oscillator. The Woodies CCI Arrows Oscillator goes a step further by incorporating arrow signals into the traditional CCI, offering traders visual cues to assist in their decision-making process. These arrows serve as indicators of potential trend changes or reversal points, making it a valuable tool for traders seeking to navigate the dynamic forex market.
The foundation of this indicator is the CCI, which measures the difference between the typical price of an asset and its simple moving average (SMA), normalized by the mean absolute deviation. The CCI is typically calculated over a specified period, often 14 periods.
The indicator generates arrows based on the CCI’s movement. When the CCI crosses above a certain threshold, it may trigger a bullish (buy) arrow, signaling a potential uptrend. Conversely, when the CCI crosses below a threshold, it may generate a bearish (sell) arrow, indicating a potential downtrend.
Spearman Correlation Indicator
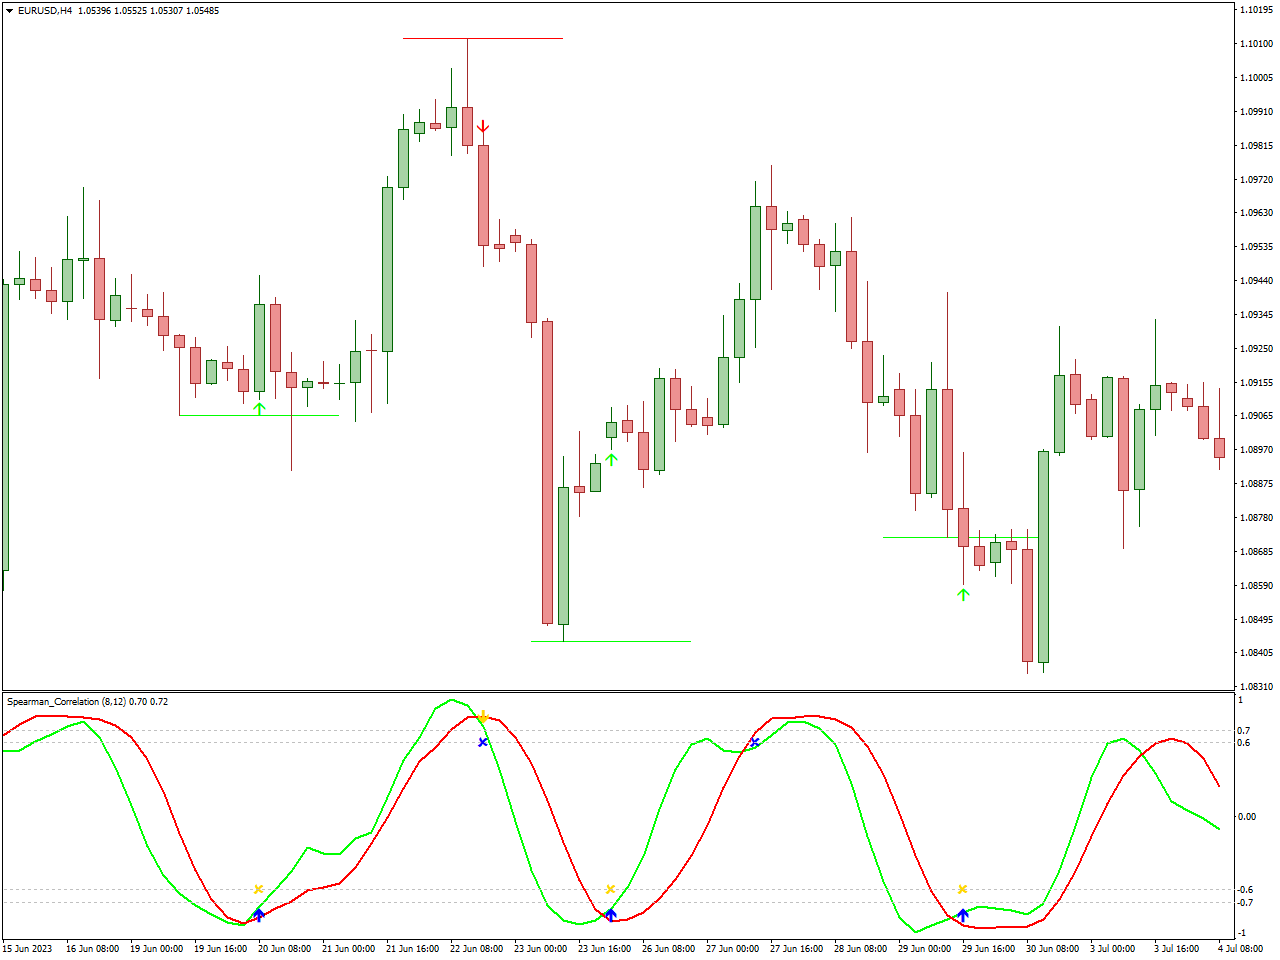
The Spearman Correlation Indicator is a statistical tool used in financial markets, including stocks, forex, and commodities, to measure the strength and direction of a relationship between two or more sets of data. This indicator is particularly useful for assessing the degree of correlation between the price movements of different assets or variables. Unlike the Pearson correlation coefficient, which measures linear relationships, the Spearman correlation evaluates non-linear relationships and is based on ranking the data.
Once the data is ranked, the Spearman correlation coefficient is computed by analyzing the differences between the ranks of corresponding data points in the two datasets. This coefficient quantifies how closely the ranks of data points correspond between the two sets
To evaluate whether the Spearman correlation coefficient is statistically significant, traders and analysts often employ statistical tests. These tests help determine whether the observed correlation is likely due to chance or if it signifies a meaningful relationship.
TRIX Indicator
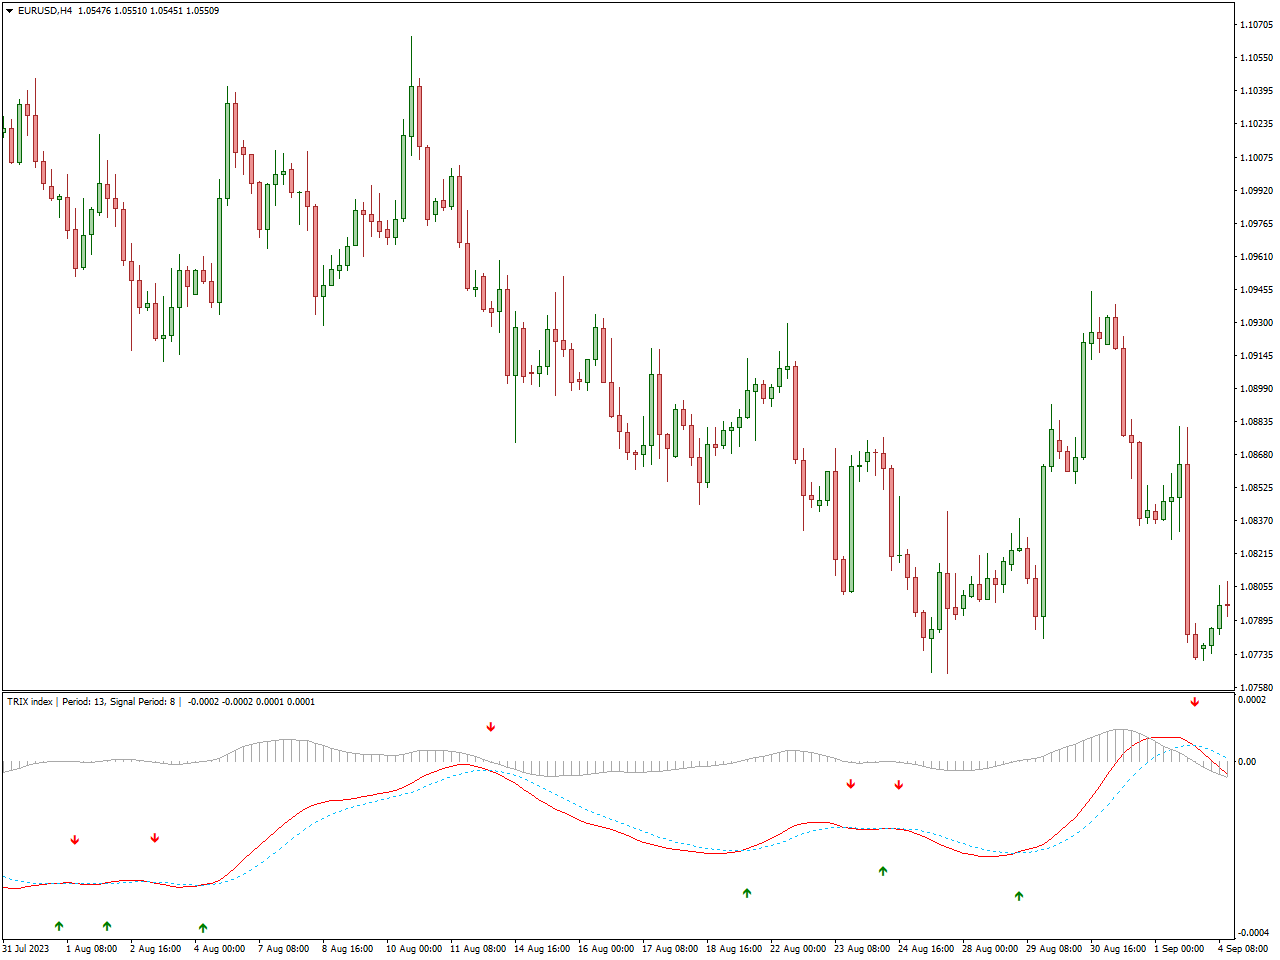
The TRIX Indicator, which stands for “Triple Exponential Average,” is a technical analysis tool used in financial markets, including stocks, forex, and commodities, to identify trends, gauge momentum, and generate trading signals. Unlike traditional moving averages, which are based on single or double smoothing, the TRIX Indicator employs triple smoothing to reduce noise and provide a more precise representation of price movements.
The TRIX Indicator begins by calculating three different exponential moving averages of the price data, typically closing prices. These EMAs are known as the 1-period, 2-period, and 3-period EMAs.
The TRIX Indicator features a crucial reference point known as the zero line. When the TRIX line crosses above this zero line, it generates a bullish signal, signifying the possibility of upward momentum in the market. Conversely, when the TRIX line crosses below the zero line, it generates a bearish signal, indicating the potential for downward momentum in the market. This interaction with the zero line serves as a key component of the TRIX Indicator, assisting traders in identifying shifts in market sentiment and potential trend changes.
Heiken Ashi Oscillator Indicator
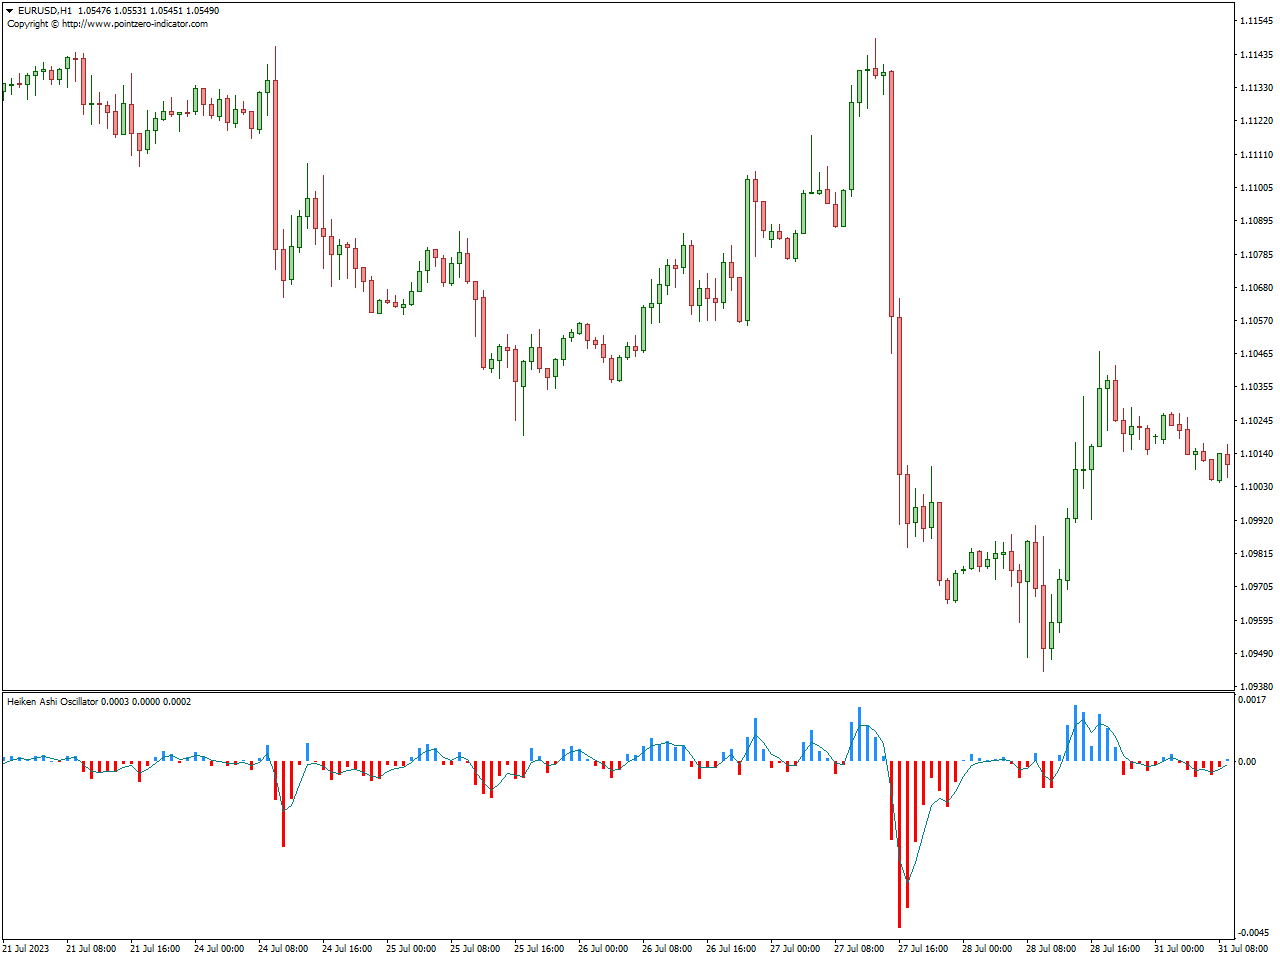
The Heiken Ashi Oscillator Indicator is a technical analysis tool used in financial markets, including stocks, forex, and commodities, to help traders identify trends, potential reversals, and market momentum. It is derived from the popular Heiken Ashi candlestick charting technique, which is designed to filter out market noise and present a smoother representation of price movements.
The indicator is based on Heiken Ashi candles, which are different from traditional candlesticks. Heiken Ashi candles use a modified formula to calculate their open, close, high, and low prices. These modified candles are designed to reduce noise and emphasize the underlying trend.
The indicator often includes a zero line. When the Heiken Ashi Oscillator crosses above the zero line, it generates a bullish signal, indicating potential upward momentum. Conversely, when it crosses below the zero line, it generates a bearish signal, suggesting potential downward momentum.
AO Divergence Indicator
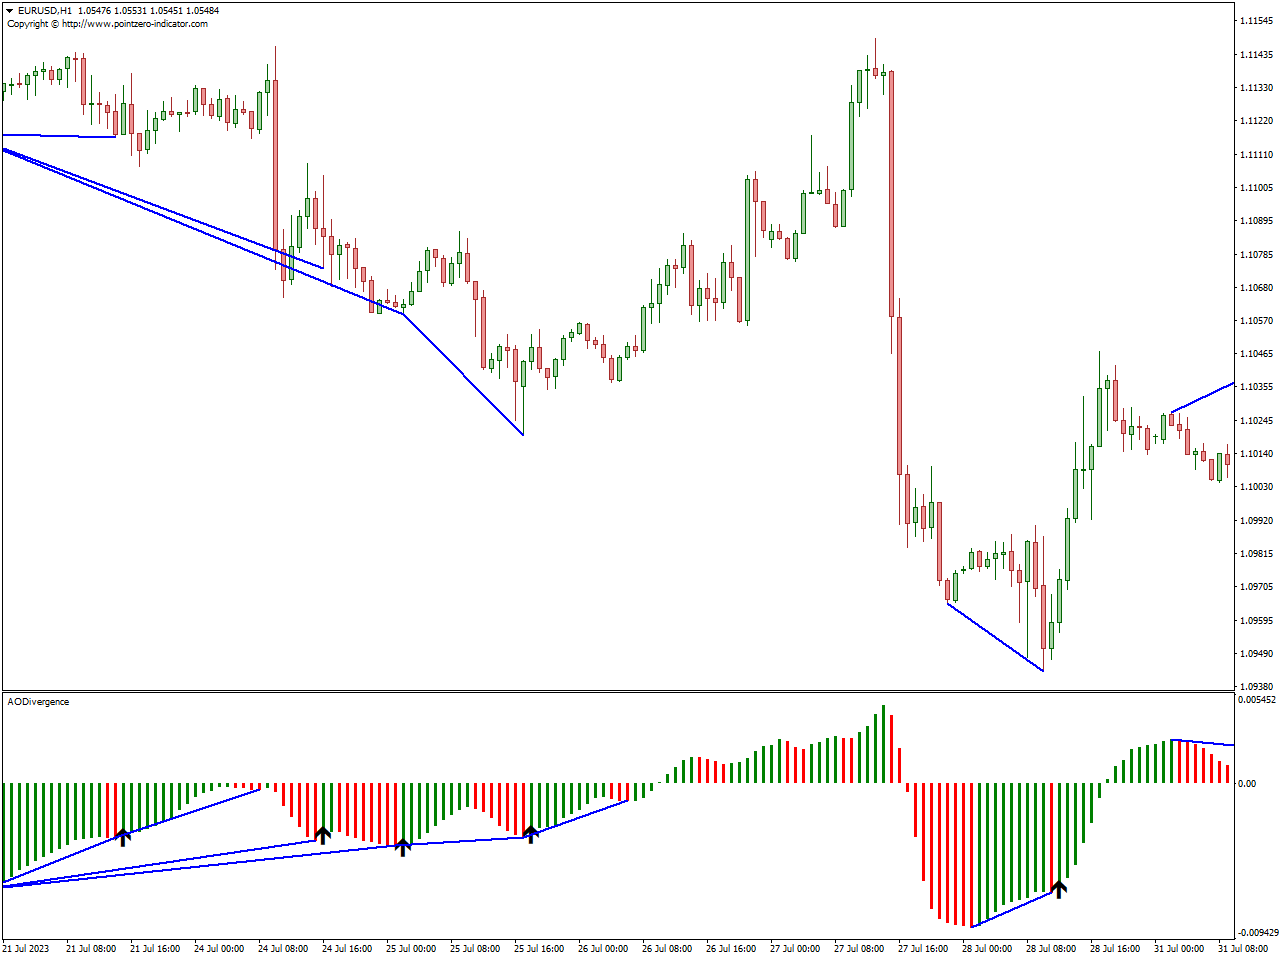
The AO Divergence Indicator, also known as the Awesome Oscillator Divergence Indicator, is a technical analysis tool used by traders in financial markets, including stocks, forex, and commodities. It is designed to identify divergences between the Awesome Oscillator (AO) and the price action of an asset. Divergence occurs when there is a disparity between the oscillator and price movements, potentially signaling a trend reversal or a change in momentum.
The AO Divergence Indicator monitors the Awesome Oscillator and compares it to the price chart of the asset being analyzed. It looks for situations where the oscillator and price action are moving in opposite directions.
The AO Divergence Indicator generates visual signals on the price chart when bullish or bearish divergences are detected. These signals can help traders identify potential entry or exit points for their trades.
DAT MACD Indicator
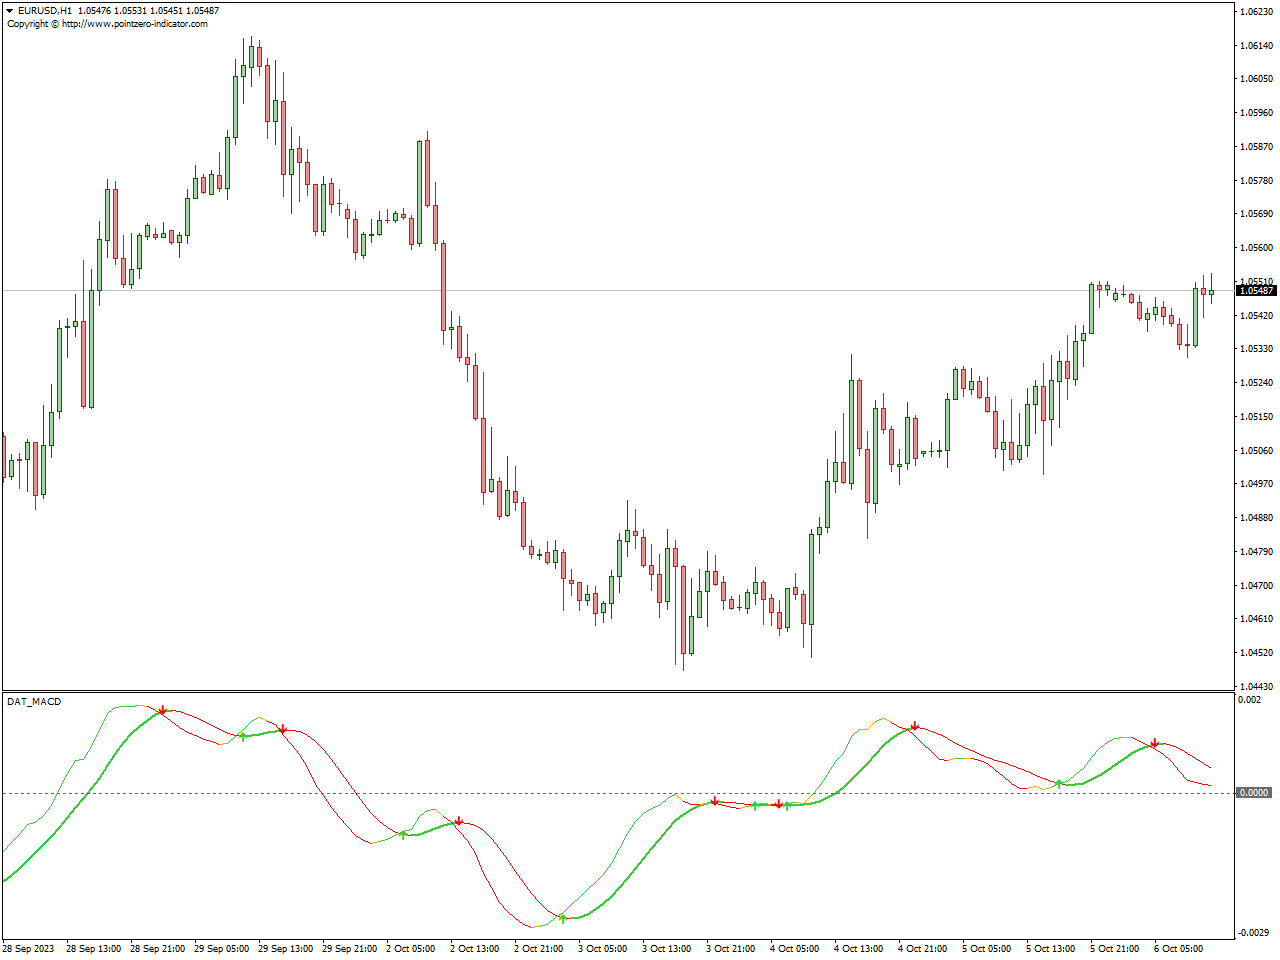
The DAT (Divergence and Trend) MACD Indicator is a technical analysis tool that merges the MACD indicator with the trend identification features of the DAT oscillator.
This indicator, the DAT MACD, serves the purpose of spotting divergences between price movements and the MACD line, a phenomenon that can indicate potential reversals in trends or validate ongoing trends. The DAT MACD is visually represented as a histogram, with either an upward or downward inclination, providing insights into positive or negative momentum.
RSI Trend Catcher Signal Indicator
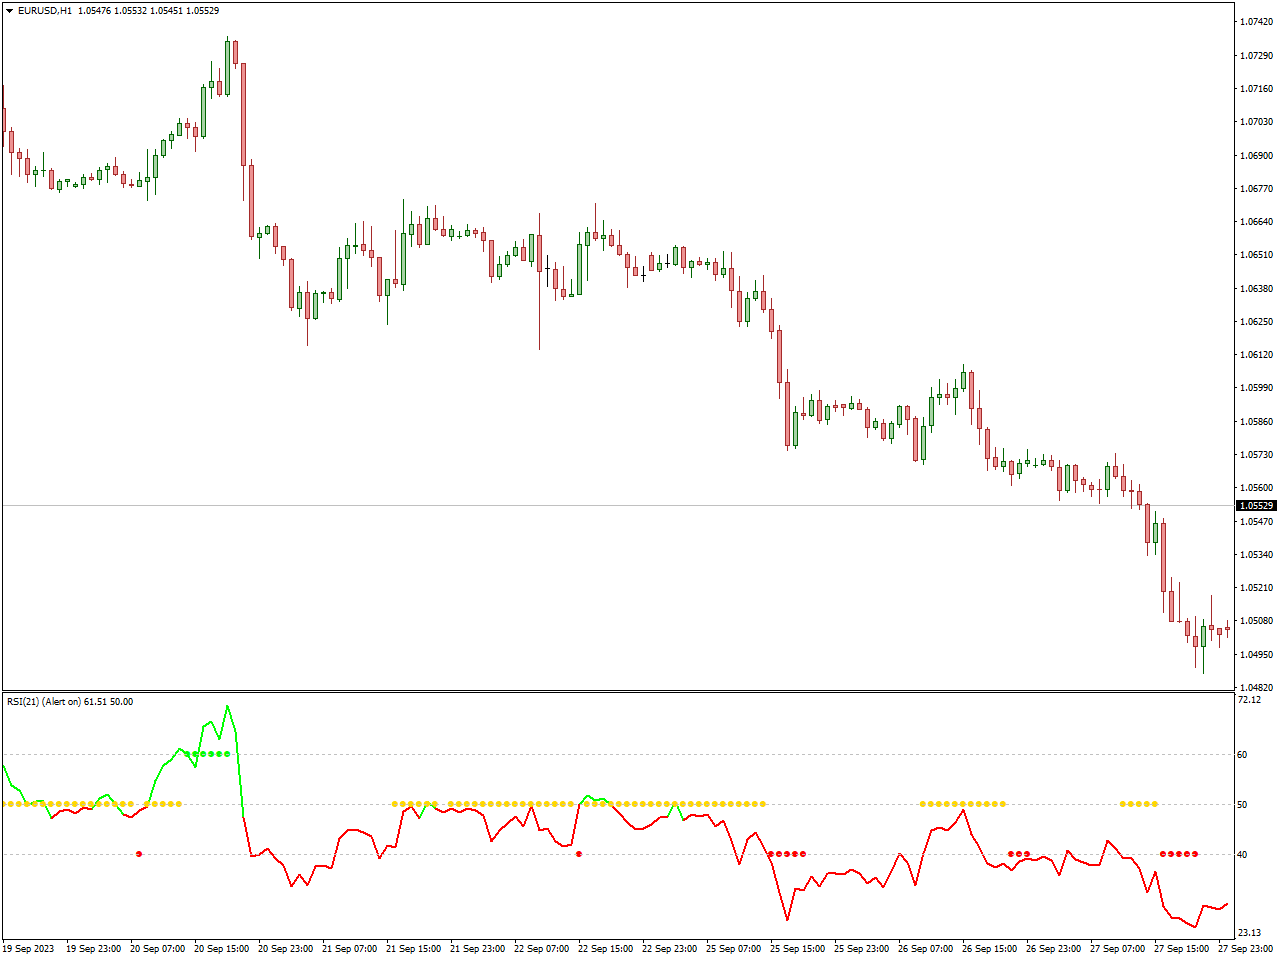
The RSI Trend Catcher Signal Indicator is a technical analysis tool used by traders in various financial markets, including stocks and forex, to identify potential trend reversals and trend continuation opportunities based on the Relative Strength Index (RSI).
The RSI Trend Catcher Signal Indicator generates buy and sell signals based on RSI conditions. These signals often focus on specific RSI levels or crossovers. For example, it may produce a buy signal when the RSI crosses above 30 (indicating potential upward momentum) and a sell signal when it crosses below 70 (indicating potential downward pressure).
Besides overbought and oversold conditions, the RSI Trend Catcher Signal Indicator can help traders identify potential trends in the market. For instance, a sustained RSI value above 50 might suggest a bullish trend, while a value below 50 might indicate a bearish trend.
FXSSI.TradingActivity
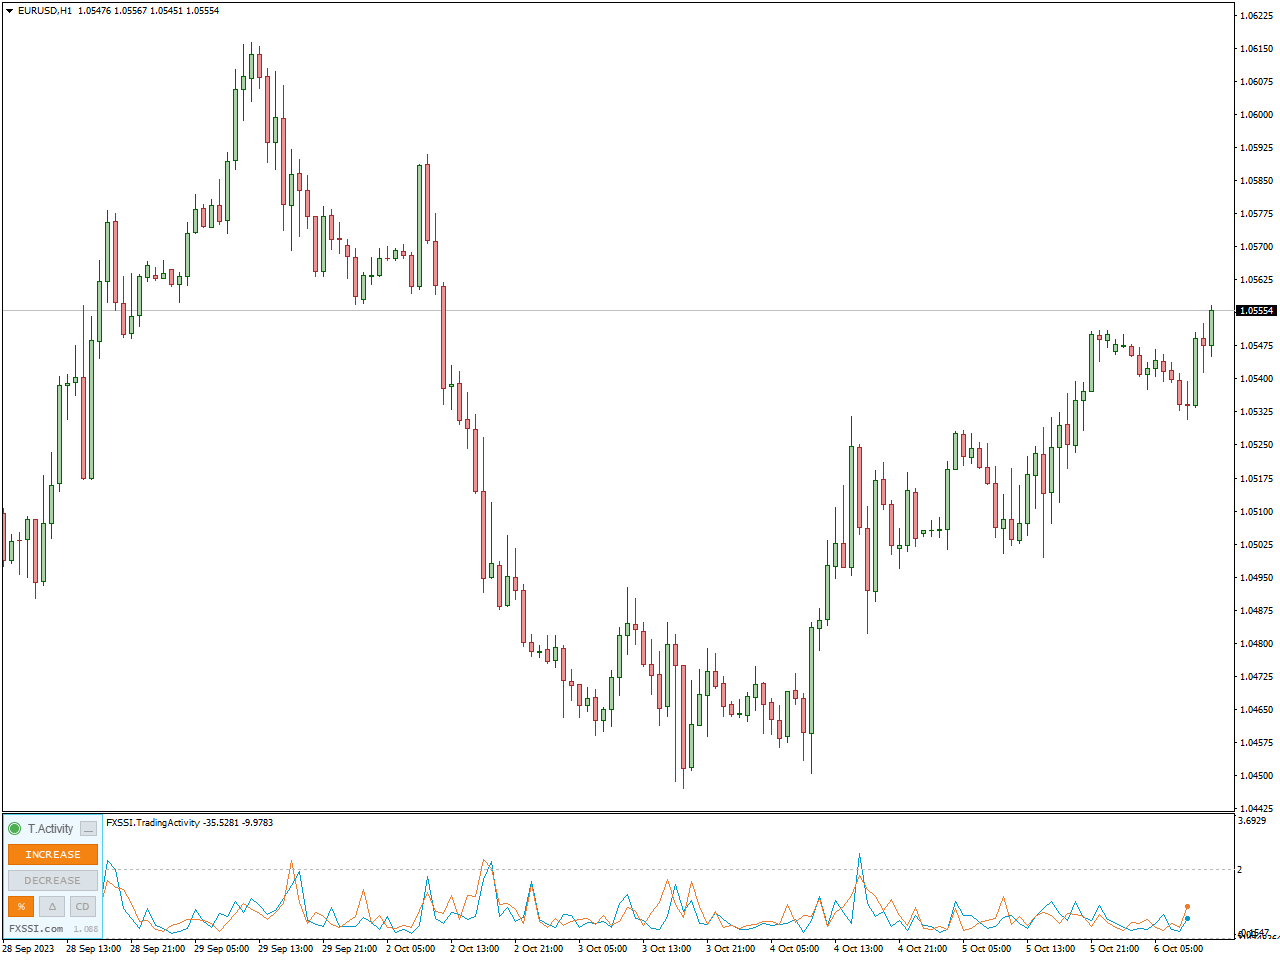
TradingActivity is an indicator that illustrates shifts in the composition of sellers and buyers, offering insights into the number of sellers and buyers who initiated or concluded trades during the preceding time frame.
The beauty of this indicator lies in its simplicity; it can be employed without the need for intricate adjustments. You can readily apply it, and the only decision you need to make is selecting a color scheme that suits your personal preferences.
The FXSSI.TradingActivity Indicator is a robust instrument for traders aiming to assess market sentiment and make well-informed decisions rooted in trading activity. By grasping its underlying principles, functionality, and how to interpret its signals, traders can harness the potential of this forex indicator to refine their trading approaches. It’s crucial to complement the FXSSI.TradingActivity Indicator with other technical analysis tools and fundamental insights to craft a comprehensive trading strategy.
Wave Trend Oscillator Indicator
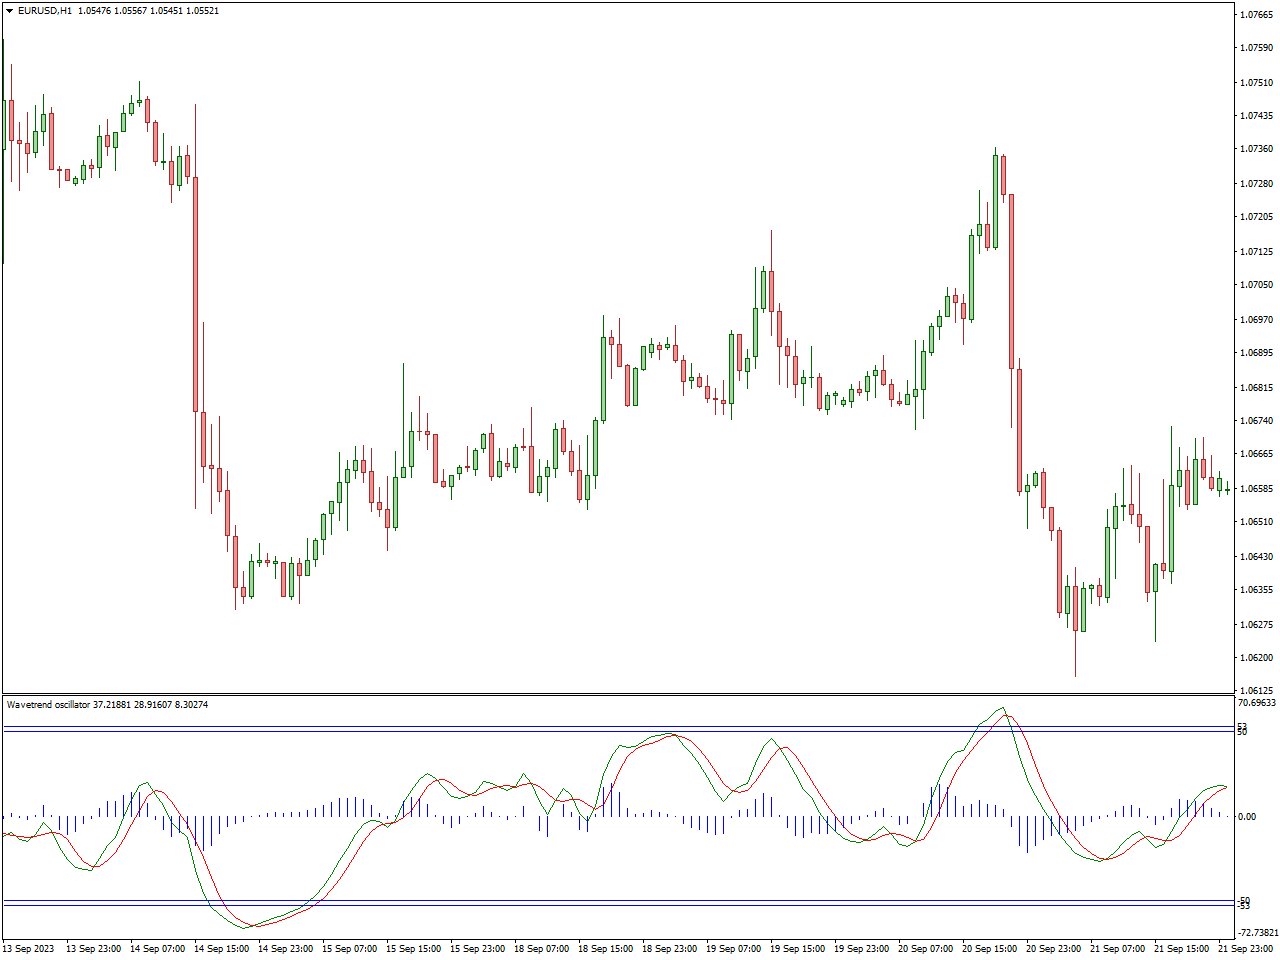
The Wave Trend Oscillator Indicator is a technical analysis tool used by traders in financial markets, including stocks, forex, and commodities, to identify trends, potential reversals, and overbought or oversold conditions. This oscillator combines elements of trend-following and momentum indicators to provide insights into market dynamics.
The Wave Trend Oscillator often includes overbought and oversold levels, typically set at certain threshold values. When the oscillator crosses above the overbought level, it suggests that the asset may be overextended on the upside and could be due for a pullback. Conversely, when it crosses below the oversold level, it implies that the asset may be oversold and could potentially rebound.
Traders employ the Wave Trend Oscillator to pinpoint trading signals. For instance, when the faster Wave line crosses above the slower Trend line, it produces a bullish signal, implying the potential for upward momentum. Conversely, when the Wave line crosses beneath the Trend line, it generates a bearish signal, signifying the possibility of downward momentum in the market.
StochRSI Indicator
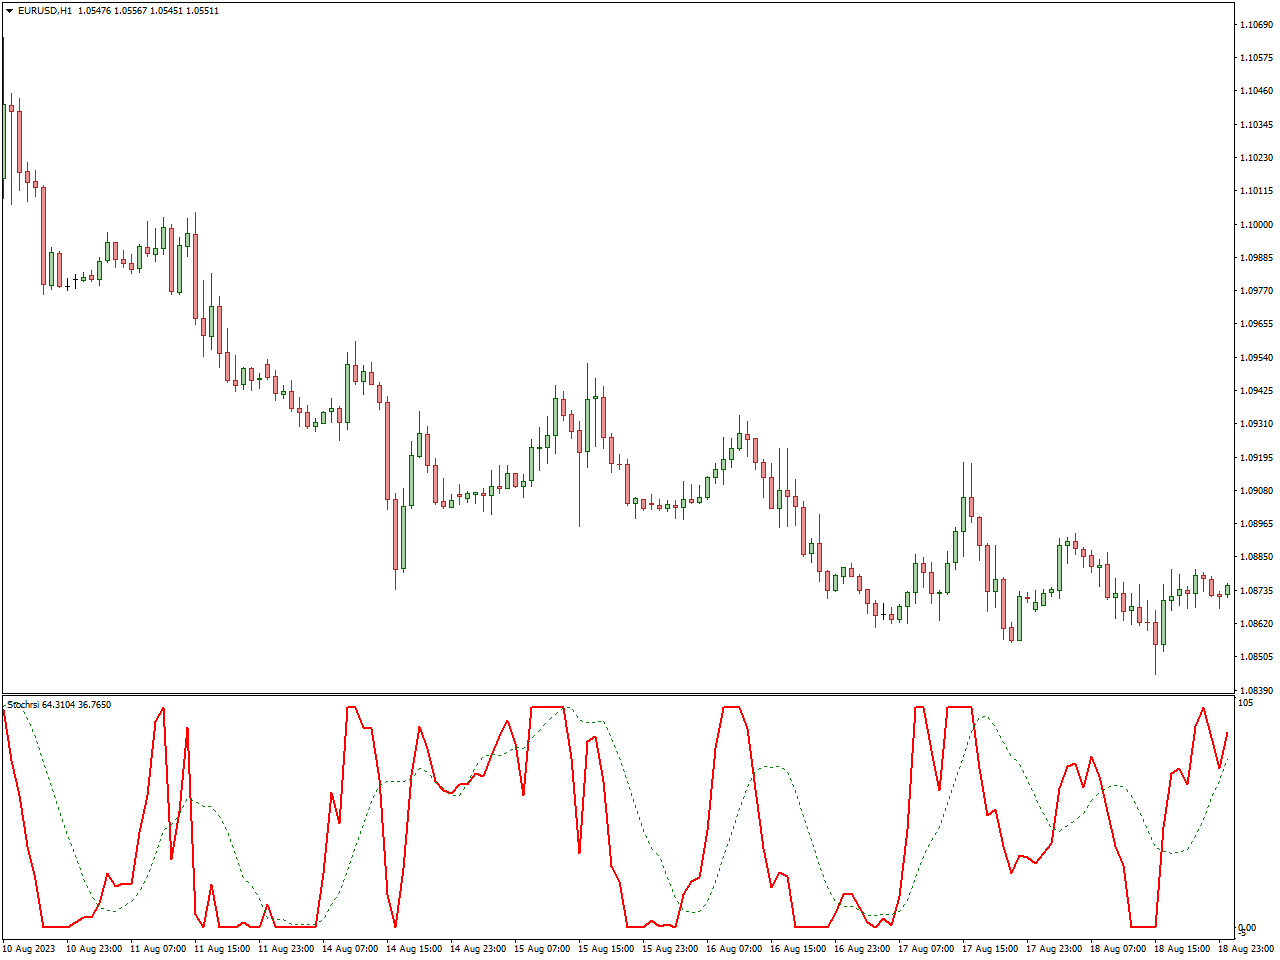
The StochRSI Indicator serves as a technical analysis instrument that combines two widely recognized indicators: the Relative Strength Index (RSI) and the Stochastic Oscillator. Traders in various financial markets, including stocks, forex, and commodities, utilize it for several purposes. These include identifying overbought and oversold conditions, potentially spotting trend reversals, and generating trading signals. This indicator provides traders with valuable insights into market conditions, aiding them in making informed trading decisions.
The StochRSI combines these two indicators by applying the Stochastic Oscillator formula to the RSI values rather than price data. This results in an oscillator that moves within a range, often between 0 and 100, similar to both the RSI and the Stochastic Oscillator.
Traders look for specific StochRSI crossovers and divergences as signals. For example, when the StochRSI crosses above 20, it may generate a bullish signal, indicating potential upward momentum. Conversely, when it crosses below 80, it may generate a bearish signal, suggesting potential downward momentum.
Commodity Channel Index (CCI) Indicator
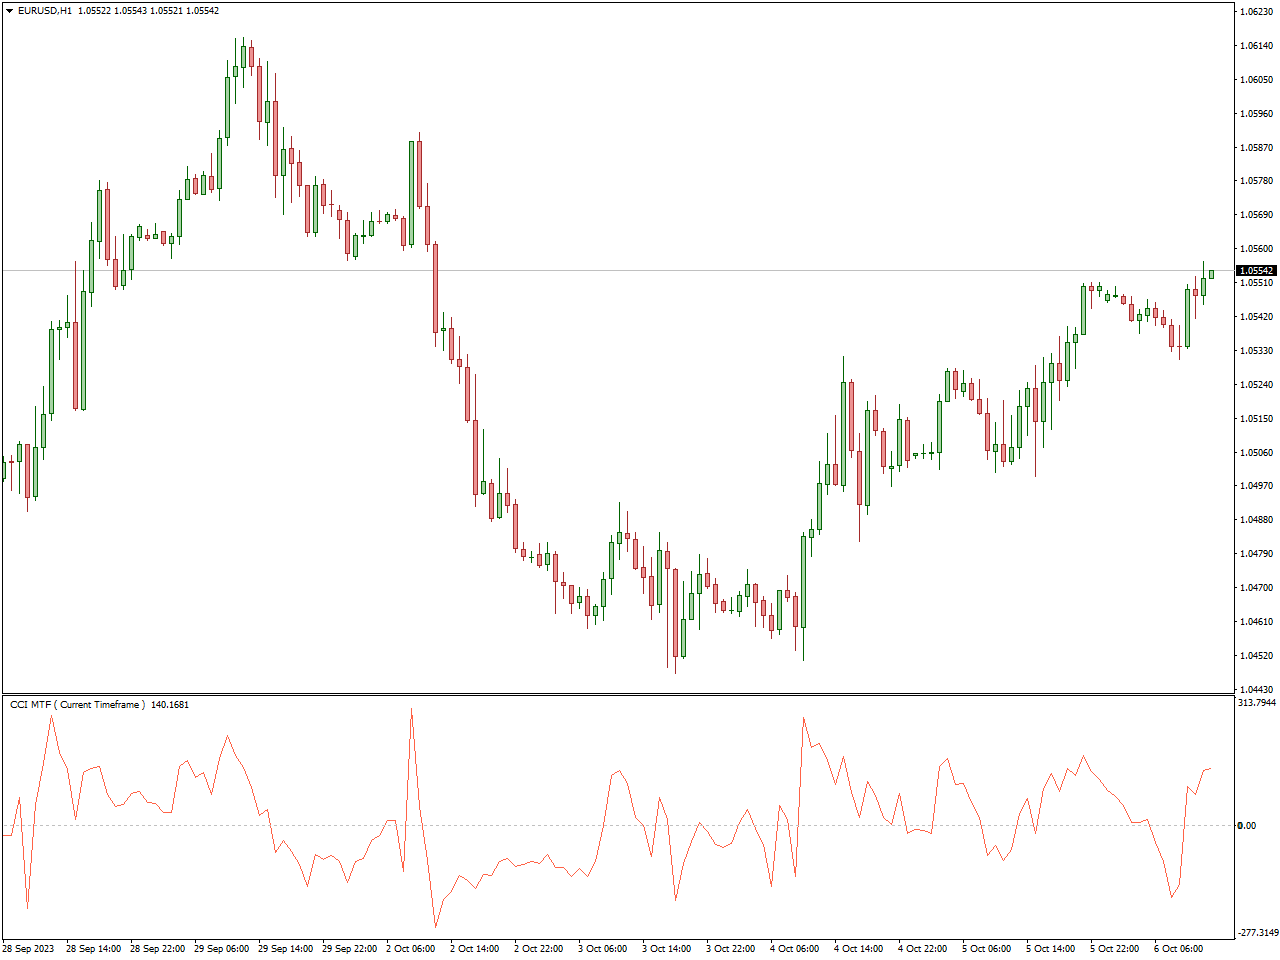
The Commodity Channel Index (CCI) Indicator is a widely used technical analysis tool designed to assess the cyclical variations in an asset’s price. Developed by Donald Lambert, the CCI Indicator is primarily used in financial markets, including stocks, commodities, and forex, to identify potential overbought and oversold conditions, as well as to detect the beginning or ending of trends.
The CCI values typically oscillate around a baseline, often set at zero. Values above zero indicate that the asset’s price is above the historical average, suggesting potential bullish momentum. Conversely, values below zero indicate that the price is below the historical average, suggesting potential bearish momentum.
Traders look for specific CCI crossovers and divergences as signals. For instance, when the CCI crosses above +100, it may generate a bearish signal, indicating potential downward pressure. Conversely, when it crosses below -100, it may generate a bullish signal, suggesting potential upward pressure.
Vortex Indicator
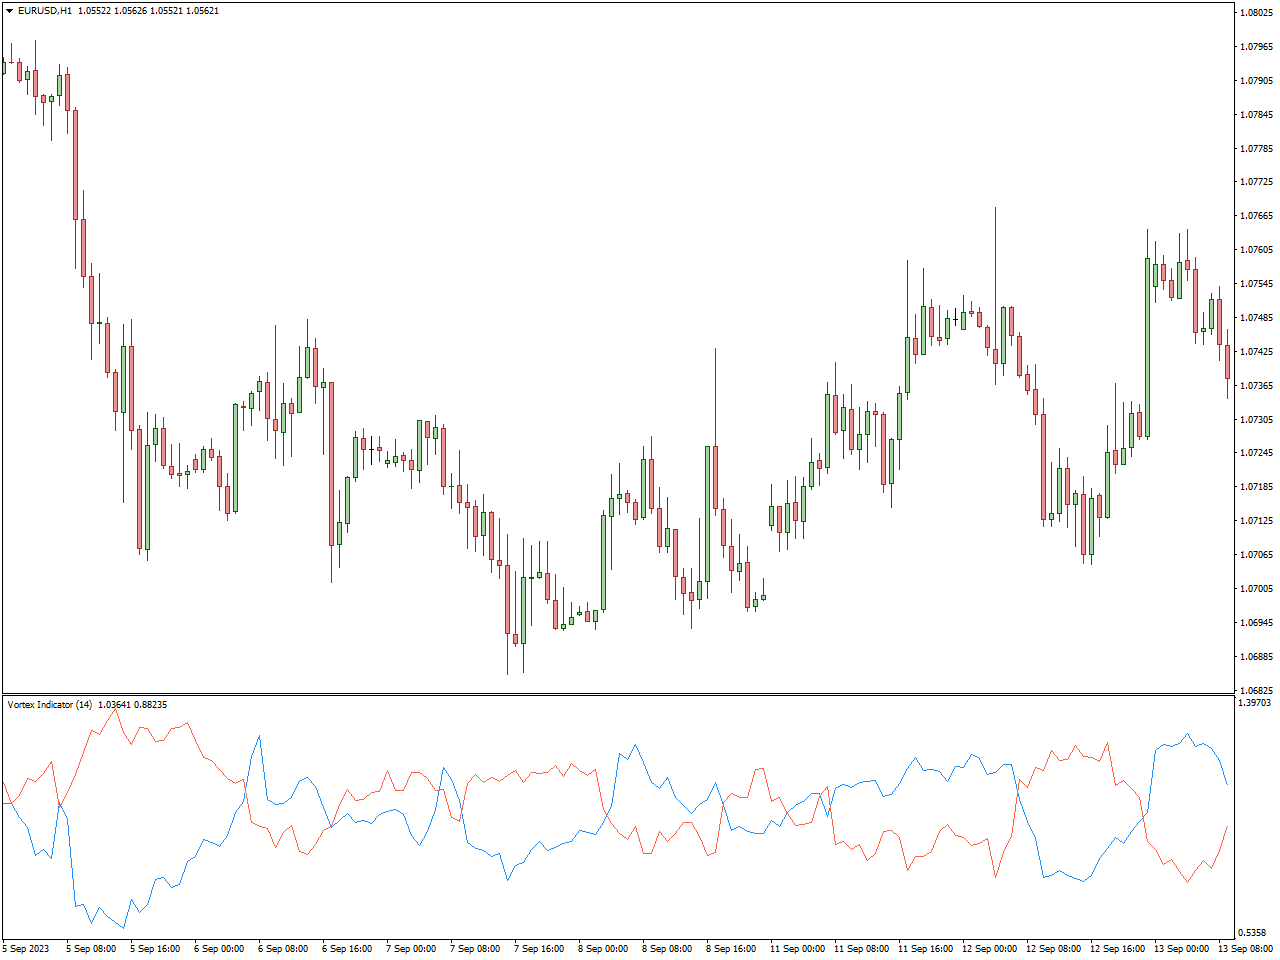
The Vortex Indicator is a technical analysis tool used by traders in financial markets, including stocks, forex, and commodities, to identify trends, potential reversals, and market volatility. It was developed by Etienne Botes and Douglas Siepman and is designed to provide insights into the direction and strength of a trend.
Traders use the Vortex Indicator to identify potential trends and reversals. When the VI+ line crosses above the VI- line, it may suggest the beginning of an uptrend. Conversely, when the VI- line crosses above the VI+ line, it may indicate the start of a downtrend.
The Vortex Indicator provides insights into trend direction and market volatility. It’s particularly useful for identifying trends in sideways markets where other indicators might be less effective. Traders often use it in conjunction with other technical analysis tools to confirm signals and make informed trading decisions.
FXSSI.OpenInterest
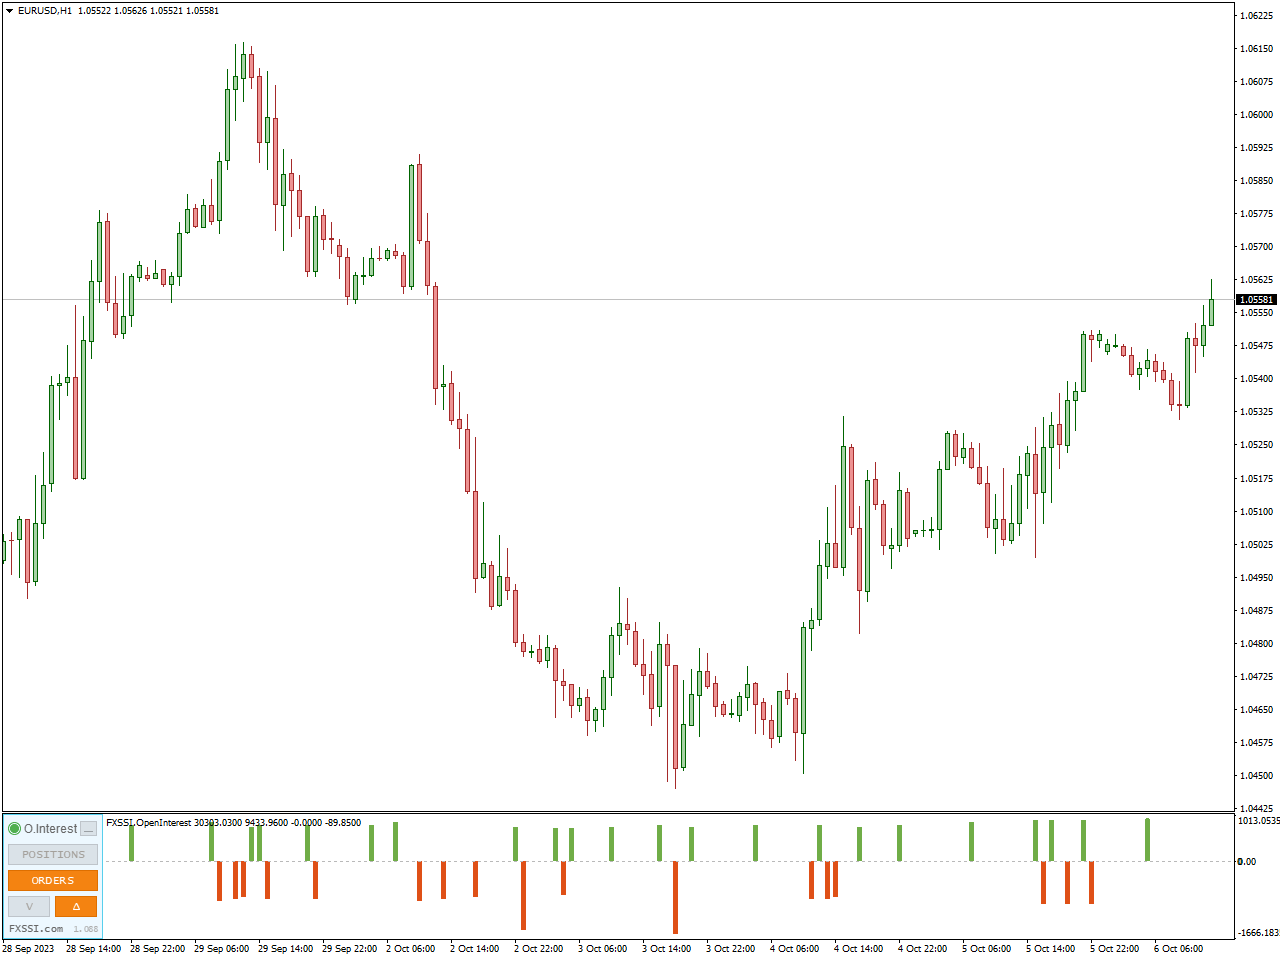
The FXSSI.OpenInterest Indicator stands as a formidable technical analysis instrument, purposefully crafted to assist traders in tracking and dissecting open interest data within the Forex market. This cutting-edge forex indicator serves as a valuable resource for gaining insights into market sentiment, empowering traders to make decisions rooted in information and tailor their trading strategies accordingly.
The FXSSI.OpenInterest Indicator operates by consolidating open interest data from diverse sources, including exchange-traded derivatives and over-the-counter markets. Subsequently, this indicator presents the open interest information in a distinct window positioned below the price chart. This visual depiction serves as a valuable tool for traders, enabling them to gain insights into market sentiment and make more informed trading decisions.
Trend Arrow Indicator
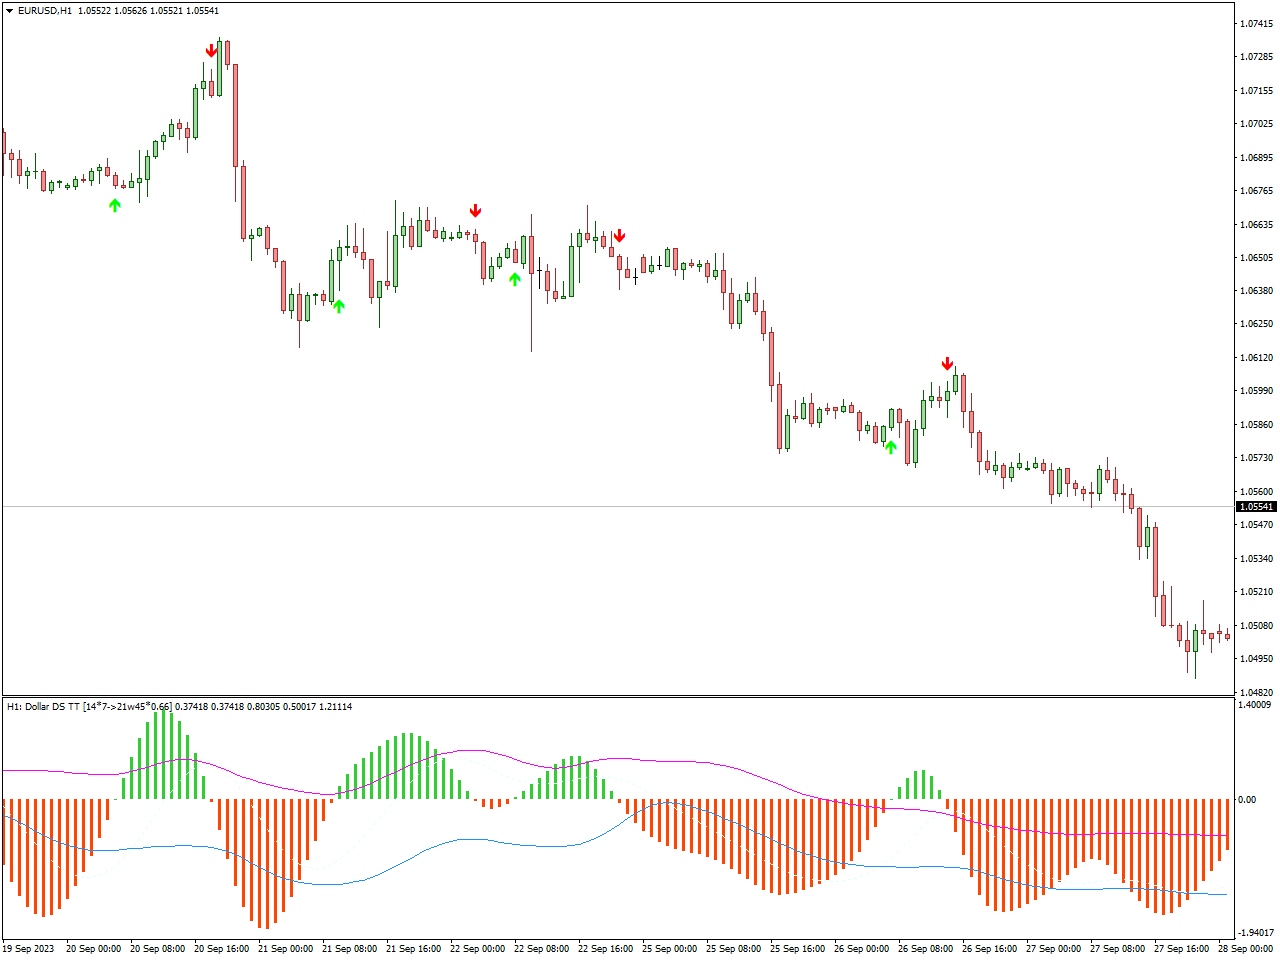
The Trend Arrow Indicator is a technical analysis tool used by traders in financial markets, including stocks, forex, and commodities, to identify and visualize trends in asset prices. This indicator helps traders understand the direction and strength of a trend by displaying arrows on the price chart. Each arrow typically represents a potential trend reversal or continuation signal.
When the indicator detects a significant shift in the trend direction, it plots an arrow on the price chart.
Traders often use the arrow signals as a basis for their trading decisions. They may seek confirmation from other technical indicators, such as moving averages or oscillators, before entering or exiting a trade.
Synthetic VIX Indicator
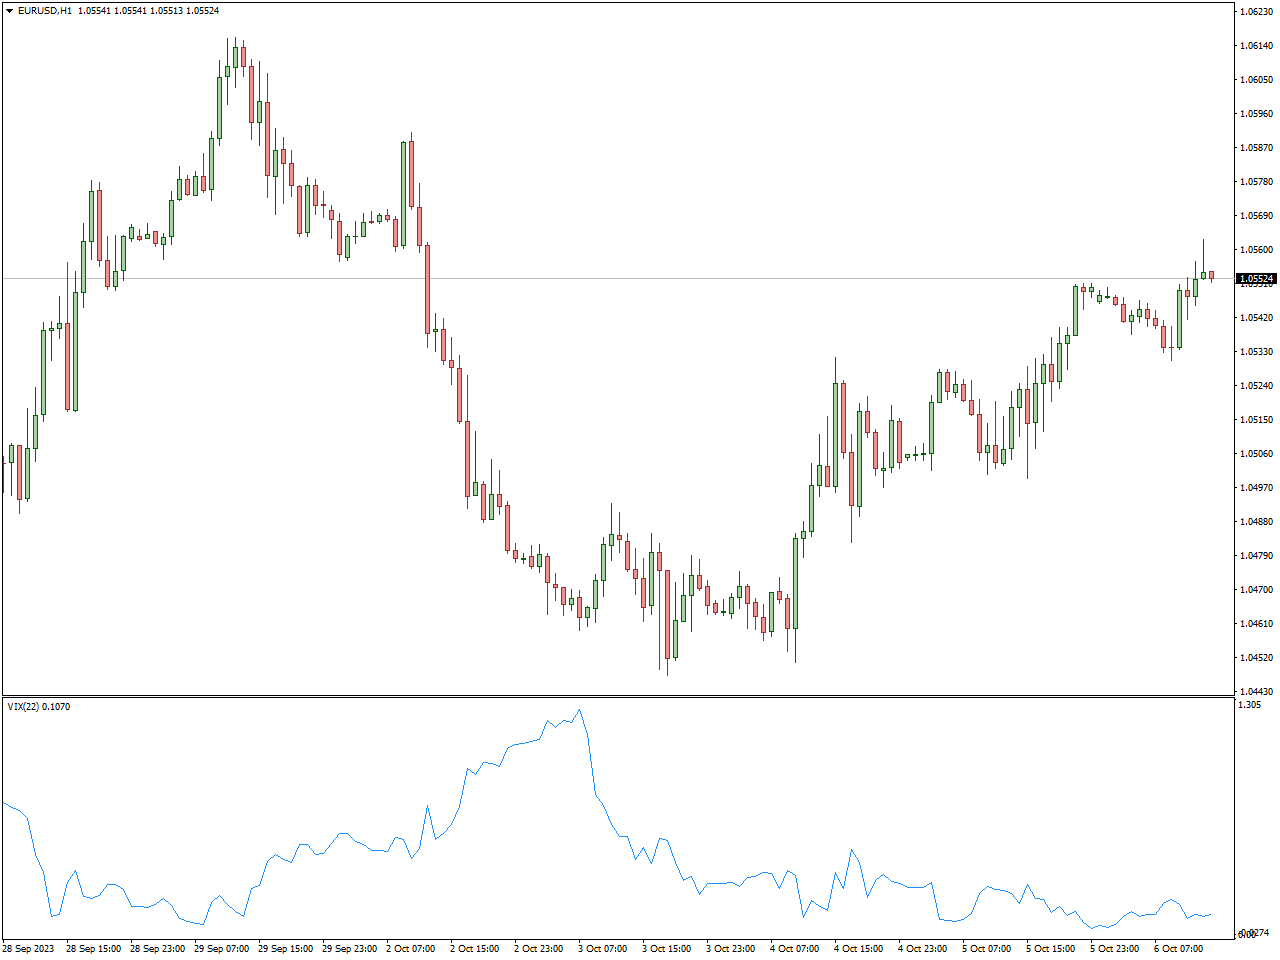
The Synthetic VIX Indicator, also known as the Synthetic Volatility Index, is a technical analysis tool used by traders and investors to gauge market volatility and sentiment. While it is not the same as the official CBOE Volatility Index (VIX), it aims to mimic the behavior of the VIX by analyzing options prices and market data to provide insights into market volatility.
The Synthetic VIX Indicator considers options pricing data, particularly the implied volatility of various options contracts. Implied volatility reflects the market’s expectations for future price fluctuations in the underlying asset.
raders use the Synthetic VIX Indicator to identify potential shifts in market sentiment. Rising synthetic VIX values may suggest increasing market volatility and potential bearish sentiment, while declining values may indicate decreasing volatility and potential bullish sentiment.
RSI 3TF Alert Indicator
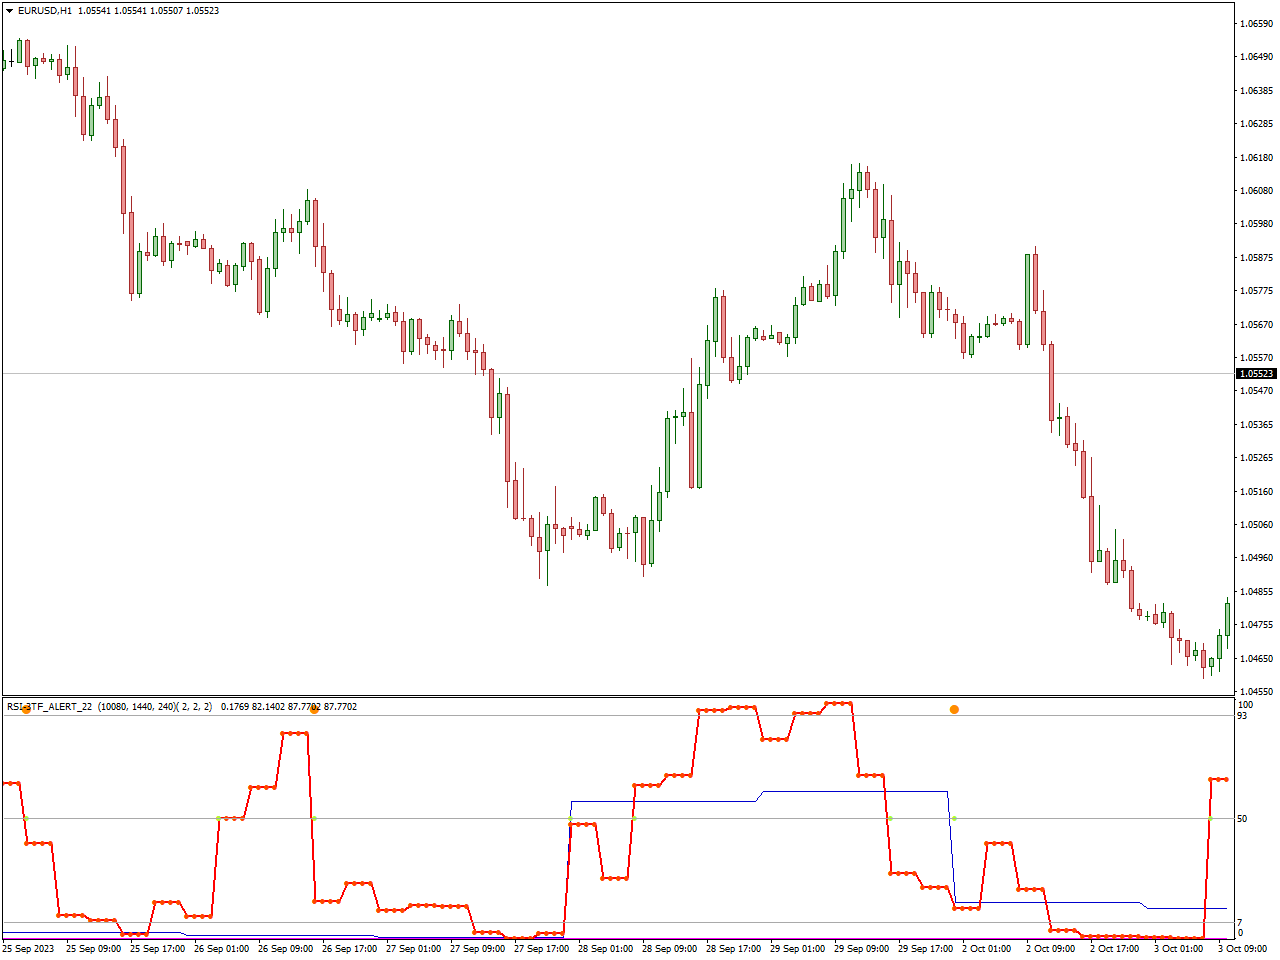
The RSI 3TF Alert Indicator is a technical analysis tool used by traders in financial markets, including stocks, forex, and commodities, to identify potential trend reversals and overbought or oversold conditions. This indicator is based on the Relative Strength Index (RSI) and includes an alert system to notify traders of significant RSI movements.
The “3TF” in the indicator’s name may refer to the use of multiple timeframes (TF) for RSI calculations. This means that the RSI is calculated not just on the current timeframe but also on multiple other timeframes (e.g., shorter and longer periods). This can provide traders with a broader perspective on RSI movements.
Traders use the RSI 3TF Alert Indicator to identify potential trend reversal points and overbought/oversold conditions. When the RSI crosses above 70, it may generate a bearish signal, suggesting potential downward pressure. Conversely, when it crosses below 30, it may generate a bullish signal, indicating potential upward momentum.
Conlusion
Navigating sideways markets with confidence is not only achievable but can also be a rewarding experience when armed with the right set of tools. The top 20 indicators we’ve explored in this article offer traders a diverse range of options to effectively decipher and capitalize on sideways market conditions. From trend-following indicators to oscillators and volatility measures, there’s a tool to suit every trading style and strategy.
Remember that the key to success in sideways markets, as with any market condition, lies not just in choosing the right indicators but in developing a robust trading plan, practicing disciplined risk management, and continuously honing your skills. Sideways markets may present challenges, but they also offer opportunities for patient and skilled traders to profit.
So, as you embark on your journey through the often meandering waters of sideways markets, equip yourself with these indicators, combine them wisely, and trade with confidence. With diligence and adaptability, you can harness the power of these tools to navigate sideways markets and come out on the winning side. Happy trading!