

In the dynamic landscape of business, attaining and maintaining success demands a proactive stance. The ability to comprehend and utilize leading indicators is crucial for making well-informed decisions that can guide your organization toward growth. This article serves as your entry point to delve into the top 15 leading indicators – essential metrics offering a glimpse into the future, transforming how businesses approach strategic decision-making. Come with us as we uncover the potential of these leading indicators and redefine the trajectory of your business.
Top 15 Leading Indicators
- Best Moving Average Indicator
- Bollinger Bands Indicator
- RSI MTF Indicator
- MACD 2 Line Indicator
- Colored Stochastic Indicator
- Fibonacci Retracement Indicator
- Ichimoku Kinko Hyo Indicator
- Parabolic Sar Indicator
- ATR Bands Indicator
- Chaikin Money Flow (CMF) Indicator
- Williams AD MA Indicator
- Commodity Channel Index (CCI) Indicator
- Volume MA Indicator
- OBV Indicator
- ADX Channel Indicator
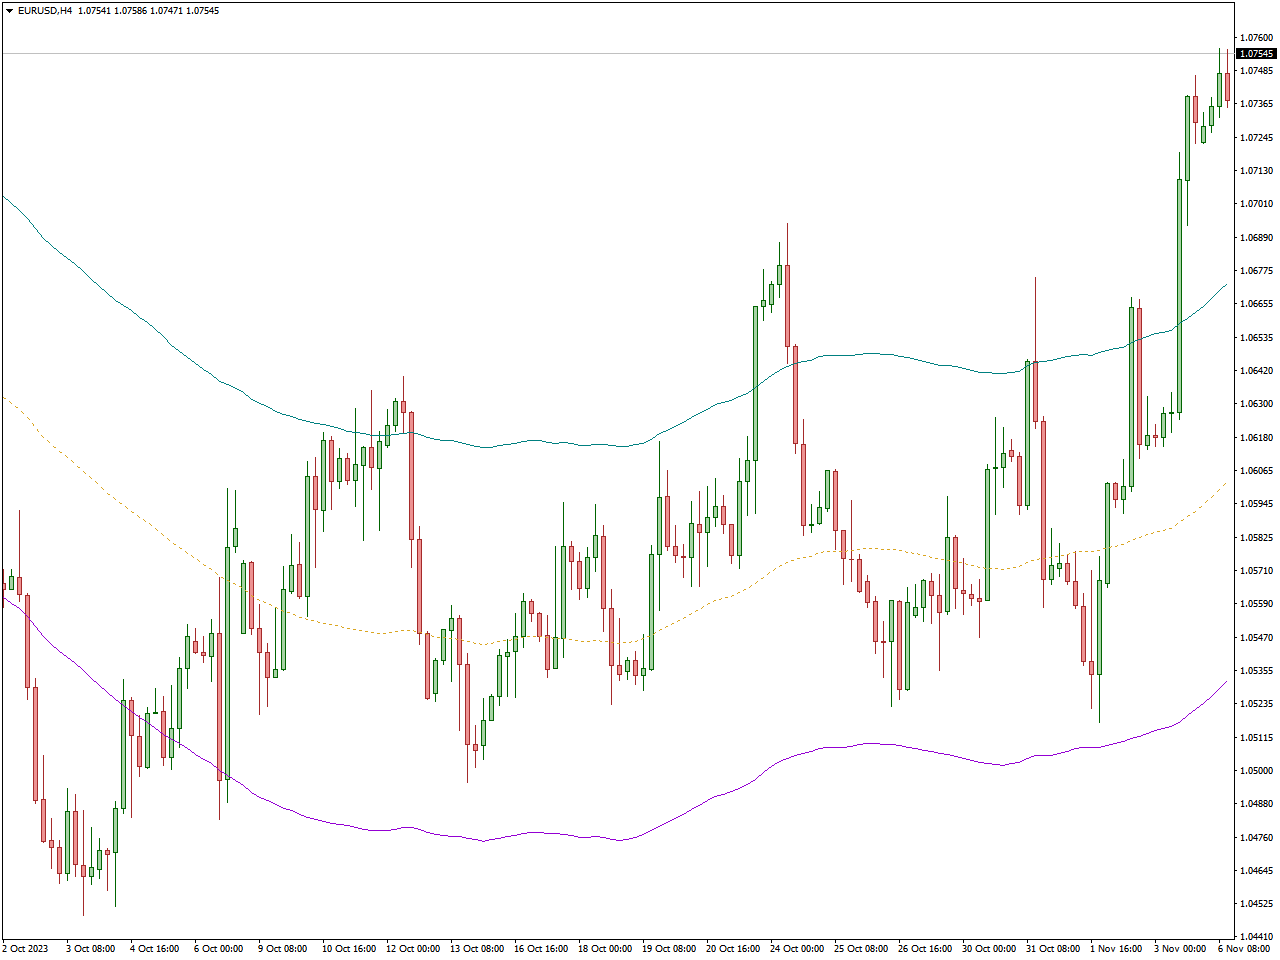
Best Moving Average Indicator
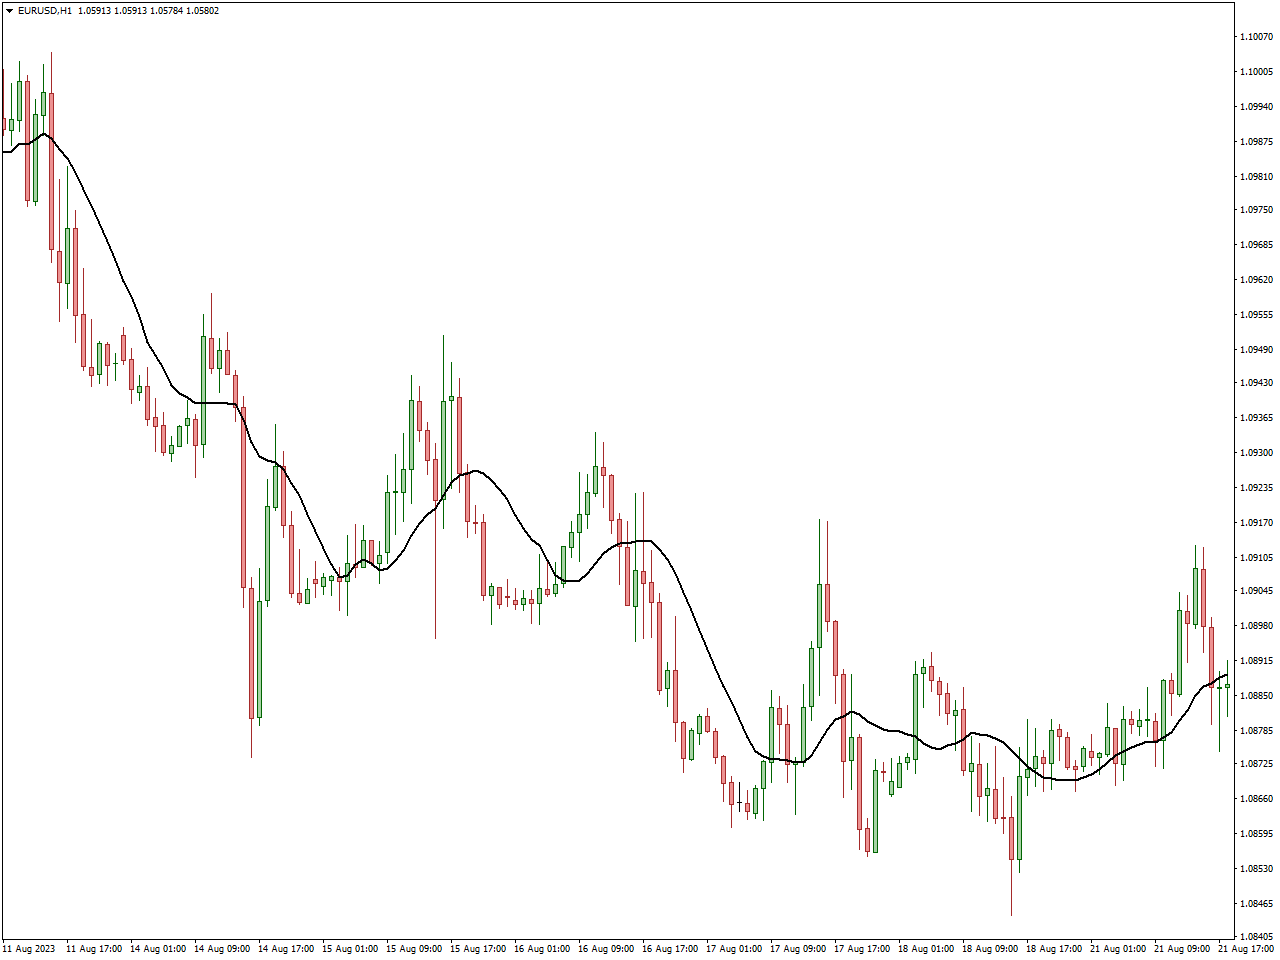
The Moving Average (MA) indicator stands as a crucial element in technical analysis, employed in the examination of financial market charts for the purpose of trend identification. Its functionality involves the computation of the average of price data over a specified time frame, resulting in a smoothed depiction of the underlying price trend. Two prevalent variations of moving averages include the Simple Moving Average (SMA) and the Exponential Moving Average (EMA). The SMA computes the average of closing prices over a predetermined period, whereas the EMA assigns more significance to recent prices, enhancing its responsiveness to immediate market shifts.
Traders and analysts leverage moving averages for diverse objectives. Initially, they serve in the recognition of trends, with prices above the moving average suggesting an upward trend and vice versa. Additionally, moving averages function as dynamic support or resistance levels, aiding in decision-making regarding entry or exit points. Lastly, the intersection of short-term and long-term moving averages can indicate potential alterations in trend direction, offering valuable insights into market sentiment and potential opportunities for buying or selling. Ultimately, the Moving Average emerges as a versatile tool, facilitating the smoothing of price data and extraction of crucial trend information from market charts.
Bollinger Bands Indicator
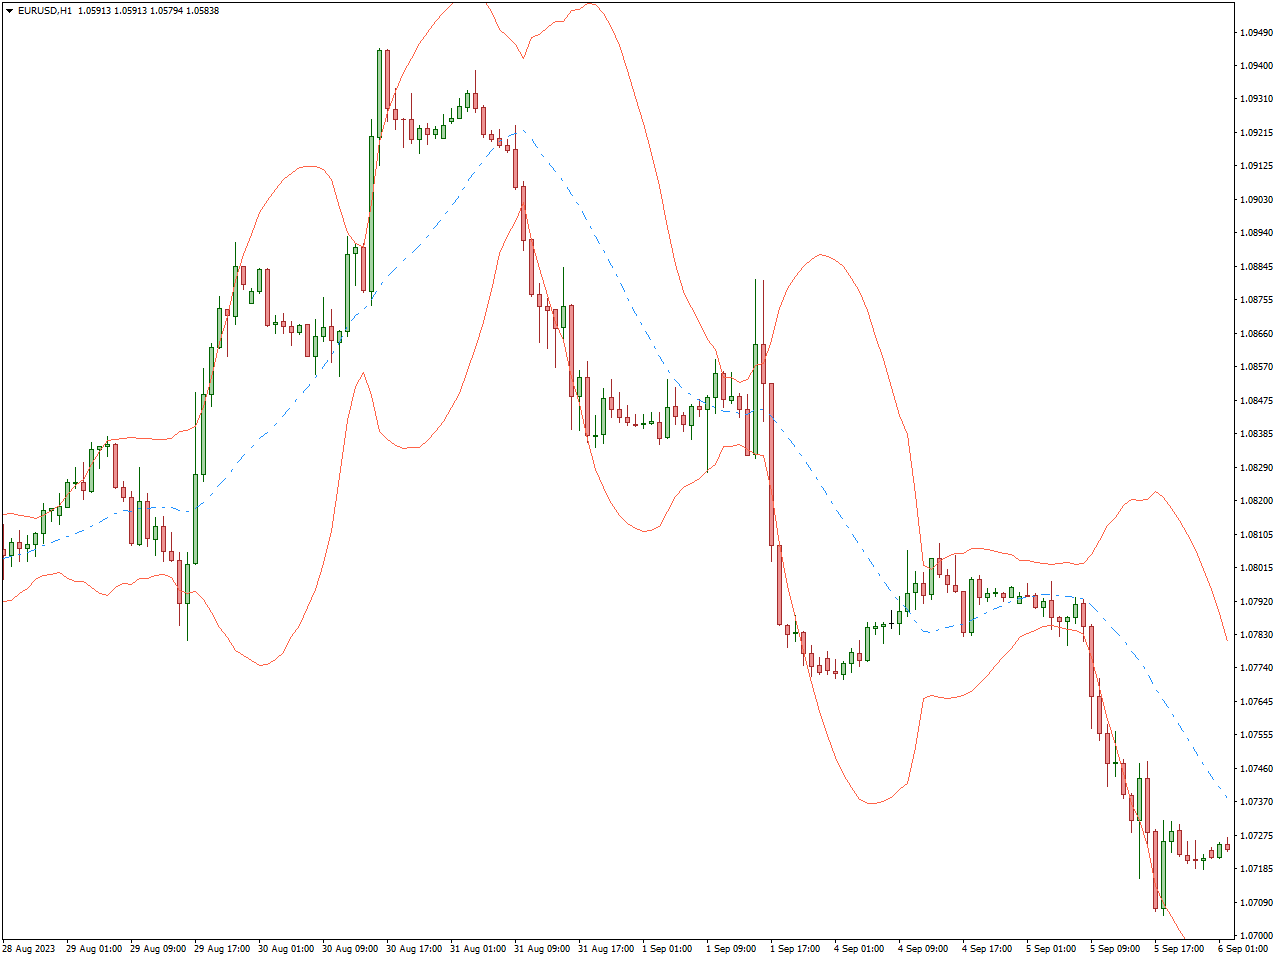
The Bollinger Bands indicator, crafted by John Bollinger, stands as a widely embraced tool in financial markets for evaluating volatility and anticipating potential shifts in prices. Comprising a middle band, typically a 20-period Simple Moving Average (SMA), and two outer bands denoting standard deviations from the SMA, this indicator offers a statistical framework for analyzing price dynamics. Its standard configuration includes a 20-period SMA with bands positioned at two standard deviations above and below the SMA.
The central purpose of Bollinger Bands lies in furnishing a statistical foundation for comprehending price movements. In response to heightened volatility, the bands expand, while diminished volatility prompts their contraction. Traders frequently deploy Bollinger Bands to pinpoint overbought or oversold conditions in a market. Breaches or touches of the outer bands may signify overbought scenarios, indicating a potential reversal or correction. Conversely, instances of prices reaching or dipping below the lower band could suggest oversold conditions.
Furthermore, Bollinger Bands serve as a valuable tool for gauging the intensity and trajectory of a trend. Consistent adherence of prices to the upper band may suggest a robust uptrend, whereas a persistent proximity to the lower band may indicate a pronounced downtrend. As such, traders often integrate Bollinger Bands with other technical indicators to refine their trading strategies, making it a versatile asset in the realm of technical analysis.
RSI MTF Indicator
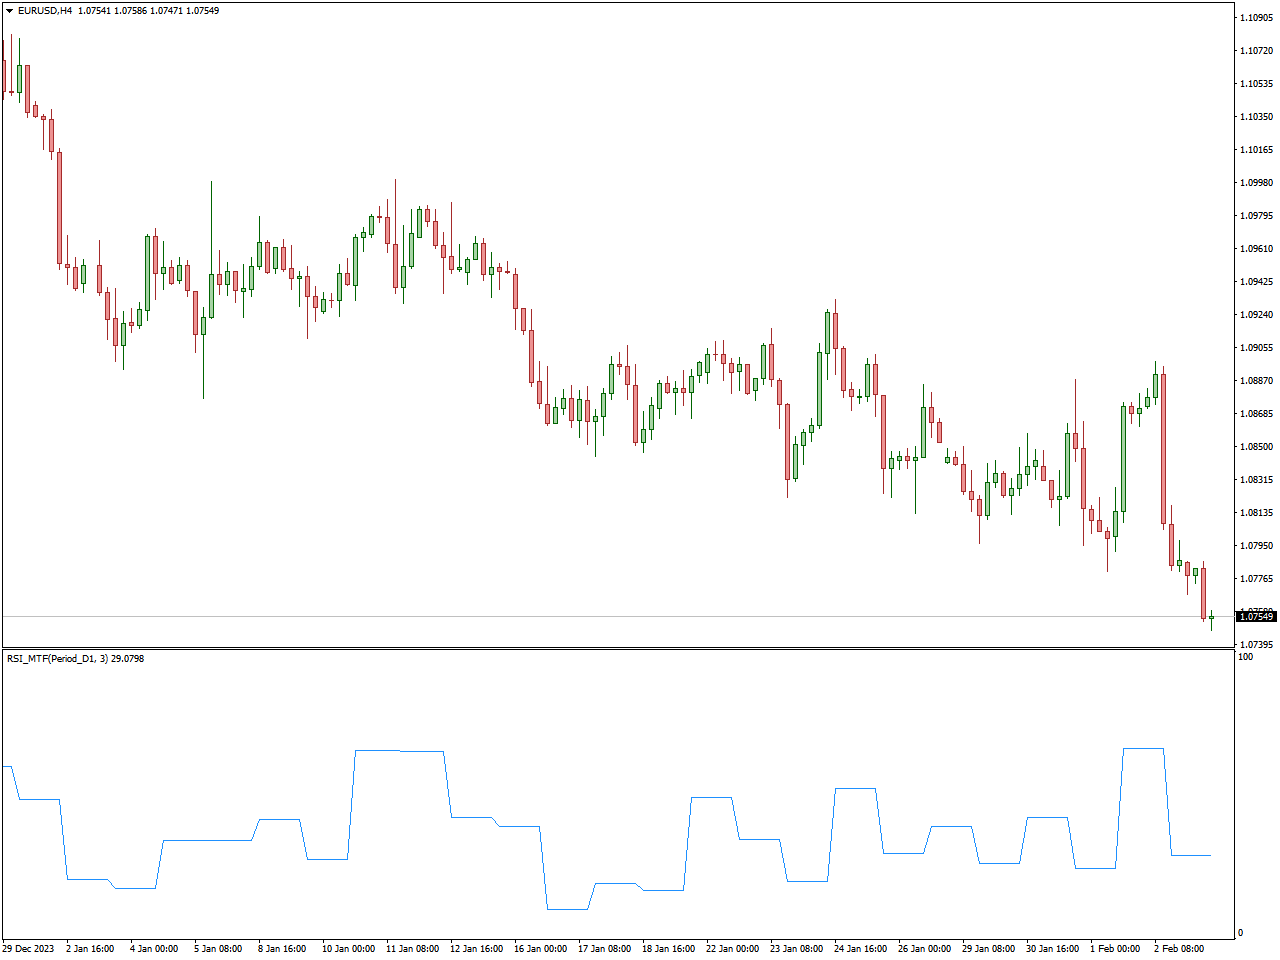
The RSI MTF (Relative Strength Index – Multi-Timeframe) indicator functions as a tool in technical analysis that merges the principles of the Relative Strength Index (RSI) with the capability to assess multiple timeframes. The RSI serves as a momentum oscillator, gauging the speed and magnitude of price changes and signaling instances of overbought or oversold market conditions.
Within the RSI MTF, the Multi-Timeframe feature enables traders to simultaneously examine RSI readings across diverse timeframes. This approach offers a more comprehensive understanding of trend strength and potential reversal points. As an illustration, a trader may employ a longer-term RSI on a daily chart to identify the overarching trend, while concurrently assessing a shorter-term RSI on an hourly chart to pinpoint potential entry or exit levels.
Implementation of the RSI MTF involves plotting multiple RSI lines on a single chart, each corresponding to a distinct timeframe. This enables traders to make well-informed decisions by considering momentum signals from various timeframes. The RSI MTF indicator is commonly utilized in conjunction with other technical analysis tools to validate signals and enhance the overall analysis, providing traders with a more thorough assessment of market conditions and potential trading opportunities.
MACD 2 Line Indicator
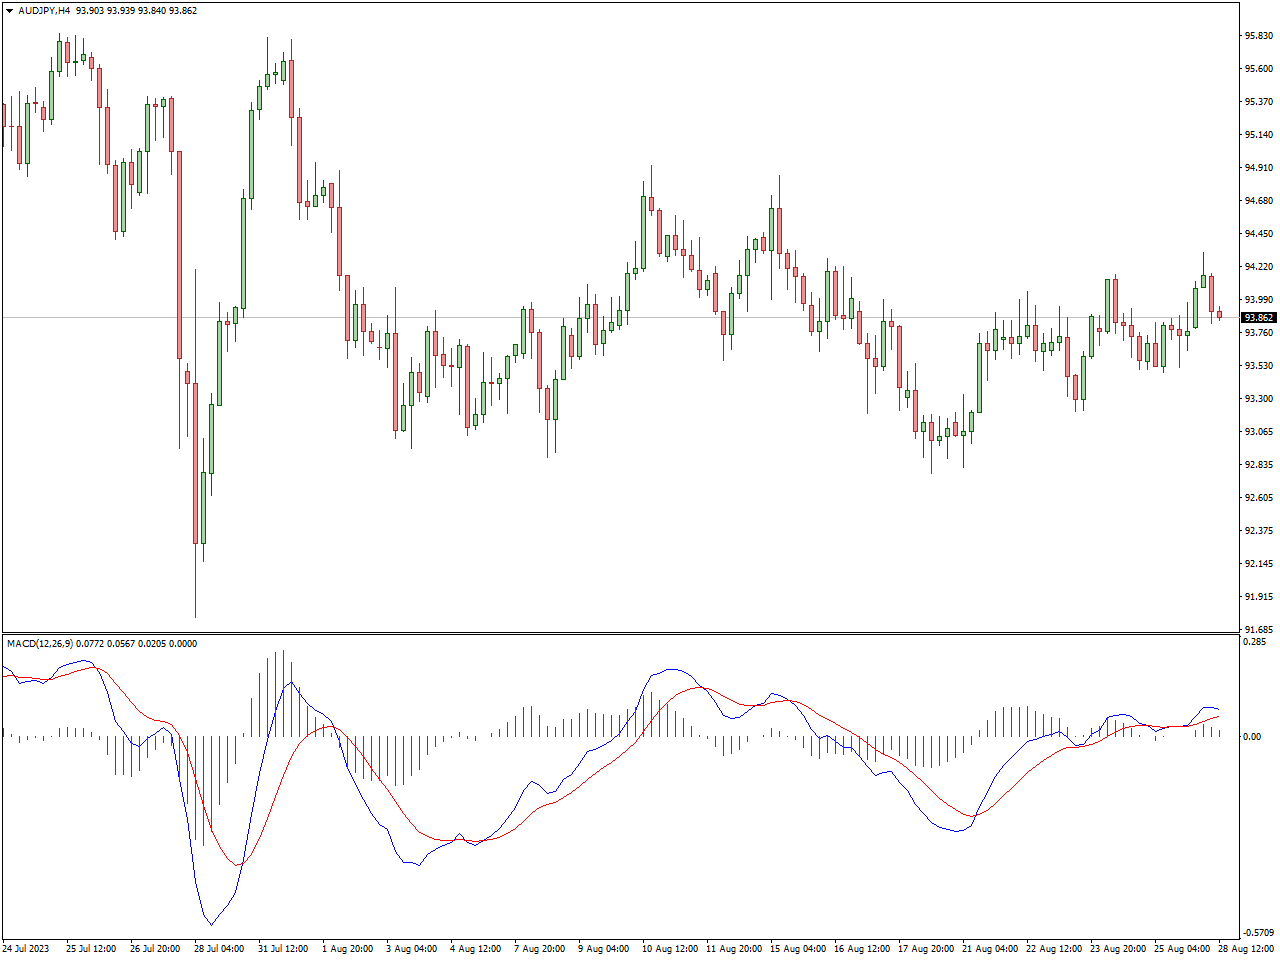
The MACD 2 Line Indicator, an abbreviation for Moving Average Convergence Divergence, is a widely employed tool in financial markets for the identification of potential trends, shifts in momentum, and possible entry or exit points. The conventional MACD comprises two key lines: the MACD line, also known as the “fast line,” and the signal line, alternatively referred to as the “slow line.”
The calculation of the MACD line involves subtracting the 26-period Exponential Moving Average (EMA) from the 12-period EMA. Subsequently, a 9-period EMA is typically applied to the MACD line to form the MACD histogram, representing the difference between the MACD and signal lines. A bullish signal is generated when the MACD line crosses above the signal line, indicating potential upward momentum. Conversely, a bearish signal is produced when the MACD line crosses below the signal line, suggesting potential downward momentum.
Traders commonly employ the MACD 2 Line Indicator to discern trends, identify potential reversals, and confirm the strength of an ongoing trend. Additionally, traders observe divergence between the MACD and the price chart to anticipate potential shifts in the prevailing trend. The MACD serves as a versatile tool, assisting traders in making informed decisions in the dynamic landscape of financial markets.
Colored Stochastic Indicator
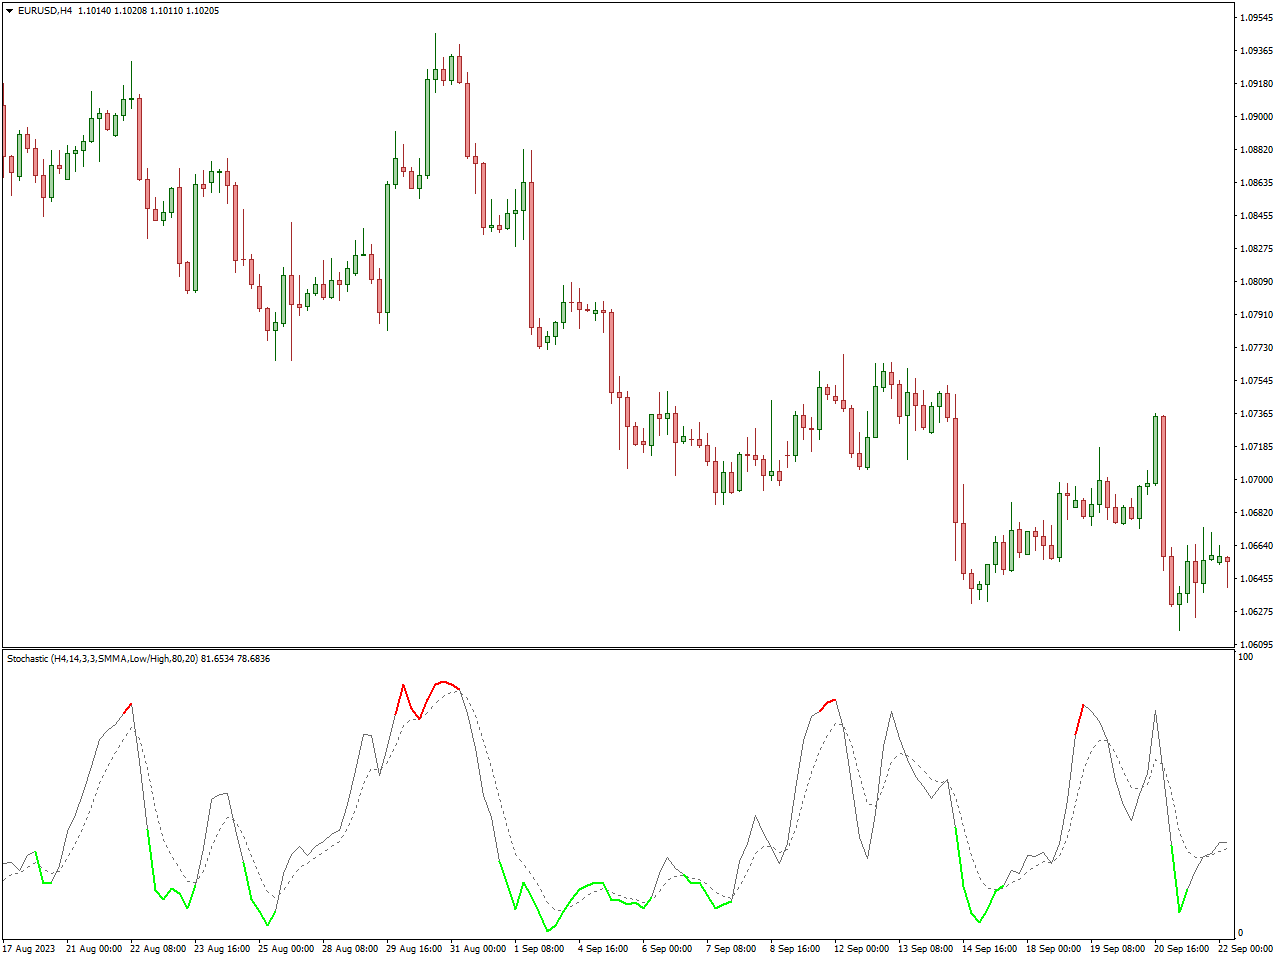
The Colored Stochastic Indicator represents a modified version of the conventional Stochastic Oscillator, a widely utilized technical analysis tool in financial markets for detecting possible shifts in trends and identifying overbought or oversold market conditions. The Stochastic Oscillator evaluates the current closing price of an asset in relation to its price range over a designated period.
With the Colored Stochastic Indicator, additional visual elements are incorporated to enhance its interpretive capabilities. Typically, distinctive colors are assigned to signify overbought and oversold conditions, streamlining the process for traders to swiftly assess the prevailing market situation. For instance, the indicator might depict overbought scenarios in red and oversold situations in green.
The Stochastic Oscillator computes two lines: %K and %D. %K reflects the current closing price relative to the price range, while %D represents a moving average of %K. A bullish signal is generated when %K crosses above %D, indicating potential upward momentum. Conversely, a bearish signal emerges when %K crosses below %D, signaling potential downward momentum.
Fibonacci Retracement Indicator
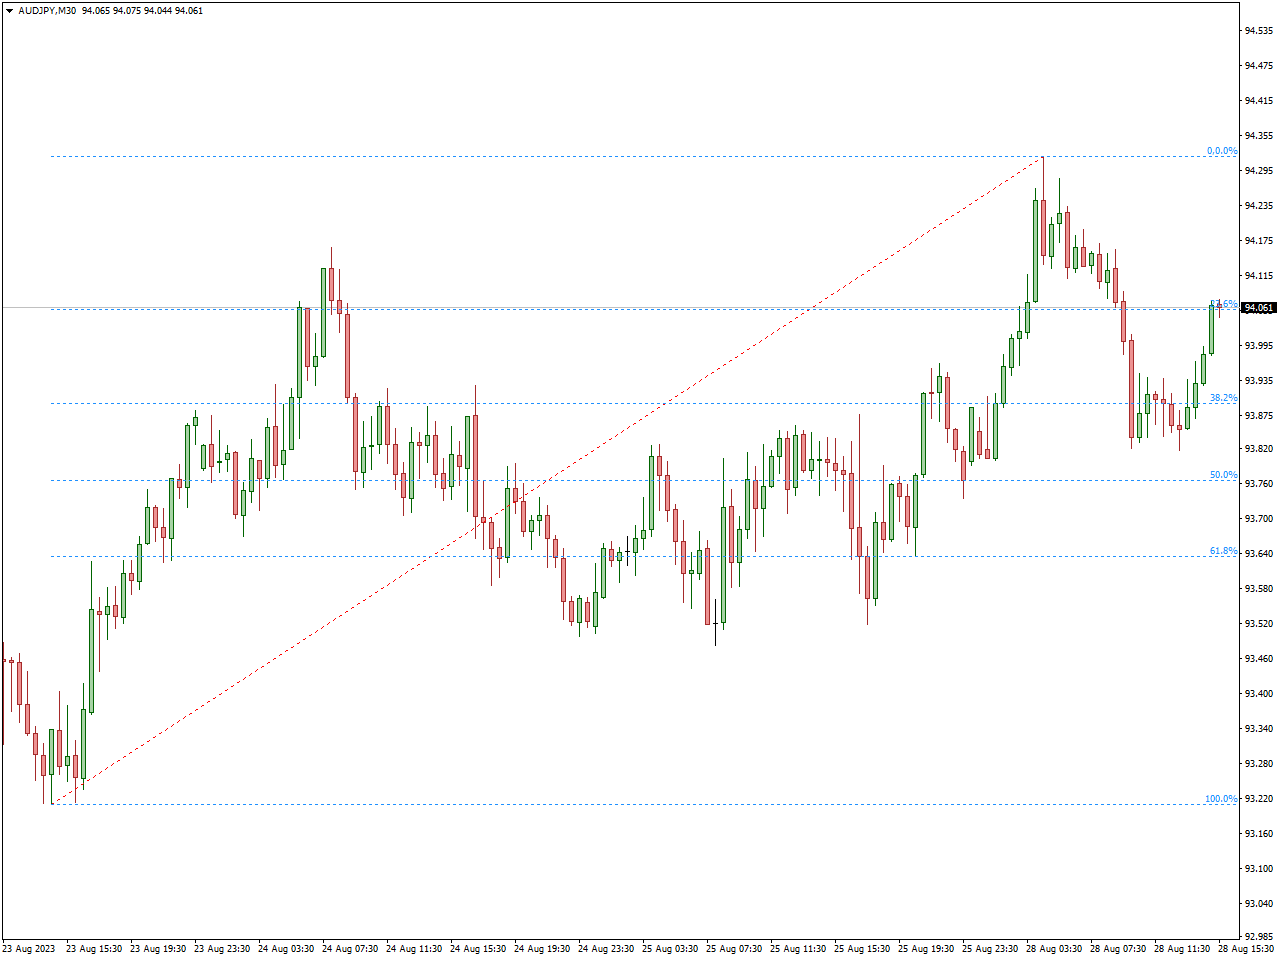
The Fibonacci Retracement Indicator is a frequently utilized tool in financial markets for technical analysis, assisting traders in pinpointing potential support and resistance levels based on the Fibonacci sequence. Named after the Italian mathematician Leonardo Fibonacci, this analytical instrument is employed to scrutinize price movements and forecast possible retracements or reversals.
Derived from the Fibonacci sequence, the Fibonacci Retracement levels encompass key ratios such as 23.6%, 38.2%, 50%, 61.8%, and 78.6%, serving to demarcate potential retracement levels. These levels are marked on a price chart to highlight areas where the price of an asset might retrace before resuming its prevailing trend. Although not directly derived from the Fibonacci sequence, the 50% retracement level is often deemed significant and is routinely integrated into Fibonacci retracement analysis.
Traders frequently utilize the Fibonacci Retracement Indicator to spot potential entry or exit points and assess the strength of a trend. As prices approach these Fibonacci levels, traders may anticipate market reactions, guiding decisions on buying or selling. Moreover, the Fibonacci Retracement Indicator is commonly employed alongside other technical analysis tools to corroborate signals and refine overall trading strategies.
In summary, the Fibonacci Retracement Indicator stands as a valuable ally for traders, furnishing insights into potential reversal levels and contributing to informed decision-making in the dynamic landscape of financial markets.
Ichimoku Kinko Hyo Indicator
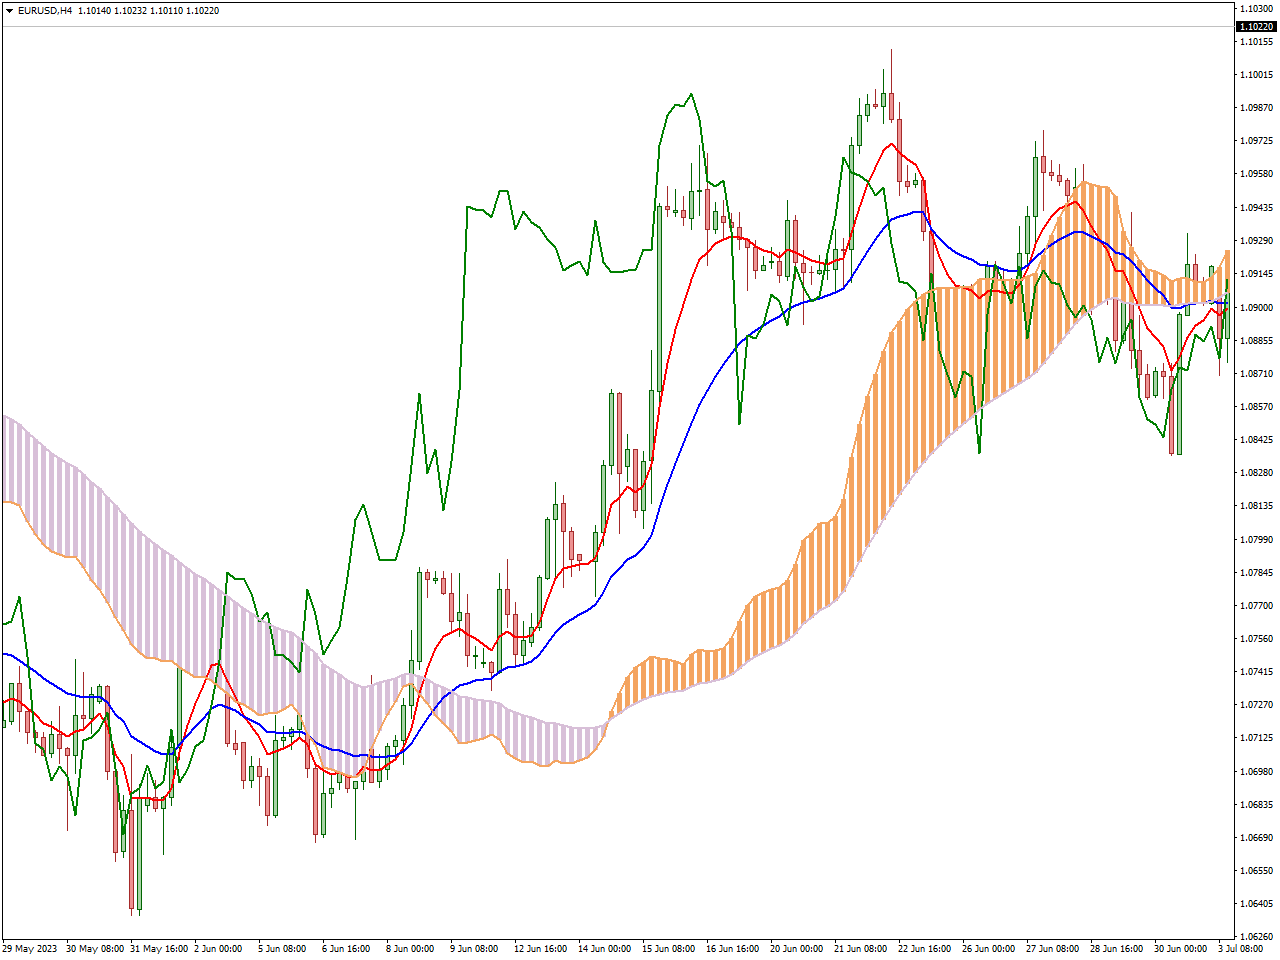
The Ichimoku Kinko Hyo, also known as the Ichimoku Cloud, represents a sophisticated technical analysis tool developed by Goichi Hosoda in Japan. Its name translates to “one glance equilibrium chart” in Japanese, underlining its purpose to provide a holistic perspective on market conditions. At its essence, the Ichimoku Cloud includes essential elements like the Kumo (Cloud), Senkou Span A and B, Tenkan Sen, Kijun Sen, and Chikou Span. The Kumo, or Cloud, serves as a dynamic zone indicating potential support and resistance levels, with its color and width reflecting market sentiment and volatility. The Tenkan Sen and Kijun Sen deliver trend signals, while the Chikou Span offers a retrospective view of price action.
The Ichimoku Kinko Hyo Indicator is widely embraced by traders for its capacity to consolidate various facets of market analysis into a single visual representation. The changing colors and thickness of the cloud provide insights into market sentiment, and the crossovers between Tenkan Sen and Kijun Sen in relation to the cloud generate signals for potential shifts in trends. Additionally, the Chikou Span, which reflects the current closing price shifted back over a specified period, aids in evaluating the strength of prevailing trends. This visual simplicity and inclusive perspective contribute to the Ichimoku Cloud’s popularity among traders, offering a swift and effective means of analyzing market conditions.
In practical application, traders leverage the Ichimoku Kinko Hyo to discern trend directions, identify possible support and resistance zones, and make informed decisions based on the dynamic interplay among its components. The indicator’s ability to provide a quick and comprehensive analysis is valued by traders navigating the intricacies of financial markets.
Parabolic Sar Indicator
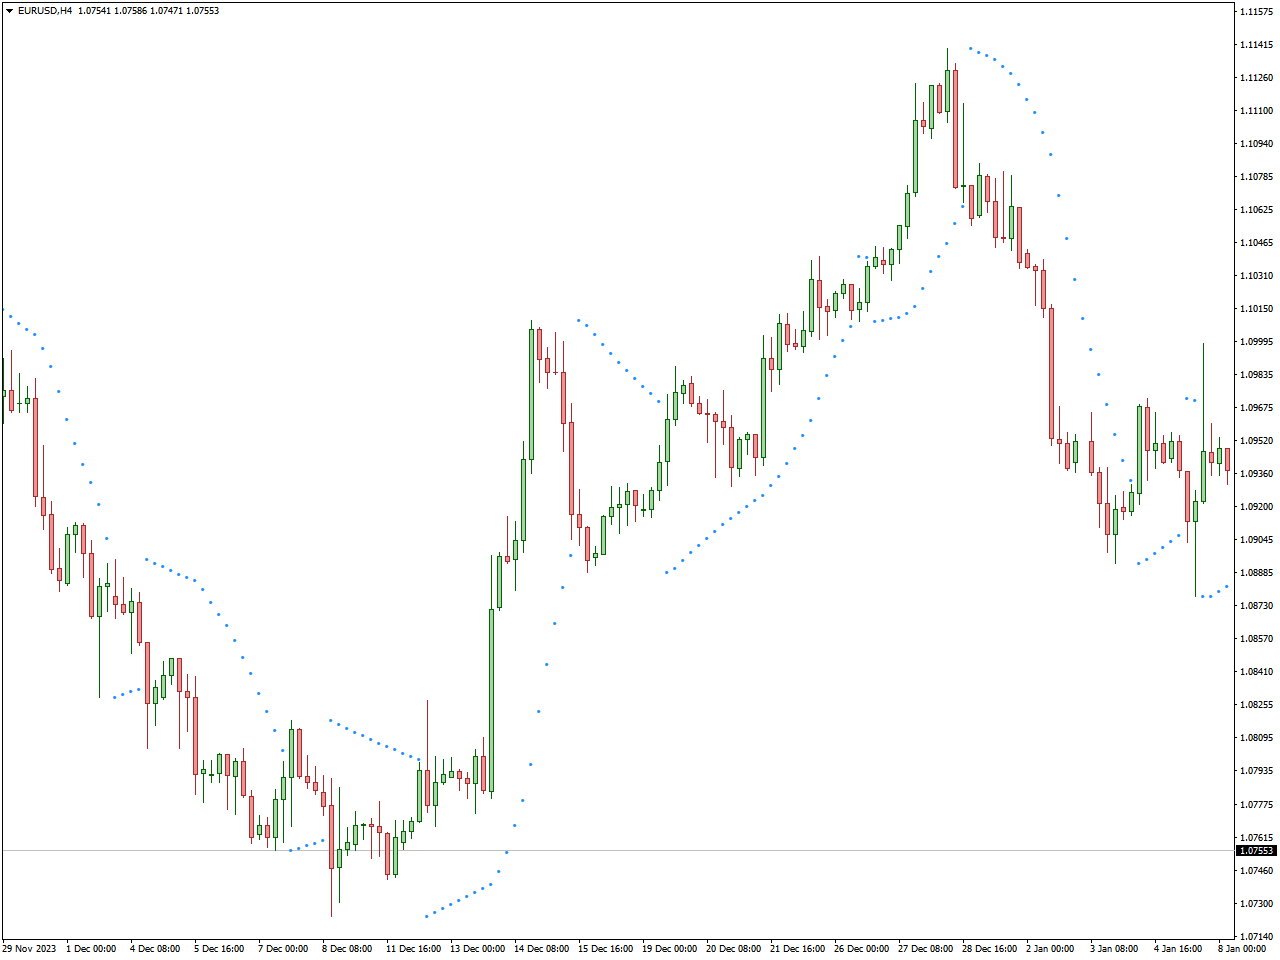
The Parabolic SAR (Stop and Reverse) indicator serves as a tool in technical analysis employed to identify potential shifts in trends and set trailing stop-loss levels. Developed by J. Welles Wilder, this indicator is designed to aid traders in pinpointing entry and exit points by marking dots or points on a price chart.
The calculation of the Parabolic SAR involves determining stop-and-reverse points based on the current price direction. In an upward price movement, the SAR points are placed below the price, potentially acting as support levels. Conversely, during a downward price trend, the SAR points are positioned above the price, serving as potential resistance levels. The gap between the SAR points and the price widens as the trend advances, creating an effective trailing stop-loss mechanism.
Traders commonly employ the Parabolic SAR to establish stop-loss orders, providing a means to safeguard profits and mitigate potential losses. When the price intersects the SAR point, it signals a potential reversal in the trend. This prompts traders to close existing positions and potentially initiate trades in the opposite direction, contributing to informed decision-making in the ever-changing dynamics of financial markets.
ATR Bands Indicator
The ATR (Average True Range) Bands Indicator is a tool in technical analysis that employs the Average True Range to establish a band or envelope surrounding the price chart. The Average True Range serves as a metric for volatility, evaluating the average trading range of an asset over a specific timeframe, commonly used by traders to assess market volatility.
In the framework of the ATR Bands Indicator, the Average True Range is frequently multiplied by a factor and then added or subtracted from the moving average of prices. This calculation produces upper and lower bands that encircle the price chart, dynamically adjusting based on the asset’s volatility.
The ATR Bands Indicator serves several functions. Firstly, it offers a visual depiction of volatility, where wider bands indicate higher volatility, and narrower bands suggest lower volatility. Secondly, these bands can function as potential support or resistance levels, assisting traders in identifying significant price levels. Lastly, crossovers or breaches of the bands by the price may indicate potential trend reversals or opportunities for breakouts. Traders often integrate the ATR Bands Indicator into their analyses to make well-informed decisions regarding entry or exit points, establish stop-loss levels, and comprehend the prevailing volatility conditions in the market.
Chaikin Money Flow (CMF) Indicator
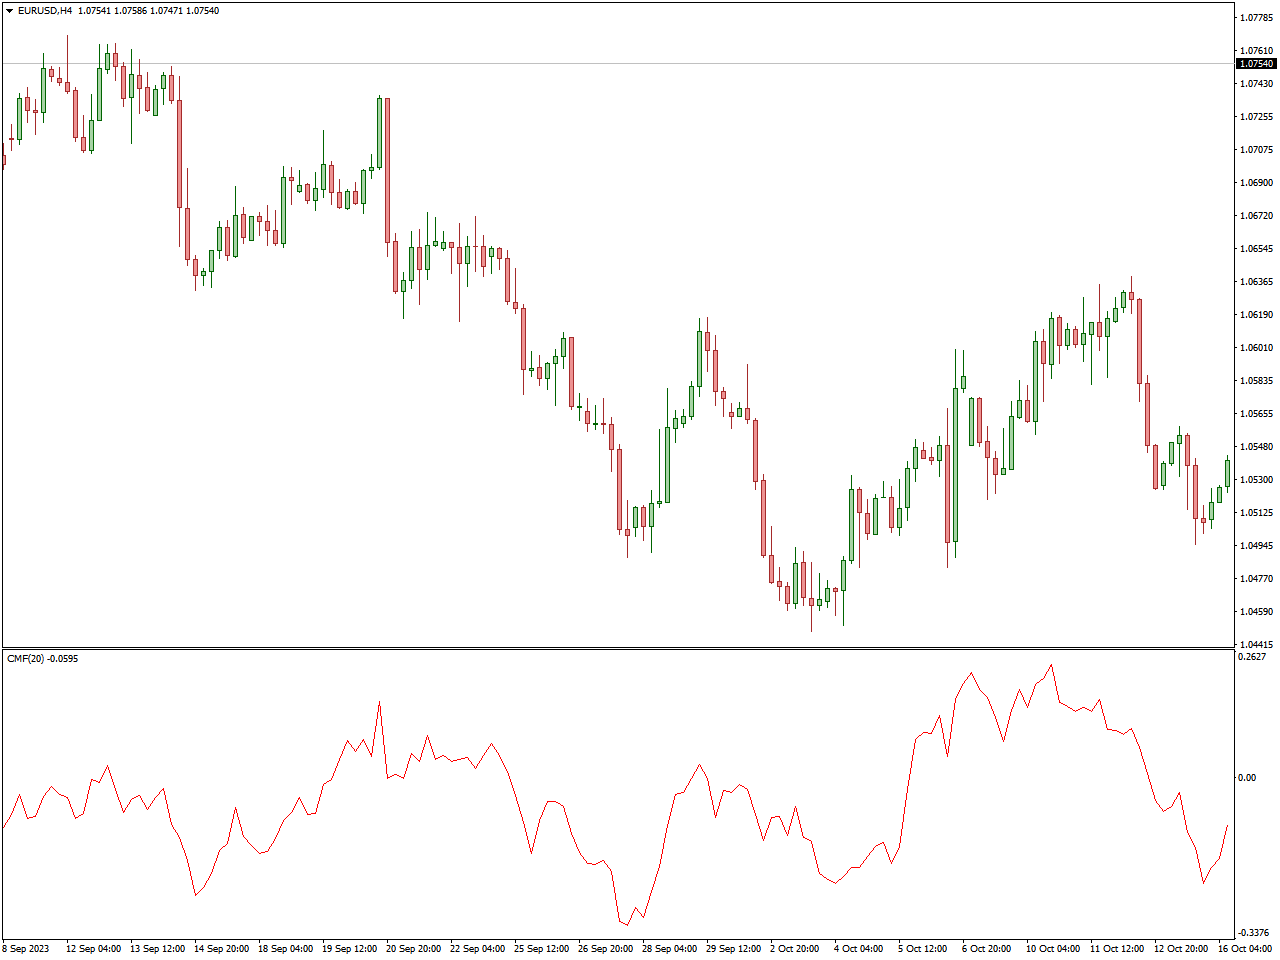
The Chaikin Money Flow (CMF) Indicator stands as a tool in technical analysis utilized to evaluate the inflow or outflow of capital within a financial instrument. Originated by Marc Chaikin, this indicator amalgamates price and volume data to offer insights into the intensity of buying or selling pressure prevailing in the market.
Calculation of the CMF involves considering the close, high, low, and volume of a financial asset, resulting in a value that mirrors the monetary movement into or out of the security. The derived CMF value is then plotted on a chart, typically fluctuating around a zero line. Positive CMF values indicate buying pressure, while negative values signify selling pressure.
Traders commonly leverage the Chaikin Money Flow Indicator to validate the robustness of a trend. A positive and ascending CMF in the charts implies substantial buying pressure, fortifying the existing uptrend. Conversely, a negative and diminishing CMF hints at potential selling pressure, reinforcing a downtrend scenario. Additionally, disparities between the CMF and price movements can serve as indications of potential reversals or shifts in market sentiment.
Williams AD MA Indicator

Williams AD MA, a technical tool renowned for its precision in signal provision when employed judiciously, seamlessly integrates two key indicators: Williams Accumulation Distribution (AD) and Moving Averages (MA). This amalgamation empowers traders to gauge whether a specific currency pair is currently undergoing an accumulation or distribution phase, facilitating a nuanced understanding of market pressure and, consequently, the strength of the prevailing trend.
This versatile indicator proves invaluable in discerning whether the accumulation exhibits the robustness required to sustain an upward trend or if the distribution possesses the potency to underpin a bearish trajectory. The incorporation of moving averages serves to refine the interpretation of market trends, endowing traders with insightful perspectives into the intricacies of market dynamics.
In practice, a buy signal materializes when the AD line follows an uptrend and ascends above the MA lines, while the fast MA (depicted in green) intersects the yellow line from below, accompanied by a general upward trajectory in the moving average lines. Conversely, a sell signal manifests when the AD line reflects a downtrend and descends below the MA lines, with the fast MA line intersecting the yellow line from above, coinciding with an overall decline in the moving averages.
Commodity Channel Index (CCI) Indicator
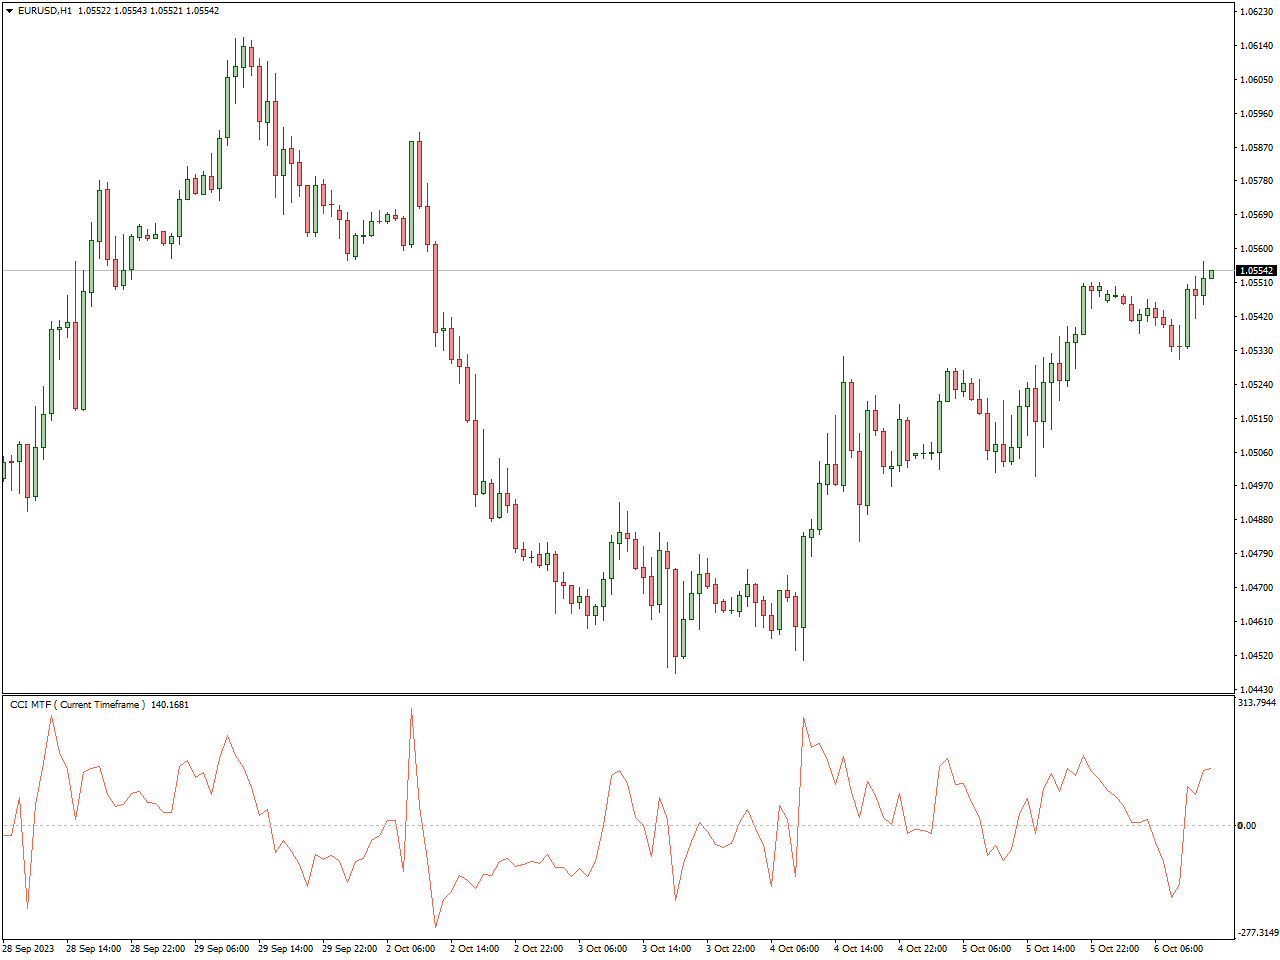
The Commodity Channel Index (CCI) stands as a widely utilized technical analysis tool, serving to evaluate the relative strength of a financial instrument’s price concerning its recent average. Developed by Donald Lambert, the CCI excels in discerning potential overbought or oversold conditions within the market.
Calculation of the CCI involves assessing the variance between the typical price of an asset (the average of its high, low, and close prices) and its simple moving average (SMA). This resultant value is then standardized through division by a constant multiple of the mean absolute deviation, generating a CCI value that fluctuates around a zero line. Positive CCI values indicate that the price surpasses its historical average, signaling potential overbought conditions, while negative values point toward potential oversold conditions.
Traders commonly leverage the Commodity Channel Index Indicator for diverse objectives. Notably, extreme CCI readings may signify an impending reversal or correction in the price trend, offering traders valuable insights for informed decision-making.
Volume MA Indicator

The Volume MA Indicator, a straightforward tool on MT4, utilizes the Moving Average to ascertain the trend direction. Employing a Simple Moving Average (SMA), the indicator depicts red and green bars in a lower window alongside the signal line. Similar to the SMA, the signal line aids in trend interpretation. Red bars signify a bearish trend, signaling a potential short trade, while green bars indicate an upward trend, suggesting a potential long trade.
In the context of bearish trends, the emergence of red bars signals an opportune moment for traders to go short. Conversely, during bullish trends, the appearance of green bars presents an opportunity for traders to go long.
Beyond trend identification, the Volume MA Indicator can serve as a tool for detecting market reversals. A change in color within the indicator signals traders to consider exiting their existing long or short positions. Additionally, traders can enhance their analysis by combining the Volume MA Indicator with other indicators such as the RSI or others.
Summarily, the Volume MA Indicator effectively communicates the trend direction by presenting red and green bars alongside the SMA, providing traders with valuable insights for decision-making.
OBV Indicator
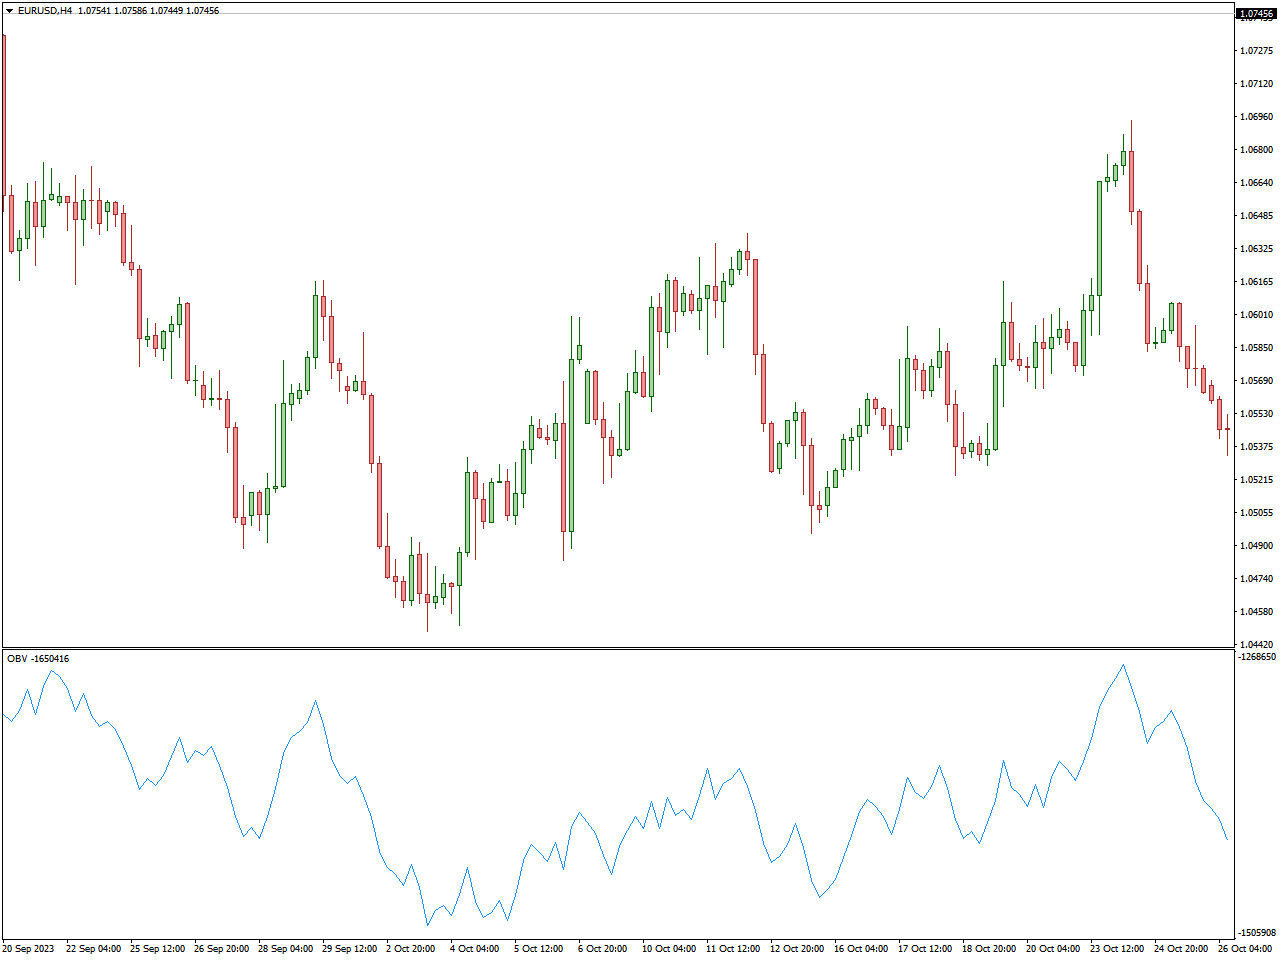
The On-Balance Volume (OBV) Indicator stands as a technical analysis tool designed to evaluate the cumulative volume of a financial instrument, with the objective of offering insights into the prevailing buying or selling pressure in the market. Crafted by Joe Granville, the OBV Indicator operates on the principle that changes in volume typically precede price movements.
The OBV calculation entails adding the volume on days when the closing price exceeds the previous day’s closing price and subtracting the volume on days when the closing price is lower. The resultant cumulative value is then graphically represented on a chart, creating a line that either aligns with or diverges from the prevailing price trend.
A ascending OBV line serves as confirmation of an uptrend, indicative of robust buying pressure, while a descending OBV line corroborates a downtrend, suggesting considerable selling pressure. Instances of divergence between the OBV line and price movements may signal potential trend reversals, adding an additional layer of analytical depth to this indicator.
ADX Channel Indicator
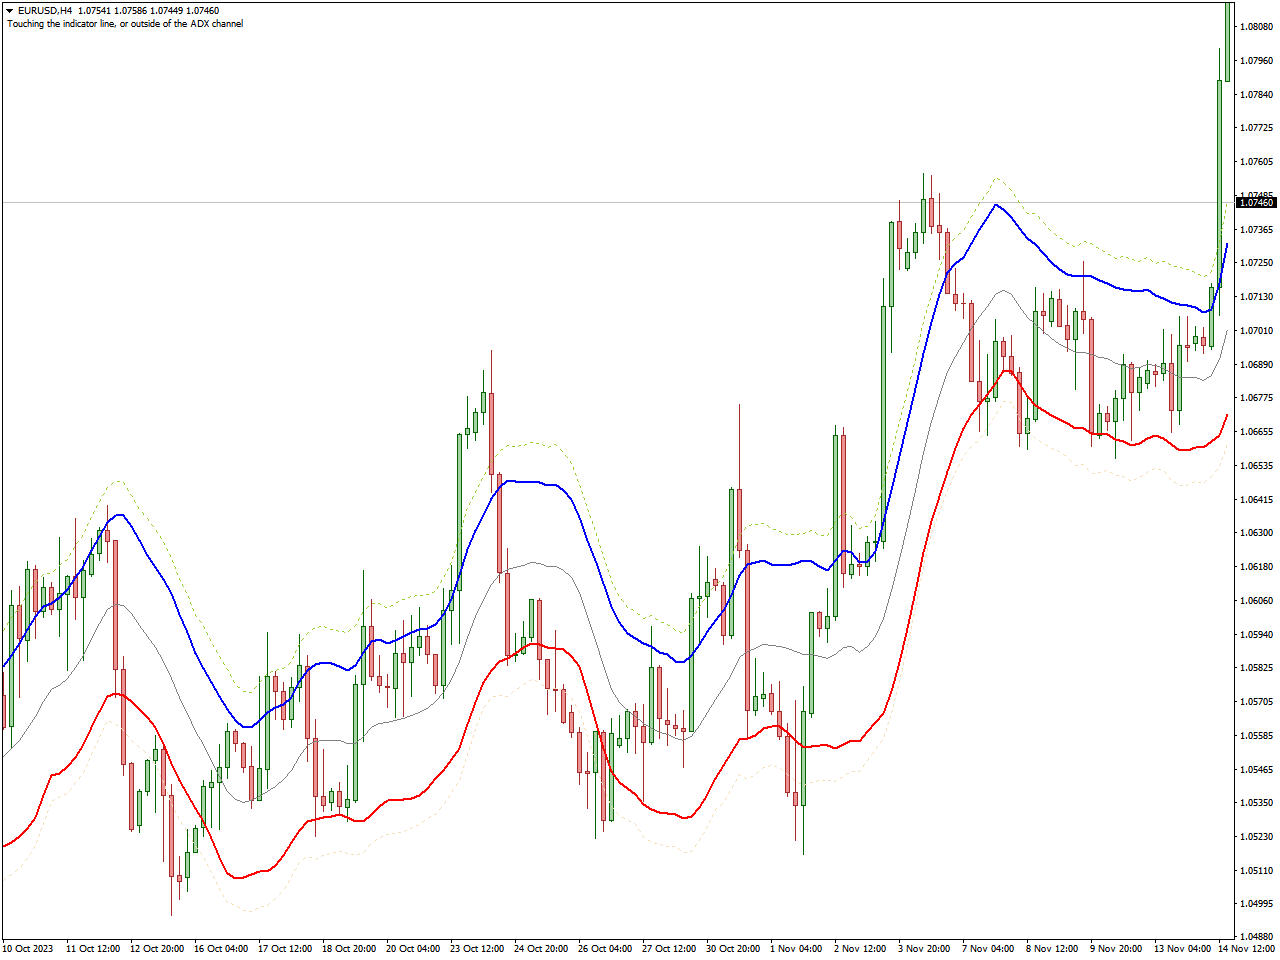
Named after the average directional trend index value (ADX), the indicator constructs a channel that adapts to market volatility. This channel generates buy and sell signals when the price action interacts with the upper and lower lines of the indicator. Primarily effective on shorter timeframes, ranging from 5 minutes to 1 hour, the ADX Channel Indicator exhibits limitations on timeframes beyond daily and during news events.
In a bullish market, the indicator ascends beneath the price action, while in a bearish market, it descends with the cloud crossing above the price actions. Renowned for its proficiency in identifying trends, the ADX channel materializes as a cloud-like structure above or below the price action, mirroring the prevailing trend. It stands as an indispensable tool for trend traders seeking effective indicators for market analysis.
Conclusion
In conclusion, achieving success in the business realm hinges on foresight, and the top 15 leading indicators serve as the pivotal factor in attaining it. By incorporating these metrics into your strategic planning, you not only navigate the current landscape effectively but also position your organization for future growth and resilience. Whether you are a seasoned executive or an emerging entrepreneur, adopting and leveraging leading indicators can be a transformative strategy, driving your business towards success in the dynamic environment of today. Now is the moment to elevate your strategic approach, seize opportunities, and steer your organization towards unparalleled success.