
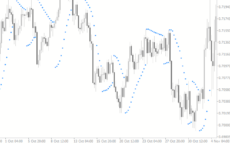
The Parabolic SAR Indicator is one of the most popular and useful Forex indicators available. It is a free, easy-to-use tool that can be used on the MT4 trading platform to help traders identify potential entry and exit points in the Forex market. The Parabolic SAR Indicator works by plotting dots on a chart that indicate when a trend is reversing or continuing. When a dot is above the price, it indicates that the trend is bearish and traders should consider exiting their position. When a dot is below the price, it indicates that the trend is bullish and traders should consider entering a position. The Parabolic SAR Indicator is based on the idea of parabolic curves, which are used to identify potential entry and exit points. The Parabolic SAR Indicator is a great tool for traders of all levels, as it is easy to understand and use. It can be used to identify potential entry and exit points, as well as to confirm trends. It is also a great tool for determining when to enter and exit a position. The Parabolic SAR Indicator is a great tool for traders who are looking to make informed decisions in the Forex market.
MT4


Parabolic Sar
The Parabolic SAR Indicator is a popular and useful Forex trading indicator that helps traders identify potential trend reversals. It is a free indicator available on the MT4 trading platform and is one of the most popular indicators used by forex traders. The indicator works by placing dots above the price when it is in a downtrend and dots below the price when it is in an uptrend. The Parabolic SAR Indicator is a great tool to help traders identify potential trend reversals and can be used in combination with other indicators to make more informed trading decisions.
| Trading Style | |
|---|---|
| Indicator Type | |
| Timeframe | |
| Platform |
0
People watching this product now!
Downloads - 10
Description
Reviews (0)
How to Install
Related products
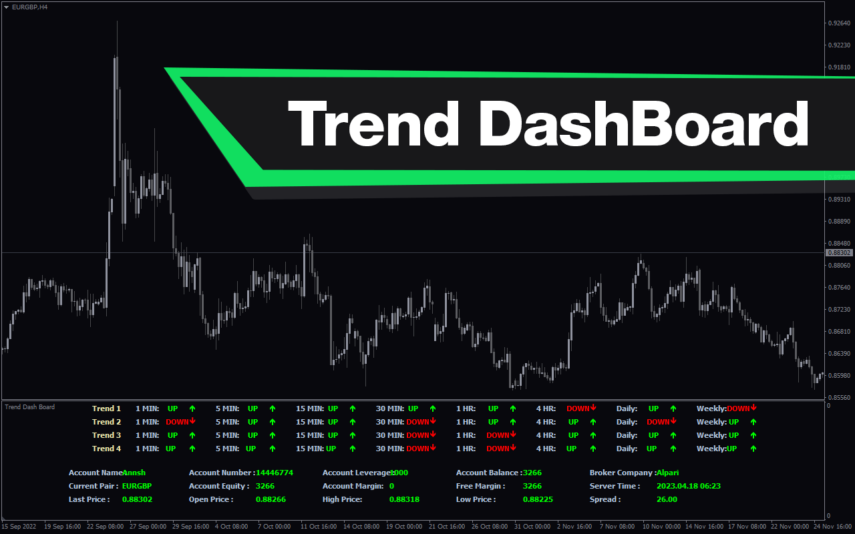
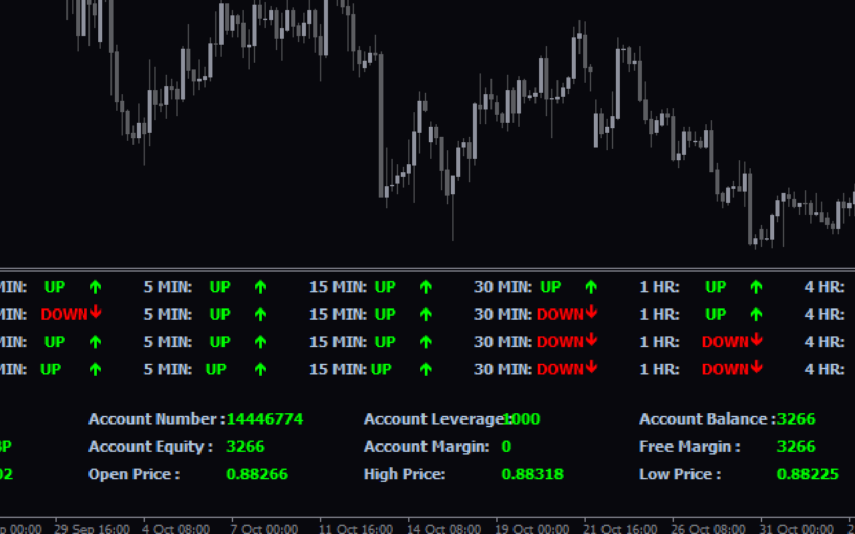
Trend DashBoard
The Trend Dashboard Indicator is a powerful MT4 tool for forex traders who want to keep track of multiple currency pairs and timeframes on one chart. The indicator uses a dashboard to display the trend direction and strength for different currency pairs and timeframes. It also includes an alert feature that can notify traders of potential trading opportunities. With this indicator, traders can save time and stay on top of market trends, allowing them to make informed trading decisions.
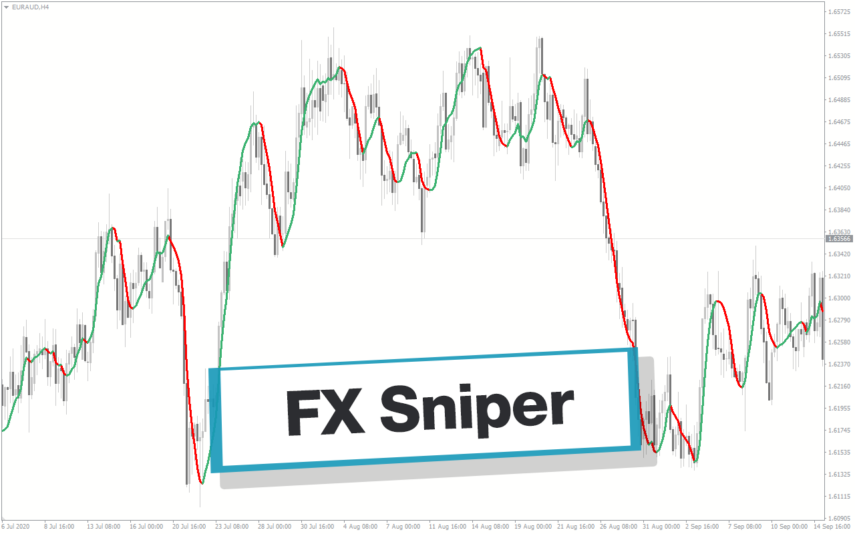
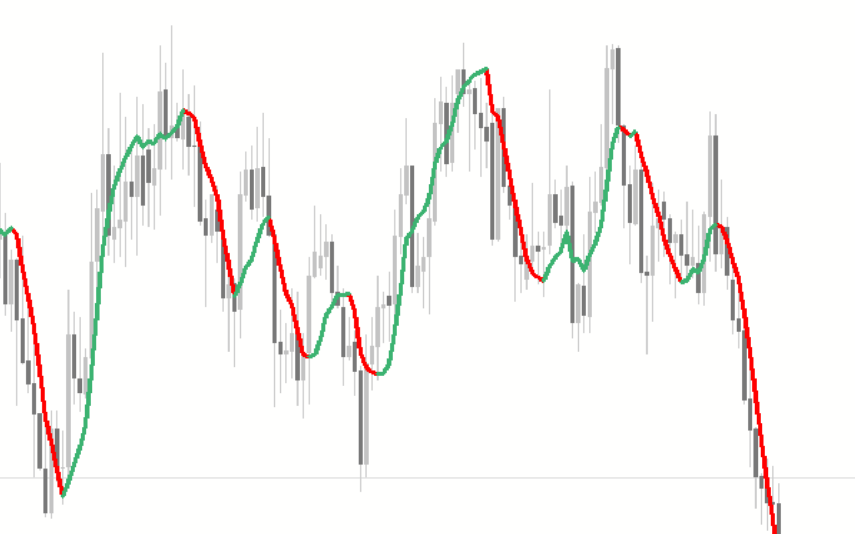
FX Sniper
The FX Sniper indicator is a new and popular forex indicator available for free on the MT4 platform. It uses advanced algorithms to identify trends and potential trading opportunities. The indicator is easy to use and gives clear signals on when to buy or sell based on market conditions. The FX Sniper indicator is suitable for traders of all levels, from beginners to experienced traders who want to improve their trading performance and profitability.
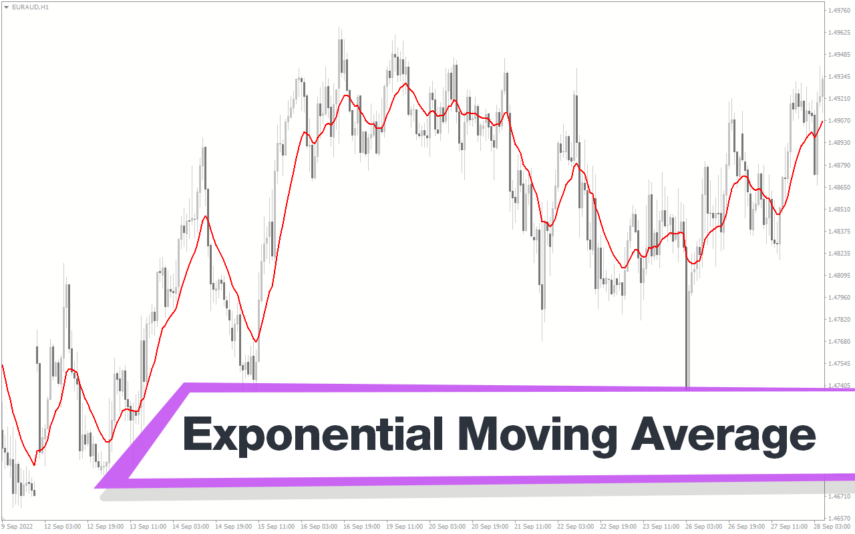
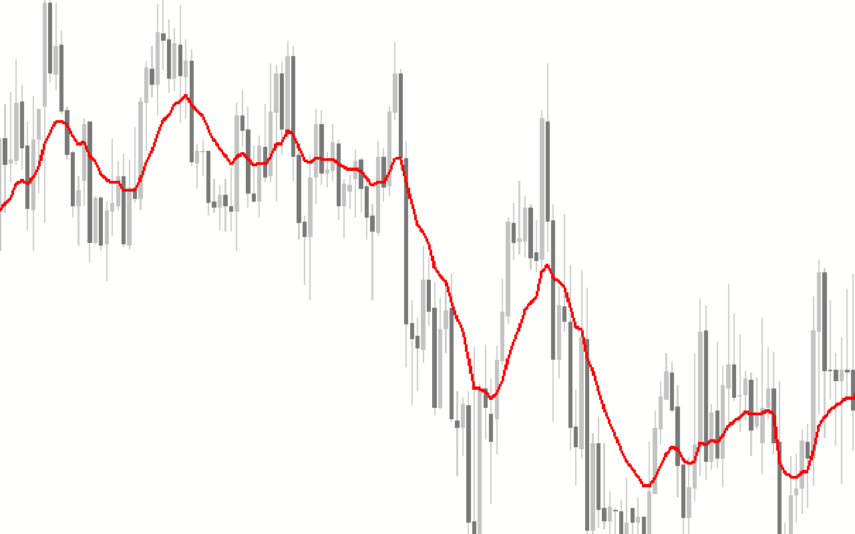
Exponential Moving Average
The EMA Indicator is a popular new forex tool for MT4 that is available for free download. It is a type of moving average that provides more weight to recent price changes, making it more responsive to current market conditions. The EMA indicator works by calculating the average price of an asset over a given period, with more emphasis placed on recent price action. This makes it a useful tool for traders looking to identify trends and changes in market direction.
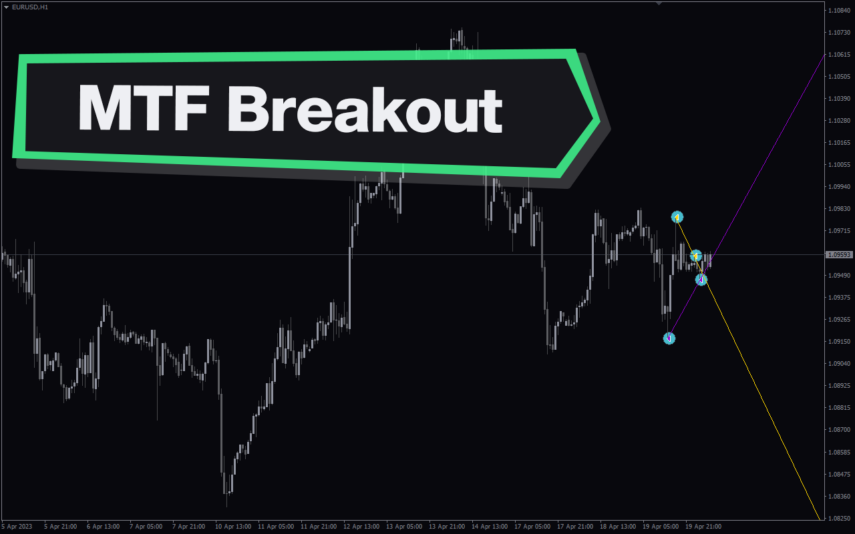
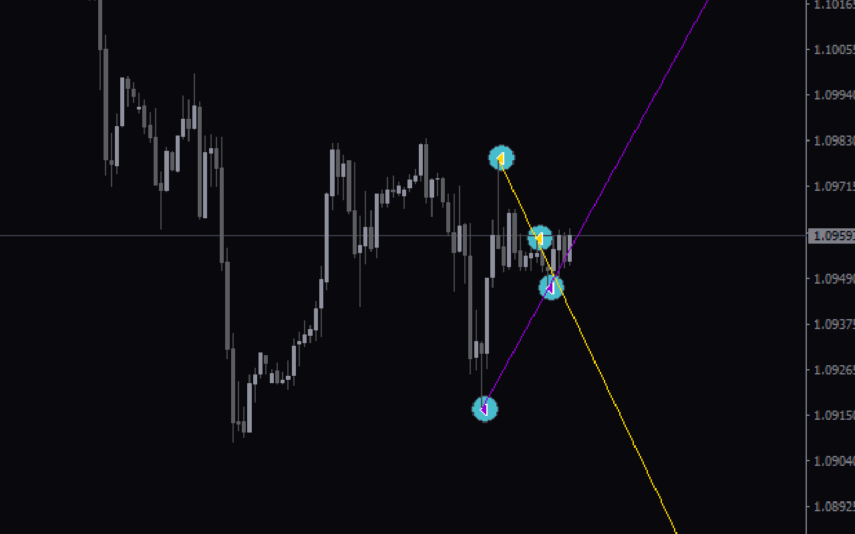
Multi Time Frame Breakout
The Multi-Time Frame Breakout indicator is a new and popular forex indicator that is available for free on the MT4 platform. This indicator helps traders identify breakout points by analyzing multiple timeframes at the same time. It works by plotting support and resistance levels based on the highest and lowest price levels over multiple time frames. This is a valuable tool for traders who use multiple timeframes in their analysis and want to improve their accuracy in identifying potential breakout points.
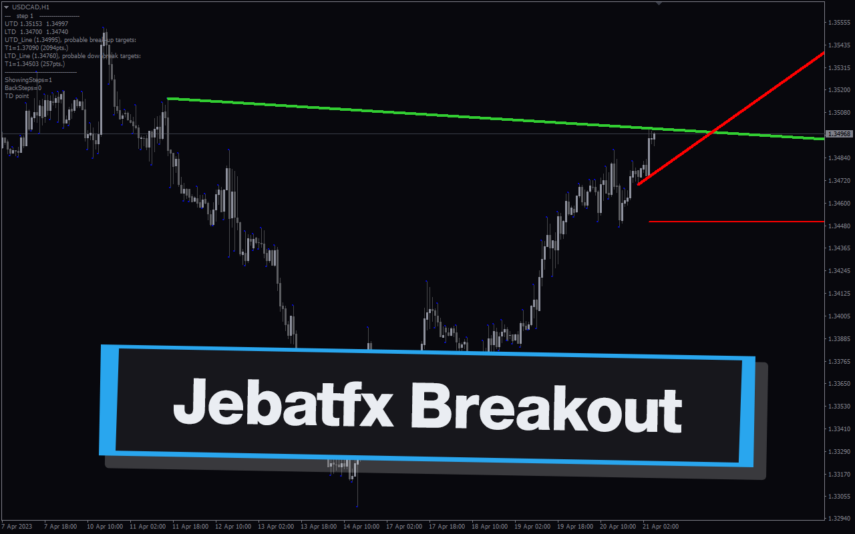
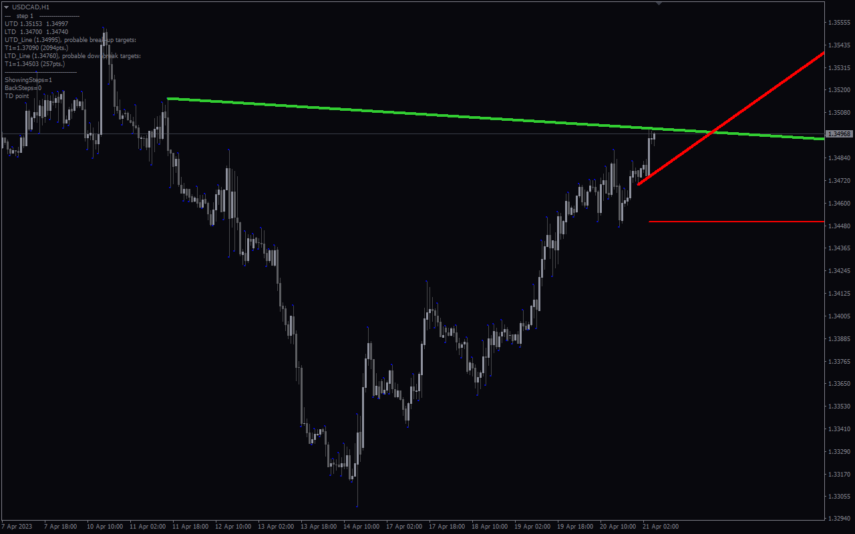
Jebatfx Breakout Trendline
The JebatFX Breakout Trendline Indicator is a new and popular forex indicator available for free on the MT4 platform. It is designed to identify breakout trendline opportunities by plotting trendlines and highlighting breakout signals. The indicator uses complex algorithms to analyze price movements and identify key support and resistance levels to generate trading signals. The JebatFX Breakout Trendline Indicator is user-friendly and easy to use, making it suitable for both novice and experienced traders.
Reviews
There are no reviews yet.