

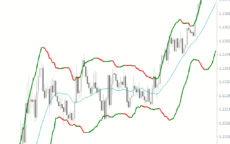
The Bollinger Bands Bicolor Indicator is a popular and free Forex indicator for MT4 that can be used to identify price trends. The indicator works by plotting two different colored bands on the chart. The upper band is usually colored red and the lower band is usually colored green. When the price is above the upper band, it is considered to be overbought and when the price is below the lower band, it is considered to be oversold. This indicator can be used to identify potential entry and exit points for Forex traders. The Bollinger Bands Bicolor Indicator is based on the concept of volatility. The bands are calculated by taking the standard deviation of the price over a certain period and then multiplying it by two. The standard deviation is used to measure the amount of variation in the price of a currency pair. The higher the standard deviation, the more volatile the currency pair. The indicator will then plot the upper and lower bands based on this volatility.
MT4


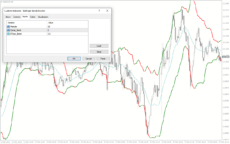
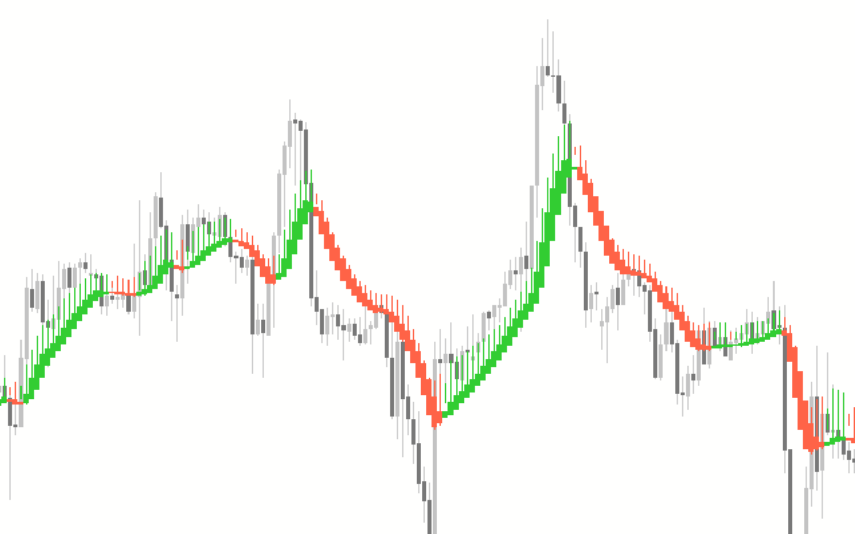
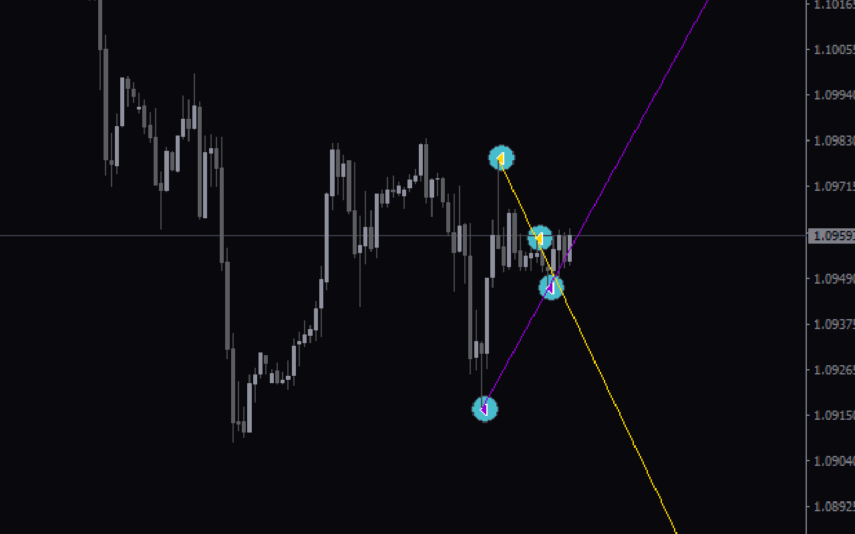
Bollinger Bands Bicolor
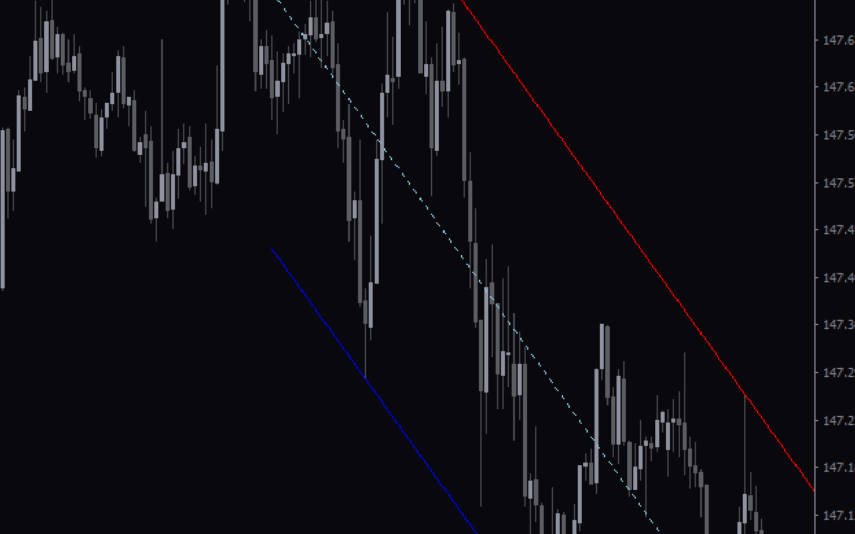
The Bollinger Bands Bicolor Indicator is a popular and free Forex indicator for the MT4 platform. This useful indicator is used to identify potential reversals and breakouts in the Forex market. It works by plotting two different Bollinger Bands, one in a red color and one in a blue color, on the same chart. The red band indicates a potential bearish reversal, while the blue band indicates a potential bullish reversal. By using the Bollinger Bands Bicolor Indicator, traders can easily identify potential entry and exit points in the Forex market.
| Trading Style | , |
|---|---|
| Indicator Type | , |
| Timeframe | |
| Platform |
0
People watching this product now!
Downloads - 70
Description
Reviews (0)
How to Install
Related products
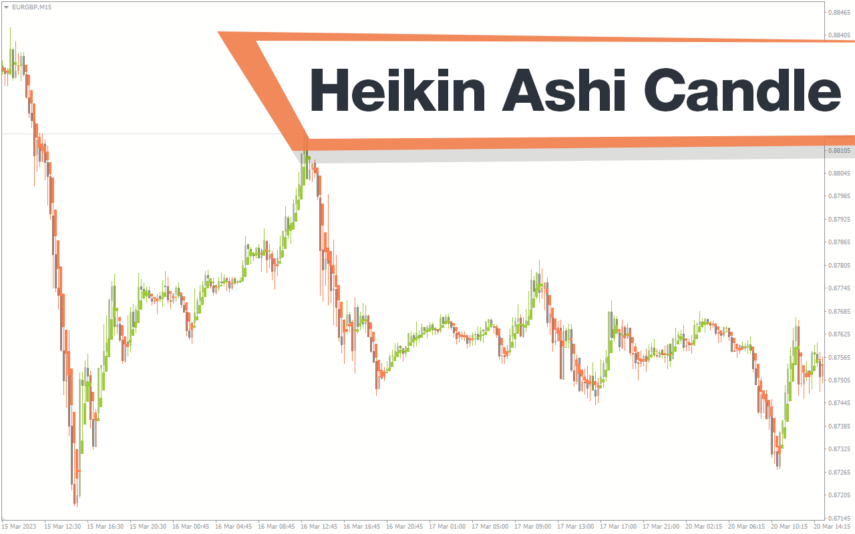
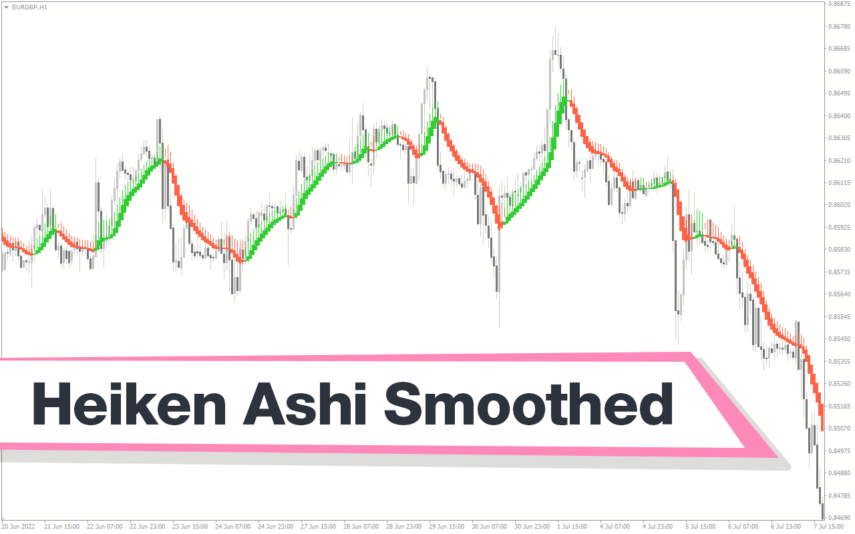
Heikin Ashi Candle
The Heikin Ashi Candle Indicator is a new and popular forex indicator for MT4 that provides traders with a unique way to analyze price movements. It is designed to display candles on a chart in a way that filters out market noise and shows a clearer picture of the trend. The Heikin Ashi Candle indicator averages the open, close, high and low prices of each candle to create a smoother and more readable trend. This indicator is useful for traders of all skill levels as it simplifies the process of spotting trends and potential market reversals.
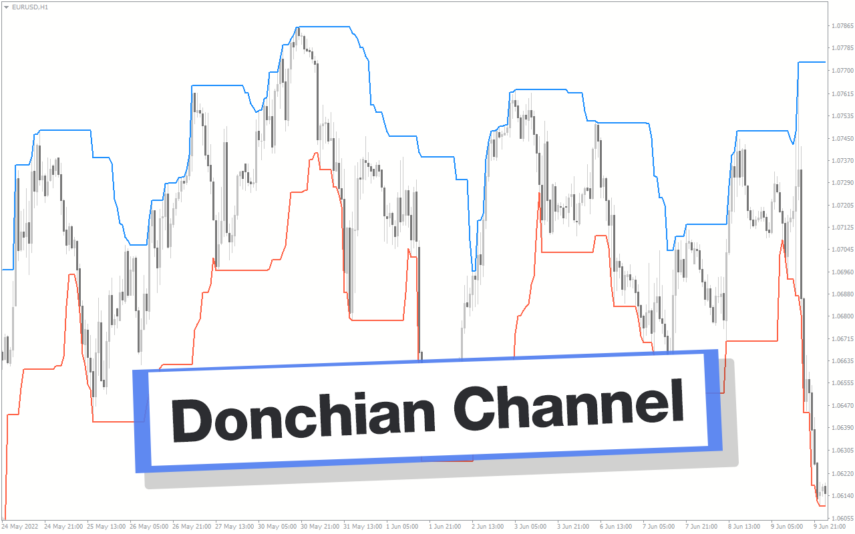
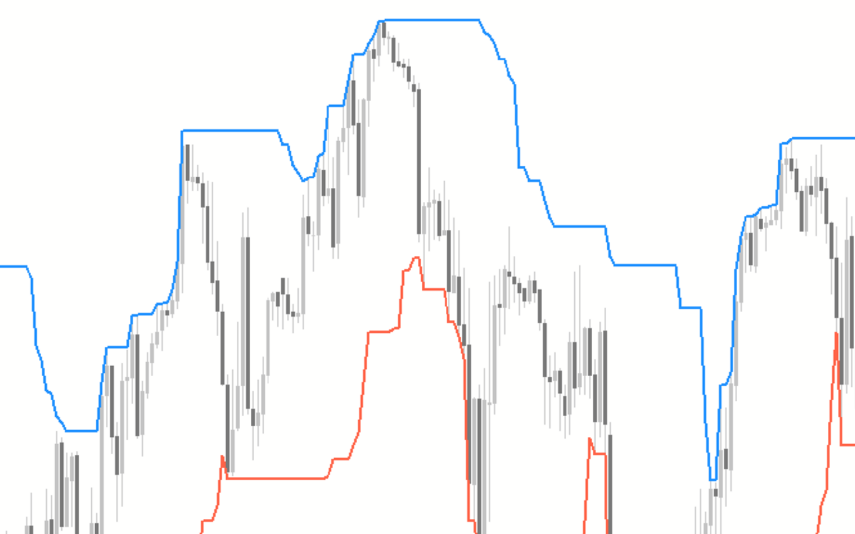
Donchian Channel
The Donchian Channel Indicator is a popular forex indicator that is widely used by forex traders to determine trend direction as well as entry and exit points designed to be used in the forex market with the MT4 platform. This indicator is very popular among traders because of its simplicity and efficiency, it works by determining the high and low of the price for a certain period and plotting a channel based on these values. The Donchian Channel Indicator is a popular and effective forex indicator that gives clear market entry and exit signals, making it an essential tool in a successful forex trader's toolbox.
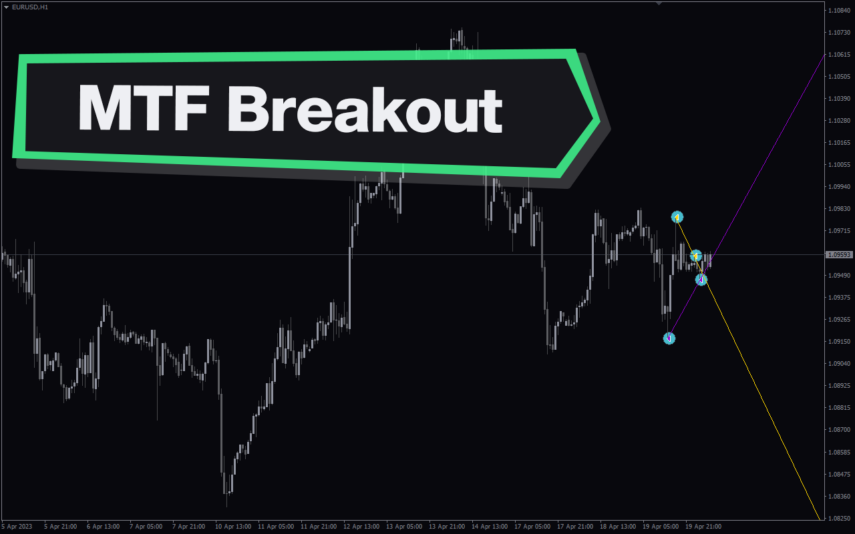
Multi Time Frame Breakout
The Multi-Time Frame Breakout indicator is a new and popular forex indicator that is available for free on the MT4 platform. This indicator helps traders identify breakout points by analyzing multiple timeframes at the same time. It works by plotting support and resistance levels based on the highest and lowest price levels over multiple time frames. This is a valuable tool for traders who use multiple timeframes in their analysis and want to improve their accuracy in identifying potential breakout points.
Reviews
There are no reviews yet.