

Delve into the realm of gold trading using our carefully curated selection of the finest 10 indicators crafted to enhance your trading approach. Regardless of your experience level, whether you’re a seasoned professional or a novice, these indicators play a pivotal role in unlocking success in the vibrant and profitable gold market.
Top 10 Gold Trading Indicators
- RSI Divergence Indicator
- Best Moving Average Indicator
- Gold Level indicator
- Stochastic Cross Alert Indicator
- FXSSI.TradingSessions
- MTF High Low Indicator
- OBV Indicator
- MACD Divergence Indicator
- Money Flow Index Indicator (MFI)
- Better Volume
RSI Divergence Indicator
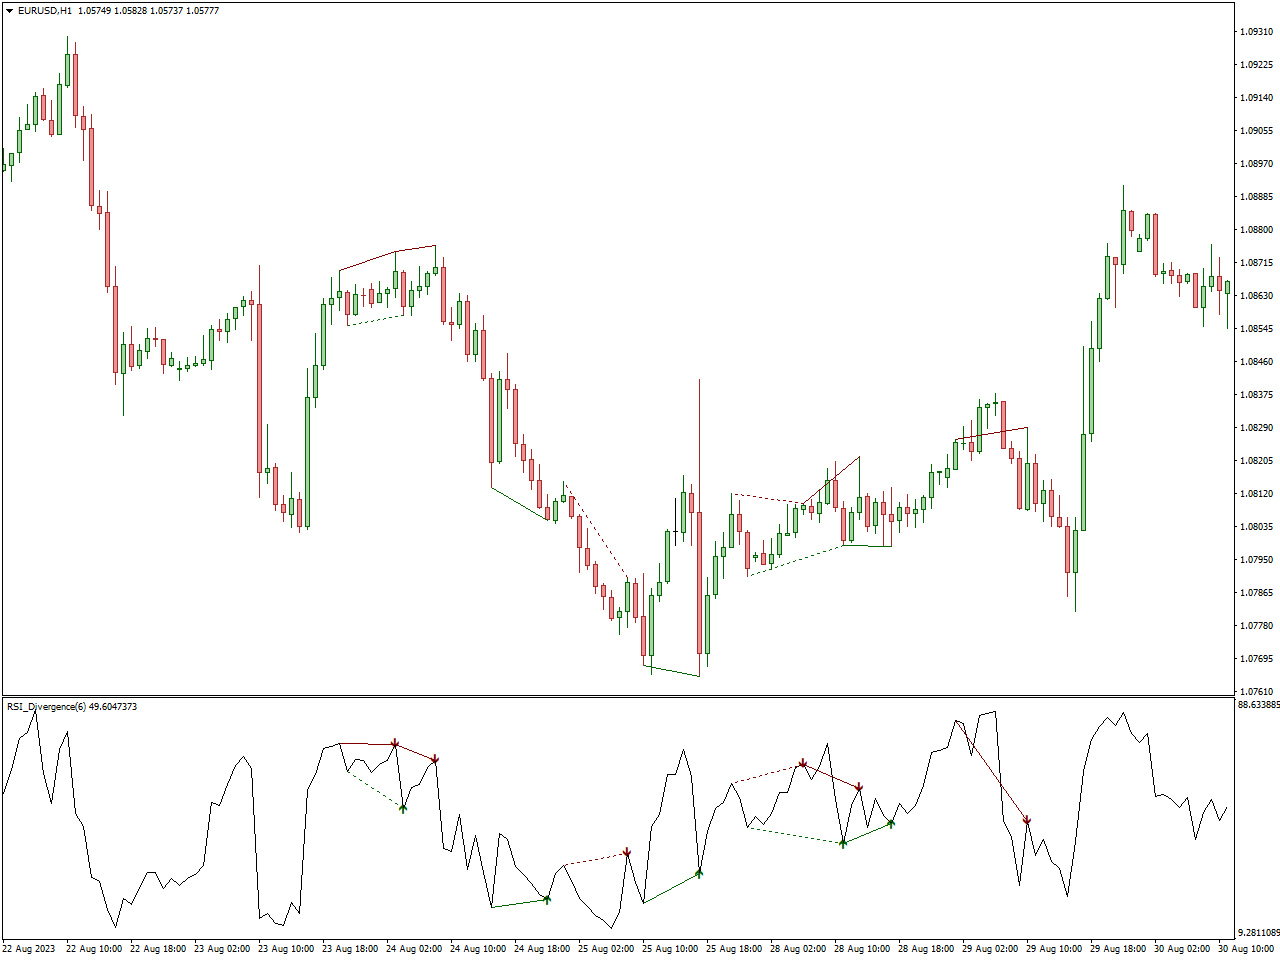
RSI divergence, a widely embraced concept in technical analysis, serves as a tool for traders to recognize potential shifts in market trends. It manifests when the price of an asset and the Relative Strength Index (RSI) move in opposing directions. This divergence can be categorized into two primary types: bullish and bearish.
In a bullish RSI divergence scenario, the asset’s price establishes a new low while the RSI does not validate this low, instead forming a higher low. This discrepancy indicates that although the price is reaching new lows, the downward momentum is losing strength, possibly indicating an impending reversal towards the upside.
Conversely, a bearish RSI divergence unfolds when the price achieves a new high, yet the RSI fails to confirm this high and, instead, establishes a lower high. This suggests that while the price is reaching new highs, the upward momentum is waning, potentially signaling a forthcoming reversal towards the downside.
Best Moving Average Indicator
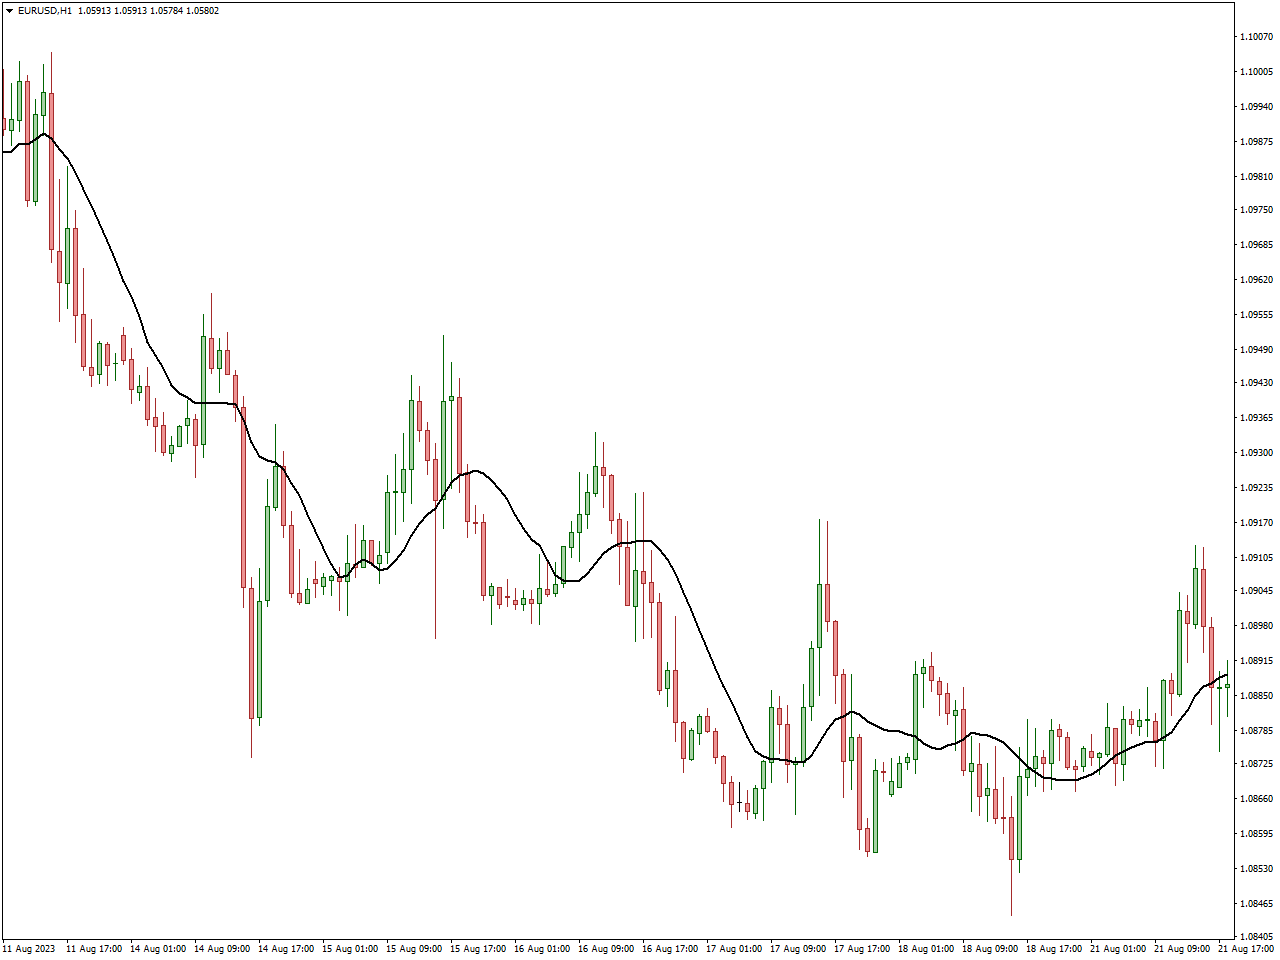
In the domain of gold trading, the Moving Average (MA) emerges as a pivotal tool for traders aiming to maneuver through the intricacies of the precious metal market. Whether opting for the Simple Moving Average (SMA) to gain a comprehensive trend perspective or the Exponential Moving Average (EMA) for more immediate analysis, these indicators prove instrumental in recognizing trends and potential reversal points specific to gold values.
For those engaged in gold trading, MAs assume a notable role in interpreting market trends and establishing dynamic support or resistance levels. A gold price surpassing the moving average may signify an upward trend, while a position below could indicate a downward trend. Moreover, these moving averages function as indispensable instruments for gold traders to pinpoint potential entry or exit points, aligning their strategies with the current market conditions.
In summary, in the realm of gold trading, the Moving Average stands out as an indispensable technical indicator. It equips traders with insights into trend direction, support/resistance dynamics, and strategic entry/exit opportunities, offering a nuanced approach to navigating the distinctive features of the gold market. Whether concentrating on short-term fluctuations or long-term trends, the inclusion of moving averages in a gold trading strategy enhances a trader’s capacity to make informed decisions and adapt to the ever-evolving landscape of precious metal prices.
Gold Level indicator
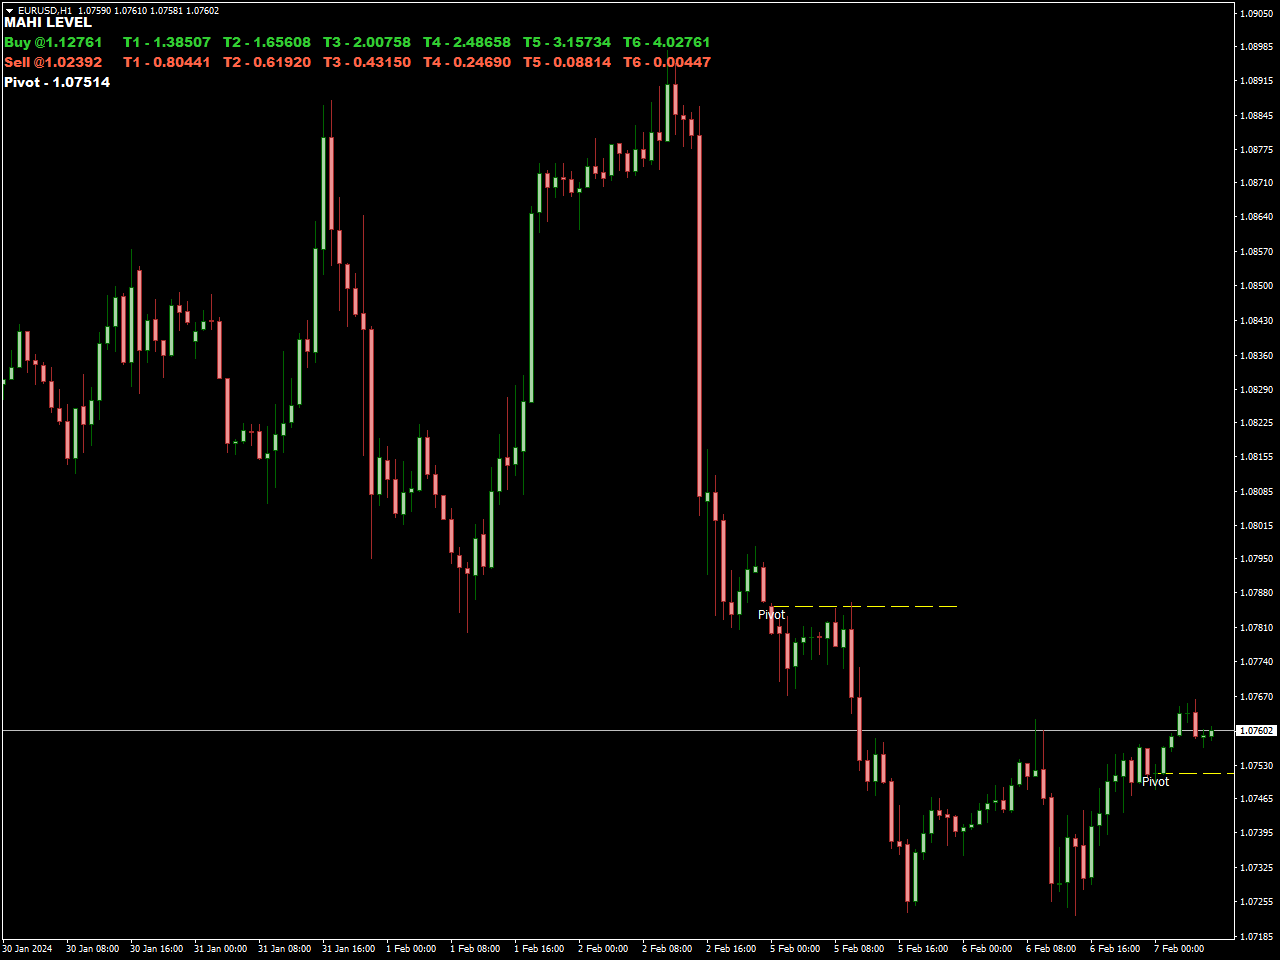
Utilizing the Gold Level indicator is remarkably straightforward, as it clearly presents pivot, buy, and sell points. The pivotal point holds a central role in your trading strategy. To execute trades, simply enter a buy position when the market reaches the buy point and exit with a sell order when the market touches the sell level.
This indicator extends its utility by offering up to six target levels for take profit. Consequently, traders can access six buy targets (BT1, BT2, BT3, etc.) and six sell targets (ST1, ST2, and so forth). The versatility of these target levels accommodates various trading styles. Scalpers may find the initial buy target (BT1) and sell target appealing, while day traders can tailor their choices based on risk tolerance. Meanwhile, higher target levels suit the preferences of swing and long-term traders.
For strategic trade exits, traders can consider using subsequent resistance and support levels for profit-taking, with recent highs and lows serving as potential stop-loss markers. Alternatively, employing a 1:3 risk-reward ratio can guide trade exit decisions.
Recognized as one of the premier indicators for gold traders, the Gold Level indicator not only delivers buy and sell signals but also takes it a step further by providing well-defined profit targets. Whether you identify as a scalper or a long-term trader, this indicator stands out as an invaluable tool to include in your trading toolkit.
Stochastic Cross Alert Indicator
When utilized in the context of gold trading, the Stochastic Cross Alert Indicator emerges as a valuable instrument for traders aiming to pinpoint potential trend reversals and strategically time their entries or exits in the precious metal market. This indicator leverages the stochastic oscillator, a momentum-based tool, to generate signals based on the crossover of its %K and %D lines.
In the realm of gold trading, a bullish crossover, characterized by the %K line crossing above the %D line, can serve as an indication of a potential upward movement in gold prices. Conversely, a bearish crossover, wherein the %K line crosses below the %D line, may suggest a possible downturn. Equipped with an alert system, the Stochastic Cross Alert Indicator ensures that traders receive timely notifications when these crossovers transpire, empowering them to make swift decisions in response to evolving market conditions.
FXSSI.TradingSessions
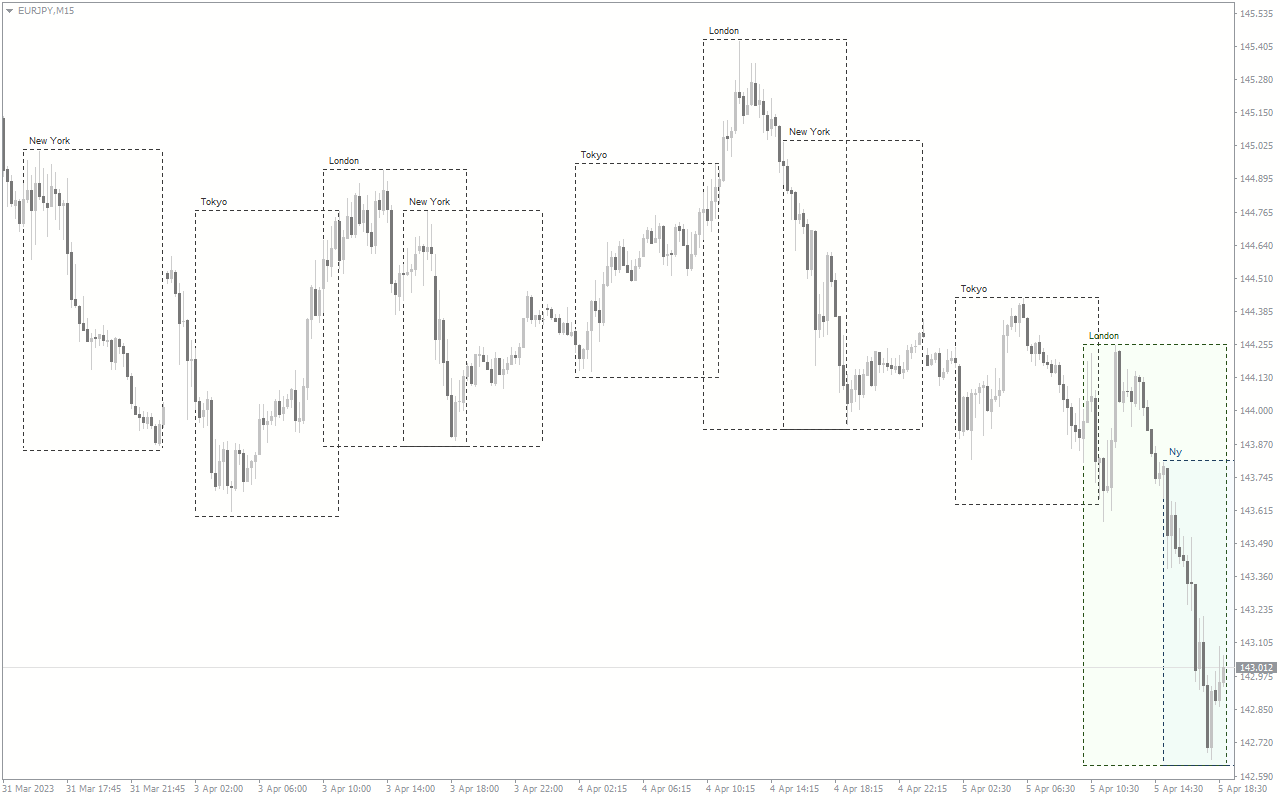
A frequently encountered feature within trading platforms, particularly within the context of gold trading, is the TradingSessions indicator. This tool visually represents the distinct trading sessions occurring over a 24-hour period in the continuous operation of the gold market. Despite its uninterrupted nature, the gold market is segmented into key sessions, such as Tokyo, London, and New York. The indicator often utilizes color-coded or shaded overlays on price charts to demarcate these sessions, aiding traders in identifying when specific financial centers actively participate in the gold market.
The daily trading cycle kicks off with the Tokyo Session, also known as the Asian session, starting around 7:00 PM (EST). Subsequently, the London Session, or European session, takes charge at approximately 3:00 AM (EST), followed by the New York Session, or North American session, commencing around 8:00 AM (EST). Recognizing the overlapping periods between these sessions becomes crucial for gold traders, aligning with heightened market activity and potential volatility. Armed with this understanding, traders can optimize their strategies, making well-informed decisions based on the varying levels of liquidity and price fluctuations during distinct sessions in the gold market.
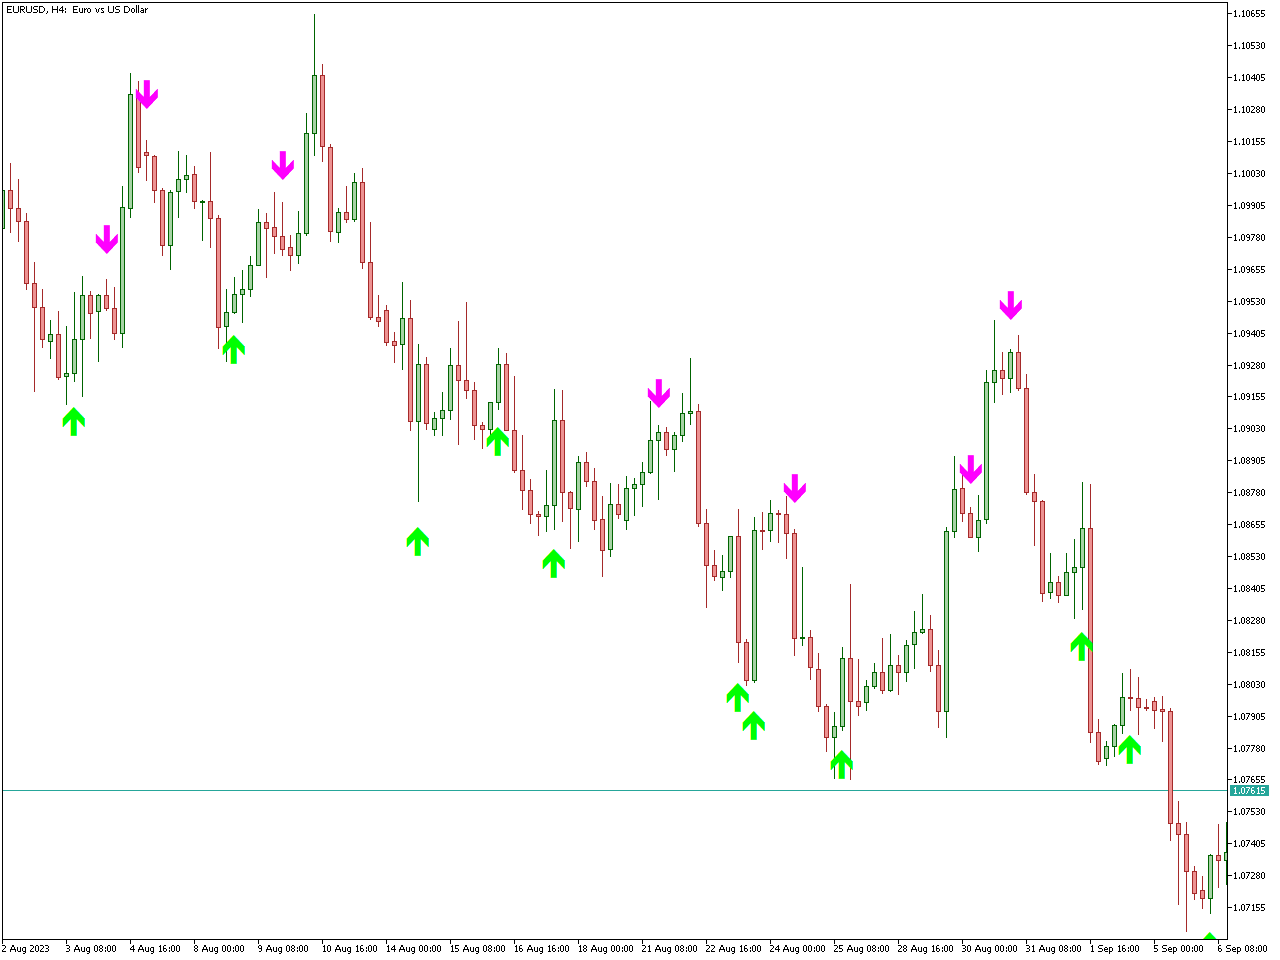
MTF High Low Indicator
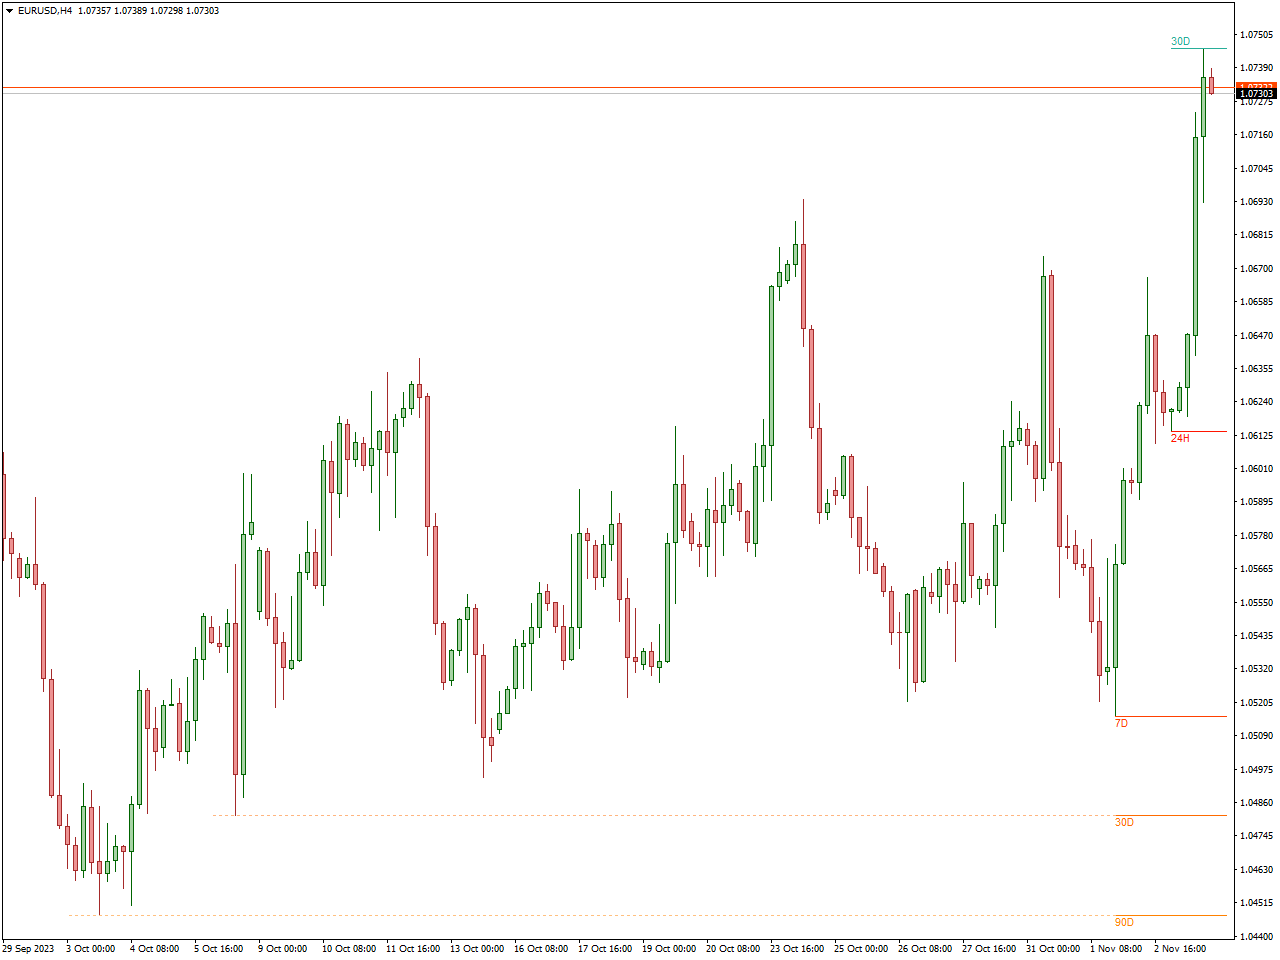
The High-Low Indicator is a commonly used tool in financial trading that helps traders identify the highest and lowest prices of an asset over a specified period. It provides valuable information about the price range and can be useful for various trading strategies.
This indicator typically plots lines on a price chart, indicating the highest and lowest prices reached during a specific time frame. Traders often customize the period to match their trading preferences, such as daily, weekly, or monthly highs and lows.
One common application of the High-Low Indicator is to identify potential support and resistance levels. The highest price represents a resistance level, while the lowest price acts as support. Traders may use these levels to make informed decisions about entry and exit points, as well as to set stop-loss and take-profit levels.
Additionally, the High-Low Indicator can be used to assess market volatility. A wider price range between the high and low points may suggest higher volatility, while a narrower range could indicate lower volatility. Traders can adjust their strategies based on the observed volatility, adapting to market conditions accordingly.
OBV Indicator
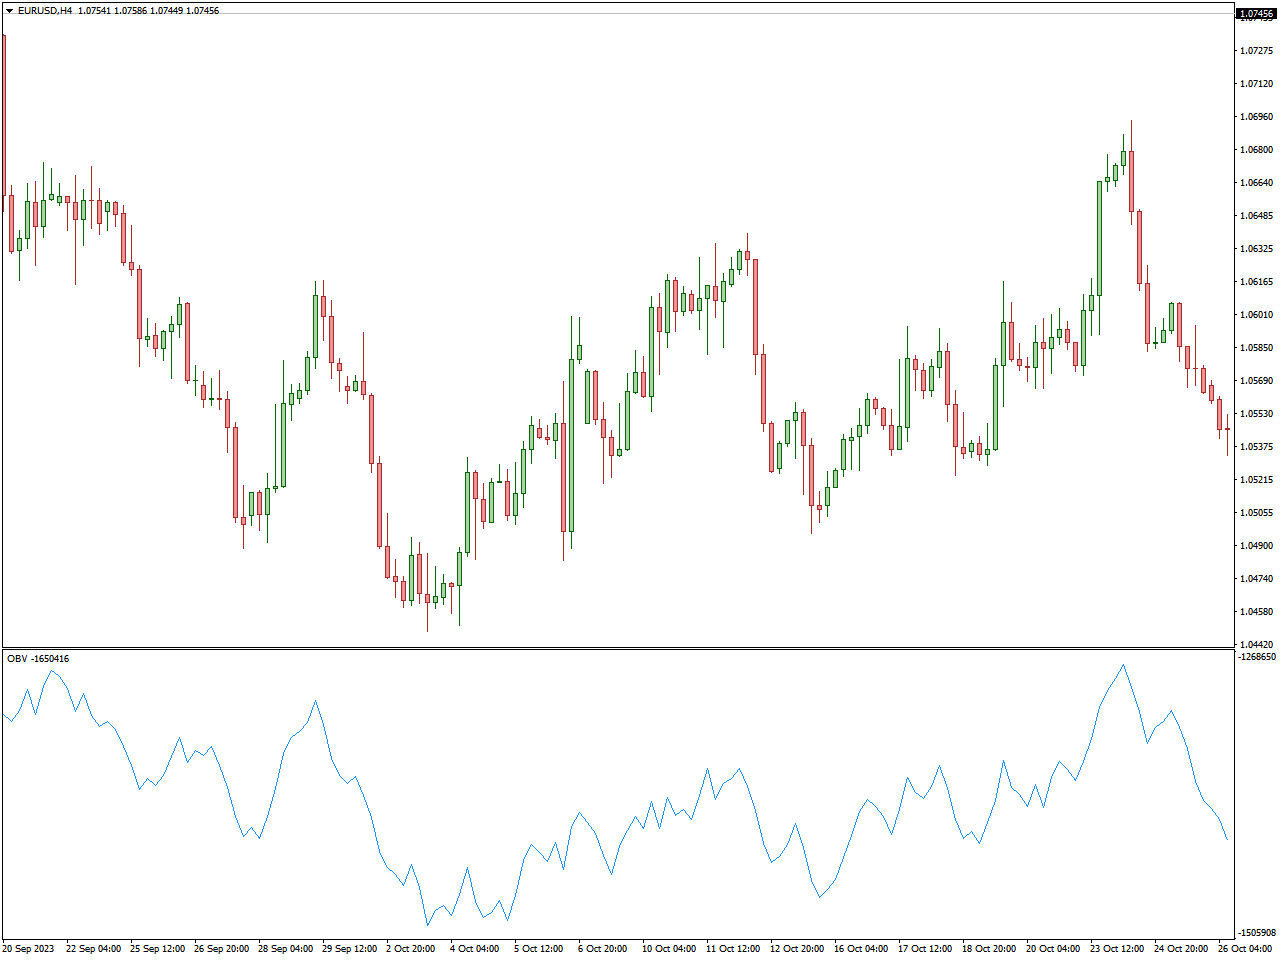
Developed by Joseph Granville, the On-Balance Volume (OBV) indicator is a momentum-driven instrument utilized in technical analysis. It evaluates the cumulative volume of an asset over a specific timeframe, offering insights into potential price movements. The calculation involves adding volume on days with higher closing prices and subtracting volume on days with lower closing prices. The resulting cumulative line aids traders in gauging the strength of a price trend.
Traders leverage the OBV indicator for various purposes. It confirms trends by aligning with price movements, signaling increased buying volume during uptrends and escalating selling volume during downtrends. Divergence analysis, where the OBV line deviates from price movements, can indicate potential trend reversals. For instance, a rising price coupled with a falling OBV may suggest diminishing buying interest and an imminent trend reversal. Furthermore, the OBV indicator facilitates the identification of volume breakouts, highlighting robust buying interest when prices achieve new highs alongside a surge in OBV.
MACD Divergence Indicator
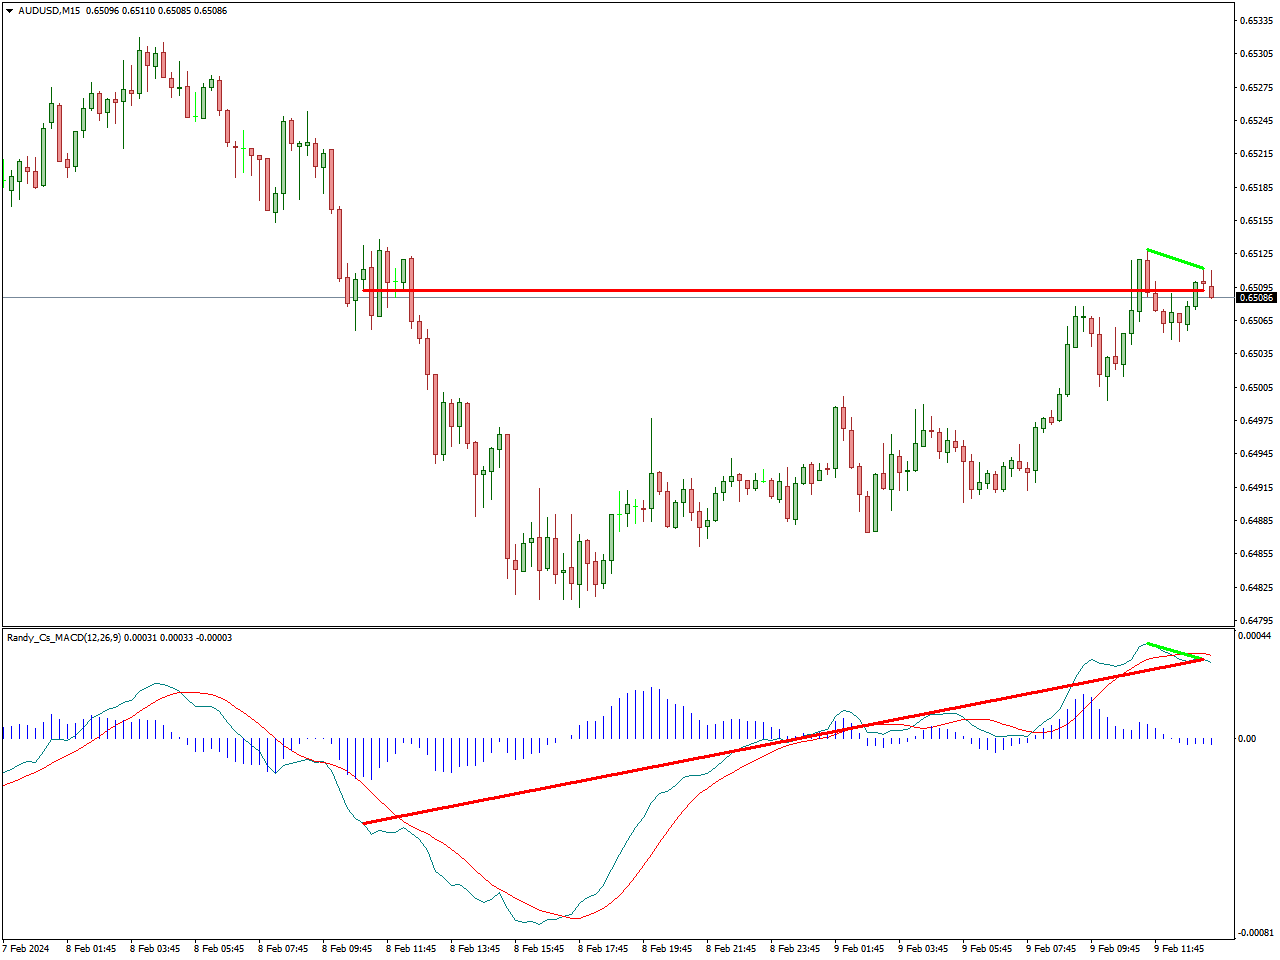
Within the realm of gold trading, the MACD (Moving Average Convergence Divergence) Divergence Indicator proves itself as a valuable tool for traders maneuvering through the intricacies of precious metal markets. This indicator, honing in on divergences between the MACD and price movements, stands out as a pivotal instrument for detecting potential reversals in gold price trends.
Bullish divergence, exemplified by the price establishing a new low while the MACD fails to confirm it, can signify a weakening downtrend and a potential reversal to the upside in the gold market. Conversely, bearish divergence, marked by a new high in price without MACD confirmation, hints at potential weakening of the uptrend and a conceivable reversal to the downside in gold trading, which in turn allows for scalping on XAUUSD.
Money Flow Index Indicator (MFI)
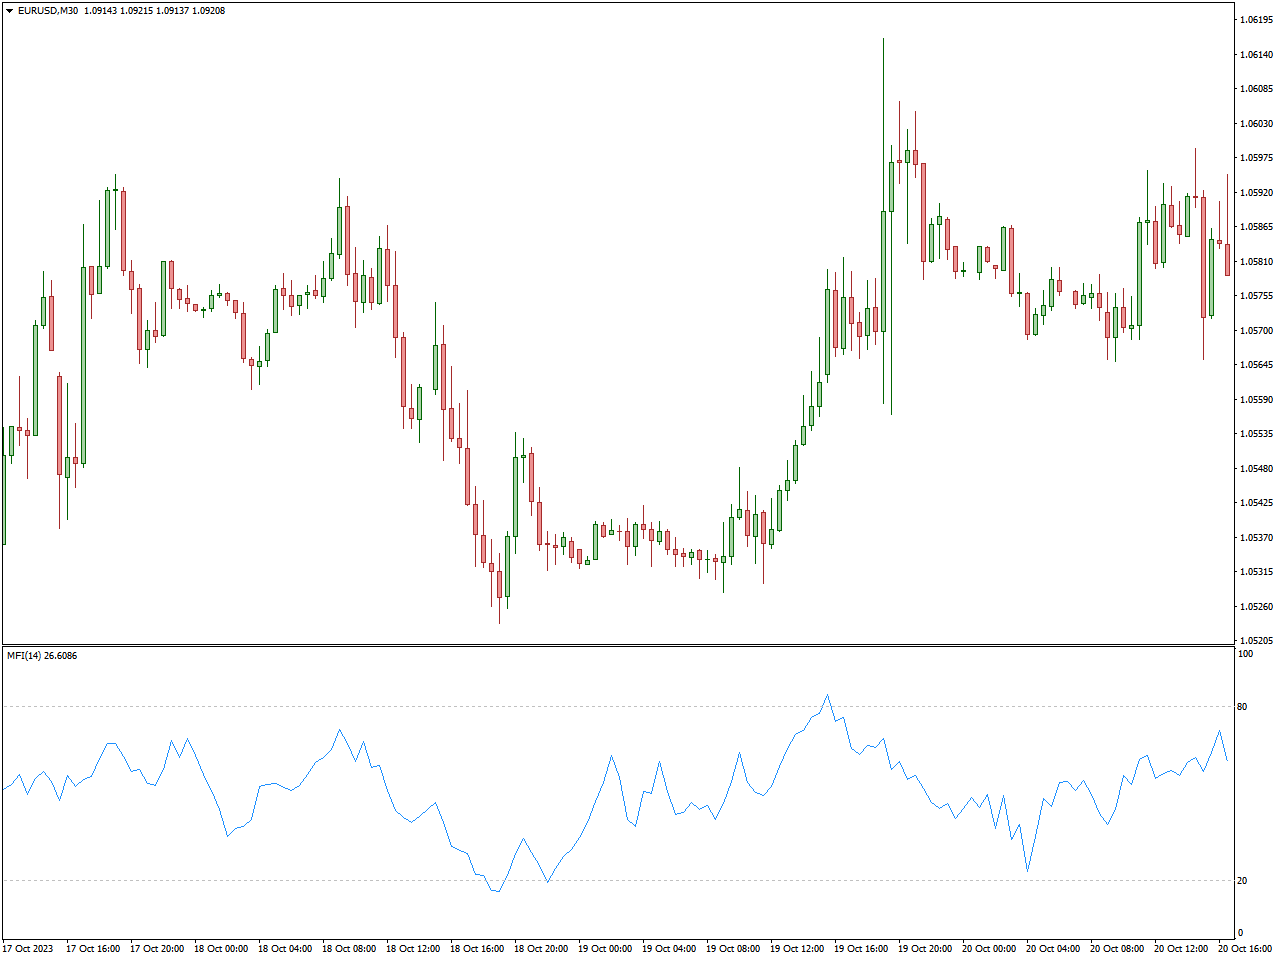
The Money Flow Index (MFI) Indicator, crafted by Gene Quong and Avrum Soudack, stands as a widely employed instrument in the realm of technical analysis. It amalgamates price and volume data to evaluate the dynamics of buying and selling pressure within the market. The MFI calculation entails determining the average price of an asset over a specific period, multiplying it by the corresponding volume, and subsequently comparing positive and negative money flow to derive the index.
Traders frequently utilize the MFI to pinpoint overbought or oversold conditions, akin to the Relative Strength Index (RSI). An MFI surpassing a predetermined threshold indicates potential overbought conditions, hinting at a prospective reversal to the downside. Conversely, an MFI below a designated level may suggest oversold conditions, signaling a potential reversal to the upside.
Divergence analysis represents another application of the MFI, where disparities between price trends and MFI trends may serve as a precursor to an impending shift in the prevailing trend. Furthermore, the MFI plays a role in confirming the strength of an ongoing trend. A rising MFI during an uptrend signifies robust buying pressure, while a falling MFI amid a downtrend suggests heightened selling pressure.
In the context of gold trading, divergence analysis represents another application of the MFI, where disparities between price trends and MFI trends may serve as a precursor to an impending shift in the prevailing trend. Furthermore, the MFI plays a role in confirming the strength of an ongoing trend in gold. A rising MFI during an uptrend signifies robust buying pressure for gold, while a falling MFI amid a downtrend suggests heightened selling pressure.
Better Volume
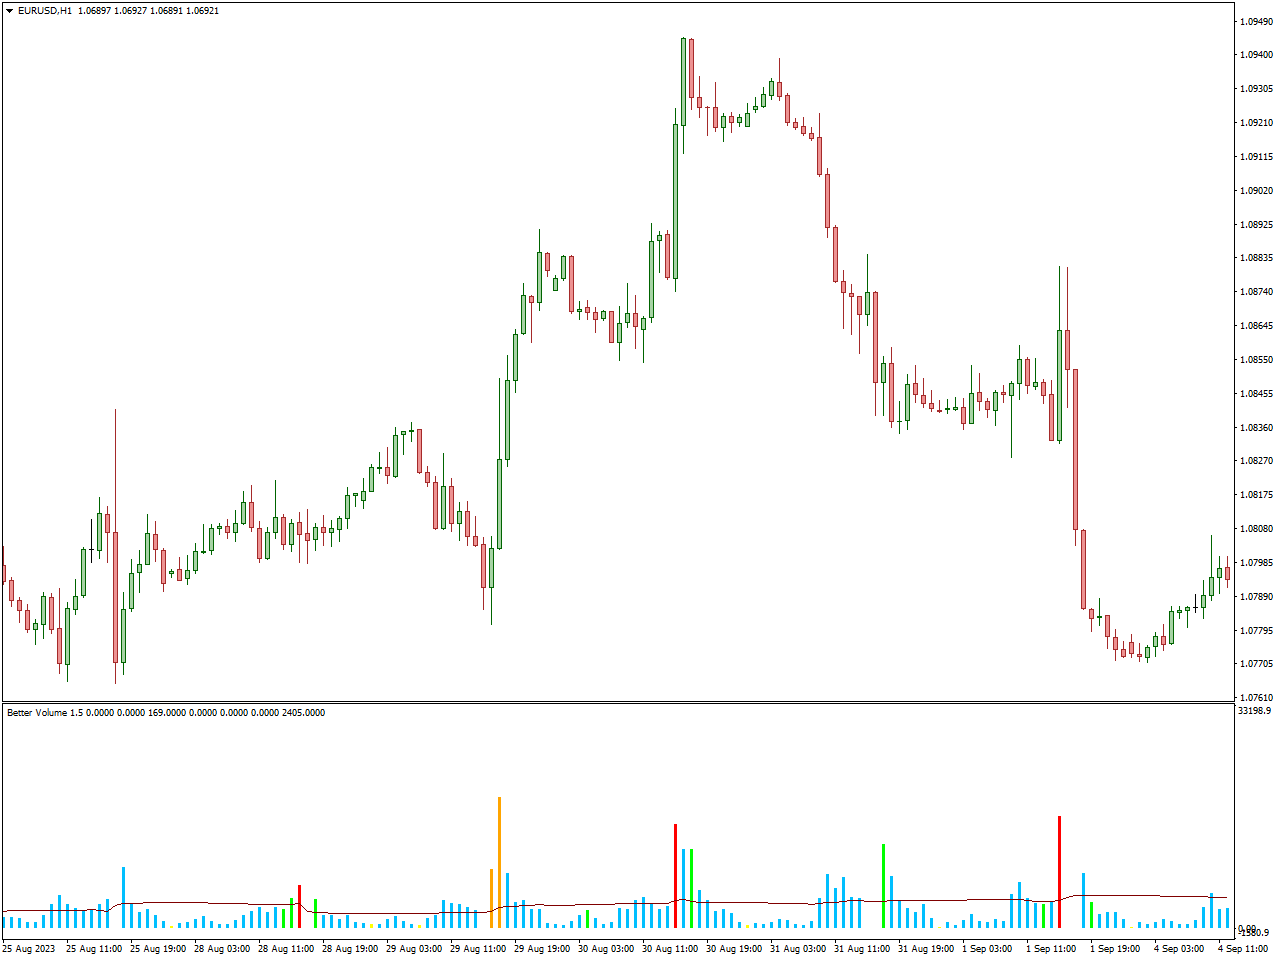
The indicator showcases vertical bars in blue, yellow, green, red, and white, with blue bars indicating standard trade volumes, signifying a quiet market unlikely to prompt a significant trend change. A yellow bar, with notably low volume and height, often coincides with the completion of the current trend or the end of market retracement.
A green bar, indicating substantial volumes, may suggest a potential change in trend direction, especially when large hedge funds are active. However, an immediate and sharp reversal is not guaranteed, as market inertia may delay the price shift.
A red bar, distinguished by its height, signifies buyer dominance, often seen when buyers enter the market swiftly. It may precede a shift from bearish to bullish or a substantial bullish retracement.
A white bar, akin to the red one, signals a surge in seller activity. It may precede a market reversal to the downside, following an uptrend or a deep bearish retracement.
The Better Volume indicator diagram incorporates a moving average to normalize volume bars based on their height.
In the context of gold trading, the Better Volume indicator proves beneficial by offering a straightforward basis for developing trading systems. Despite its simplicity, it taps into fundamental data—trading volumes—which significantly impact price direction and trend formation, providing valuable insights for traders navigating the dynamic landscape of gold markets.
Conclusion
In summary, achieving mastery in the nuances of gold trading is within reach through the strategic incorporation of our Top 10 Indicators. Whether your goal is trend identification, market sentiment assessment, or efficient risk management, these indicators prove to be indispensable tools for traders of all proficiency levels. Armed with a broad spectrum of insights, you are aptly prepared to navigate the dynamic terrain of the gold market, enabling you to make informed decisions and enhance your overall trading performance. Embrace the influence of these indicators, propelling yourself into a journey marked by elevated success in the realm of gold trading.