

Embarking on the ever-shifting landscape of financial markets demands a keen understanding of evolving trends and patterns. Amidst this intricate environment, traders deploy a myriad of tools, among which lagging indicators emerge as indispensable elements. While these indicators lack predictive qualities, they play a pivotal role in corroborating trends, providing insights, and offering a comprehensive perspective on market dynamics. In our exploration of the top 7 lagging indicators, we delve into these essential tools that empower traders to unravel the intricate dance of market movements, facilitating informed decision-making.
Within the expansive toolkit at traders’ disposal, lagging indicators carve out a distinct niche by offering a retrospective lens for interpreting price action. Despite their inability to predict future market movements, these indicators serve as reliable confirmatory signals, aiding traders in validating trends and pinpointing potential reversal points. Whether it’s Moving Averages smoothing out price fluctuations or oscillators identifying overbought or oversold conditions, each lagging indicator brings a unique perspective to traders’ analytical arsenals. Throughout this guide, we unravel the complexities of the top 7 lagging indicators, shedding light on their individual strengths and applications in the ever-evolving realm of financial markets.
The significance of lagging indicators lies in their ability to act as invaluable guides for traders seeking a comprehensive understanding of market trends. As we delve into the exploration of the top 7 lagging indicators, our aim is to reveal the power these indicators hold in providing traders with a retrospective analysis of price movements. This knowledge forms a solid foundation upon which well-considered trading decisions can be crafted. Join us on this journey through the nuances of lagging indicators, where each tool contributes to a deeper understanding of market dynamics, empowering traders to navigate the intricacies of financial markets with heightened confidence and precision.
Top 7 Lagging Indicators
- RSI Heatmap Indicator
- Order Block Breaker Indicator
- Commodity Channel Index (CCI) Indicator
- Auto Fibonacci Retracement Indicator
- FXSSI.ProfitRatio
- Moving Average Indicator
- Keltner Channel Indicator
RSI Heatmap Indicator
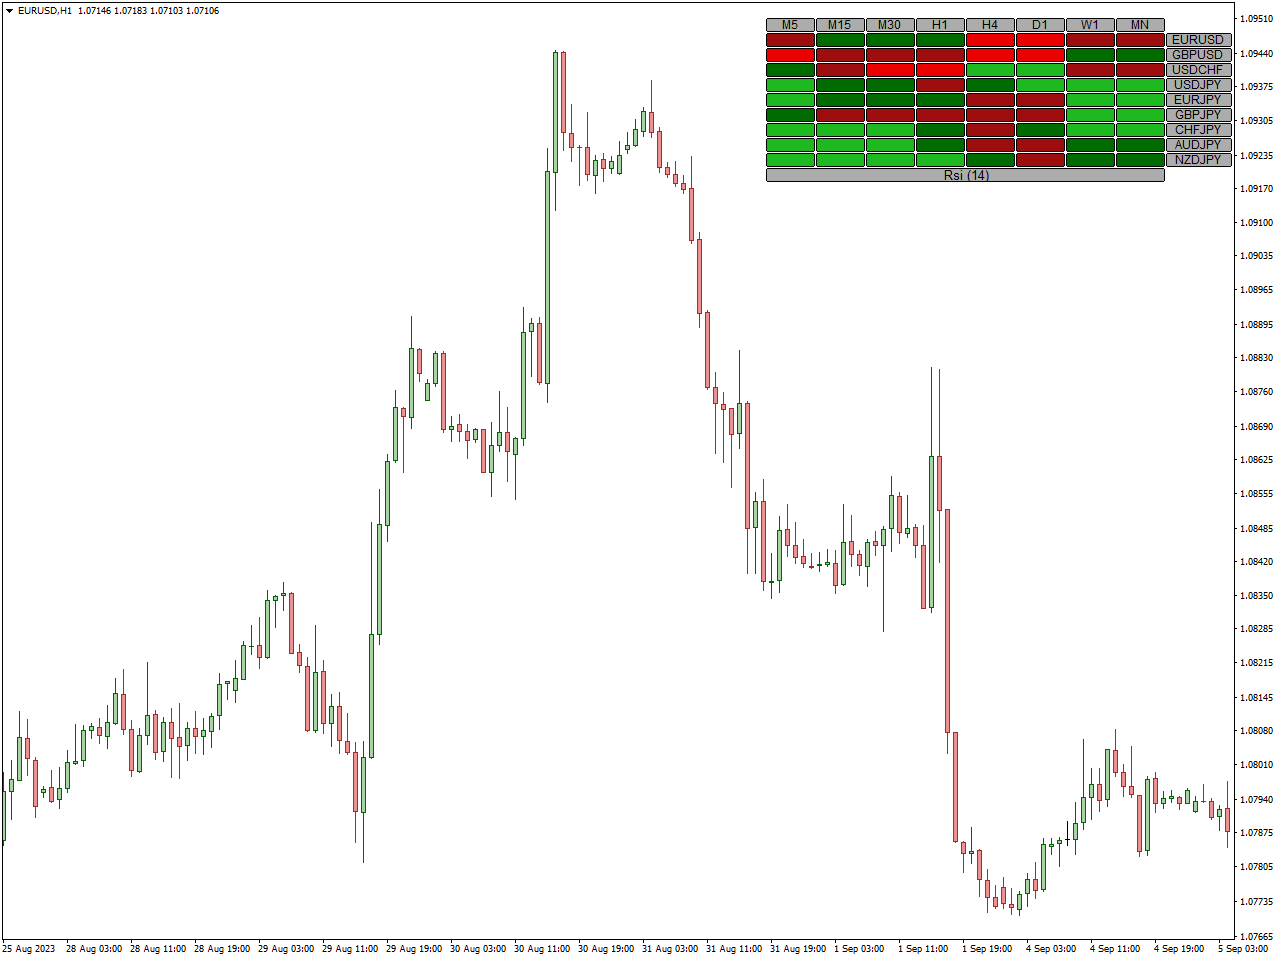
The MT4/MT5 RSI Heatmap indicator is a valuable tool for Forex traders seeking to assess the strength of a currency pair. Utilizing the Relative Strength Index (RSI), this currency strength meter accurately gauges the strength of currencies. It generates a comprehensive heatmap featuring multiple currencies and timeframes, facilitating effective monitoring and interpretation.
Distinct colors within the currency strength heatmap precisely represent different strengths. With four distinct strengths determined by RSI values and price movement direction, these colors offer traders a real-time, clear understanding of currency strength dynamics.
In an upward market movement, traders may consider placing a BUY order when the heatmap transitions from Green to Lime green. This change in color signifies a shift in currency strength from weak to strong. Conversely, during a downward movement, a SELL order becomes an option when the color transitions from Fire Brick to Red, indicating a change from strength to weakness in the currency.
Order Block Breaker Indicator
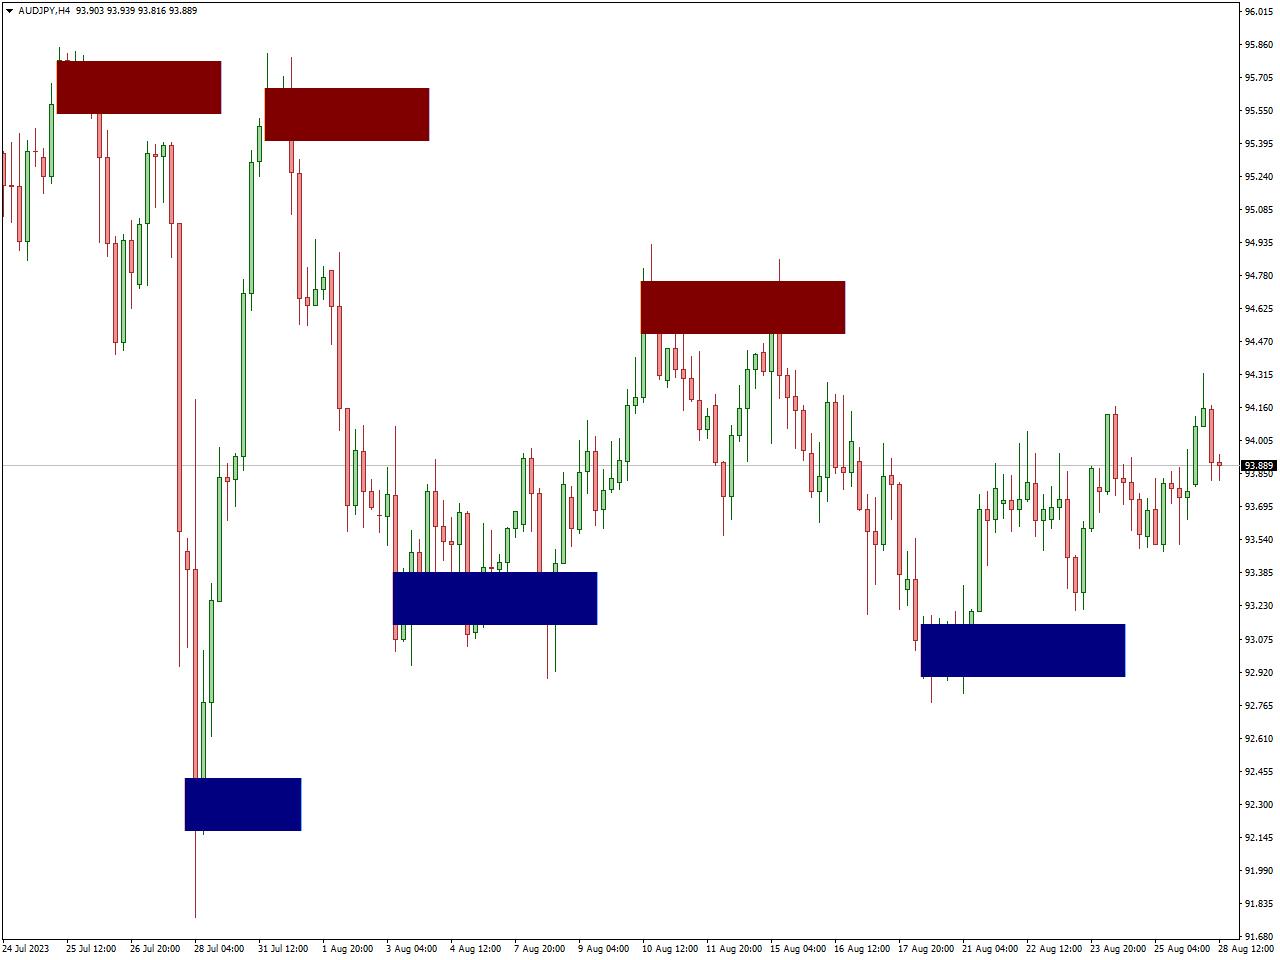
The Order Block Breaker Indicator is a widely utilized trading tool designed to identify potential shifts in trends. This indicator specifically targets “order blocks,” which are significant levels on a price chart representing areas where substantial institutional orders were previously executed.
When the price approaches or breaches these order blocks, it serves as a potential signal for important changes in market sentiment and potential shifts in the existing trend. The primary objective of the Order Block Breaker Indicator is to assist traders in recognizing these crucial zones, offering insights into potential entry or exit points.
Traders commonly integrate this indicator with other technical analysis tools to validate signals and enhance the overall accuracy of their trading decisions. By identifying and comprehending order blocks, traders seek to gain an advantage in anticipating market movements and adjusting their strategies effectively.
Commodity Channel Index (CCI) Indicator
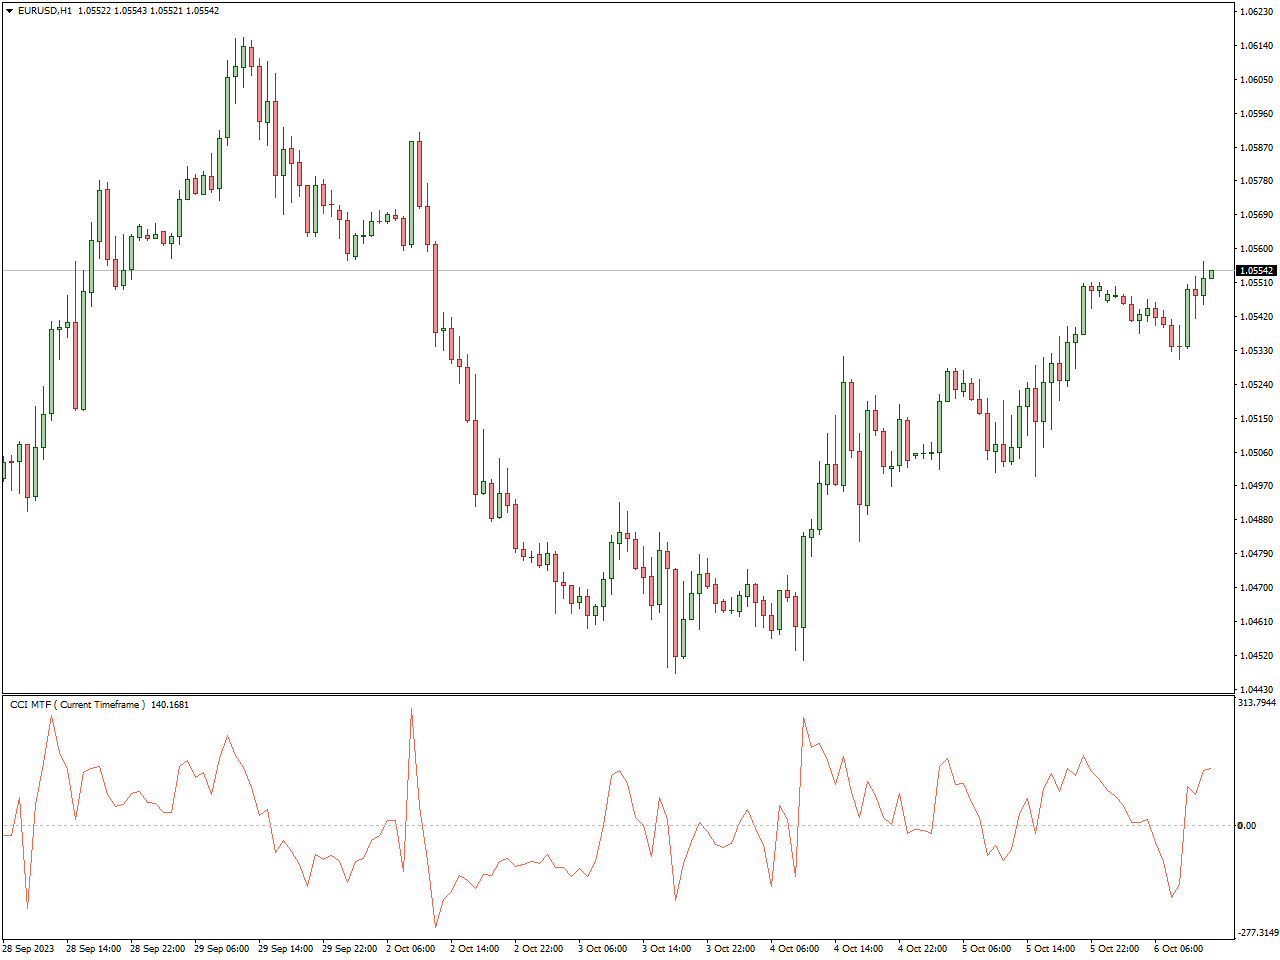
The Commodity Channel Index (CCI) Indicator, crafted by Donald Lambert, is a widely employed instrument in technical analysis. Its primary purpose is to assist traders in appraising the strength and potential reversals within the price trend of a financial instrument. The CCI achieves this by calculating the variance between the asset’s typical price and its simple moving average, subsequently normalizing it through the mean absolute deviation. This process generates an oscillating indicator that fluctuates above and below a baseline, typically positioned at ±100, thereby signaling overbought or oversold conditions.
Traders often use the CCI to recognize overbought or oversold market conditions, detect disparities between the indicator and price changes, and evaluate the strength of an ongoing trend. In the realm of trading a specific commodity, the CCI Indicator becomes crucial for traders seeking to interpret possible changes in trends and evaluate the strength of price movements. By seamlessly incorporating the CCI into their analytical toolkit, traders in this particular market can enhance their capacity to make well-informed decisions on when to enter or exit, ultimately improving their ability to navigate the dynamic landscape of that specific market.
Auto Fibonacci Retracement Indicator
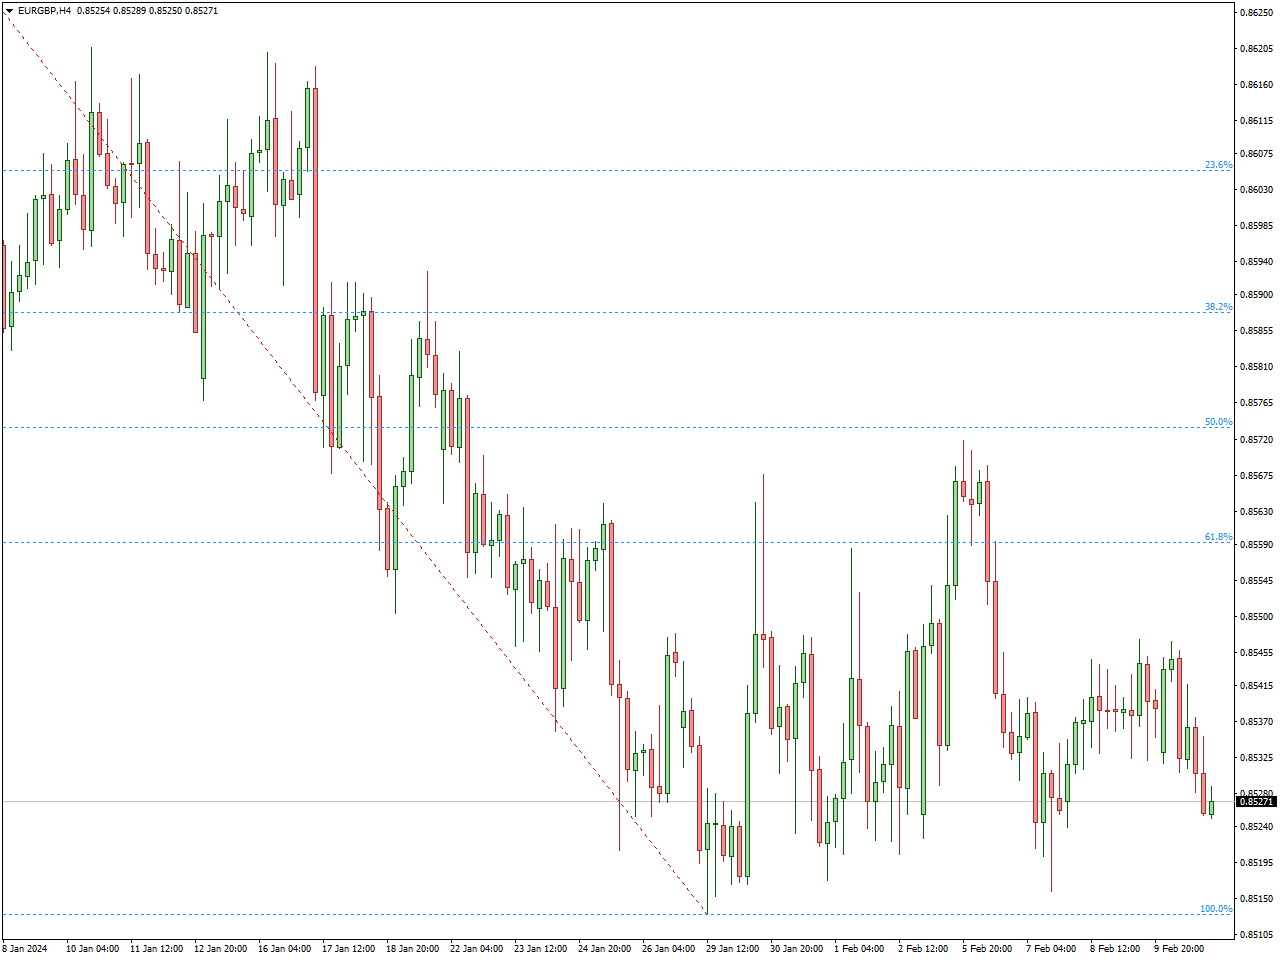
The Fibonacci retracement is a valuable tool in technical analysis, utilizing a sequence of numbers (0, 1, 1, 2, 3, 5, 8, 13, and so forth) to create Fibonacci ratios. These ratios, derived by dividing adjacent Fibonacci numbers, are then plotted on a price chart. Identifying the highs and lows of the chart is a prerequisite for utilizing this indicator, a task that can be intricate and prone to errors, particularly for those less acquainted with the tool. Fortunately, the Auto Fibonacci Retracement indicator for Mt4 alleviates this challenge. As its name suggests, this indicator automatically plots on the chart, identifying highs and lows without the need for explicit user input.
Auto Fibonacci Retracement plots retracement levels between 0 and 100%, adjusting based on market conditions. In a bearish market, the zero is positioned at the top and 100 at the bottom, and vice versa in a bullish market. Typically, after reaching a new high, the market retraces to various Fibonacci levels. Traders can strategize by waiting for a retracement to a specific Fibonacci level, such as 38.2%, before entering a buy position. Stop-loss placement can be informed by swing lows or 50% Fibonacci levels, while take-profit levels may be set at the next high or resistance point.
The attractiveness of certain Fibonacci levels is notable; for instance, the 50% Fibonacci level is frequently reached during price movements, but the 61.8% level is highly favored by traders due to its potential for substantial pullbacks. Similarly, the 78.6% level often serves as a noteworthy reversal point, although it tends to be overlooked by many. In addition to facilitating pullback trading, Fibonacci levels offer advantageous take-profit levels when riding a trend. The Auto Fibonacci Retracement indicator simplifies the plotting of these levels, although it doesn’t provide entry and exit signals by itself. Thus, combining this indicator with other tools for confluence is recommended for a more comprehensive trading strategy.
FXSSI.ProfitRatio
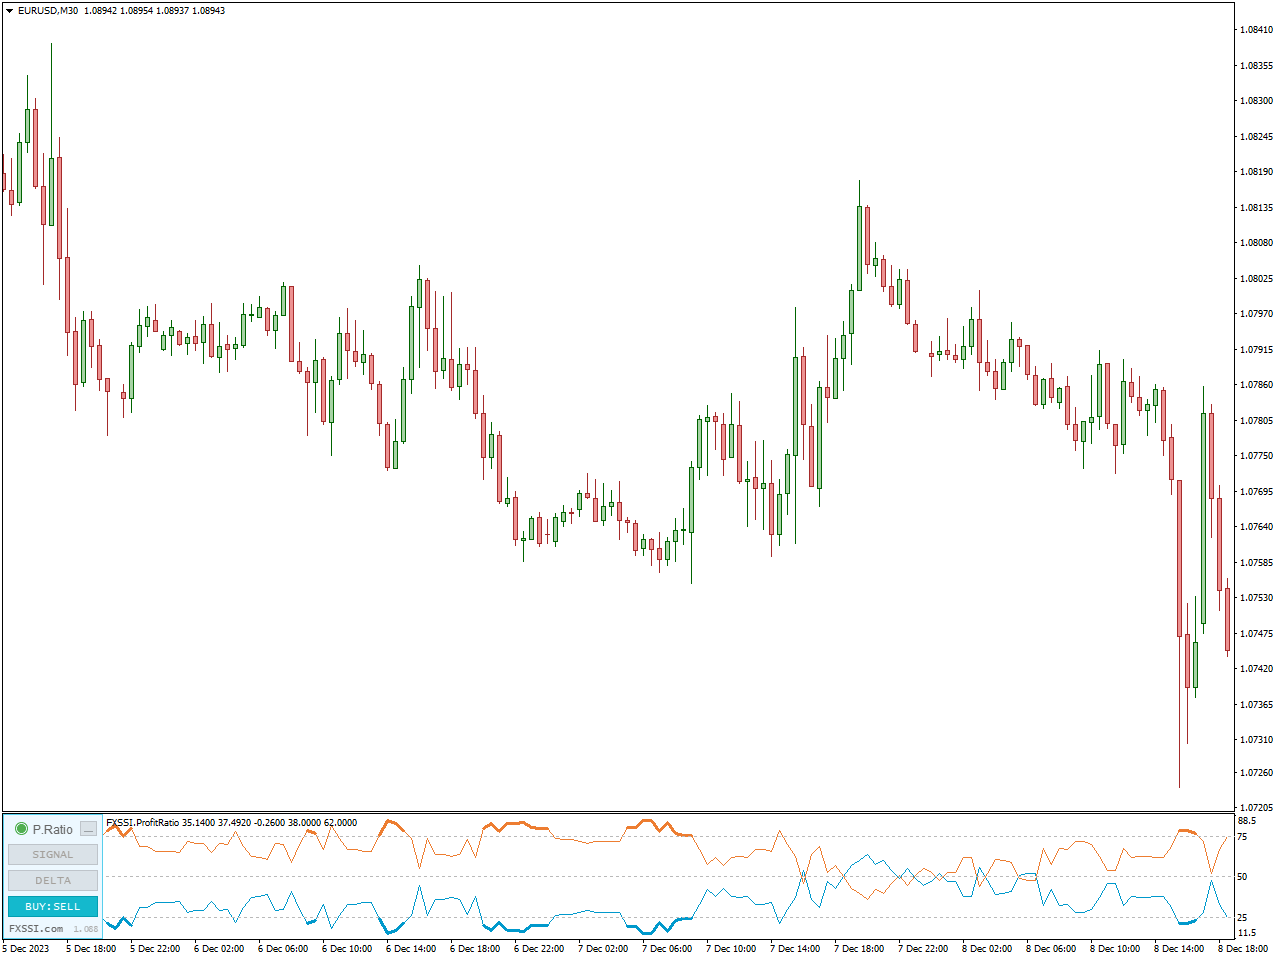
The Profit Ratio indicator offers insights into the ratio of successful trades compared to unsuccessful ones within currently active positions. This indicator affirms the rise in successful traders as an established occurrence, and this, consequently, can influence subsequent price movements.
When a notable increase in the Profit Ratio is observed over the most recent candlesticks, it implies that the current trend is deceptive, signaling an impending price reversal.
This observation aligns with classical market theory, suggesting that a significant number of successful traders closing their positions exert pressure on the price, leading to a movement in the opposite direction.
In accordance with the speculative theory of market behavior, the reversal in price can be attributed to the notion that, before a major price movement, a prominent market participant initiates a subtle maneuver in the opposite direction.
Moving Average Indicator
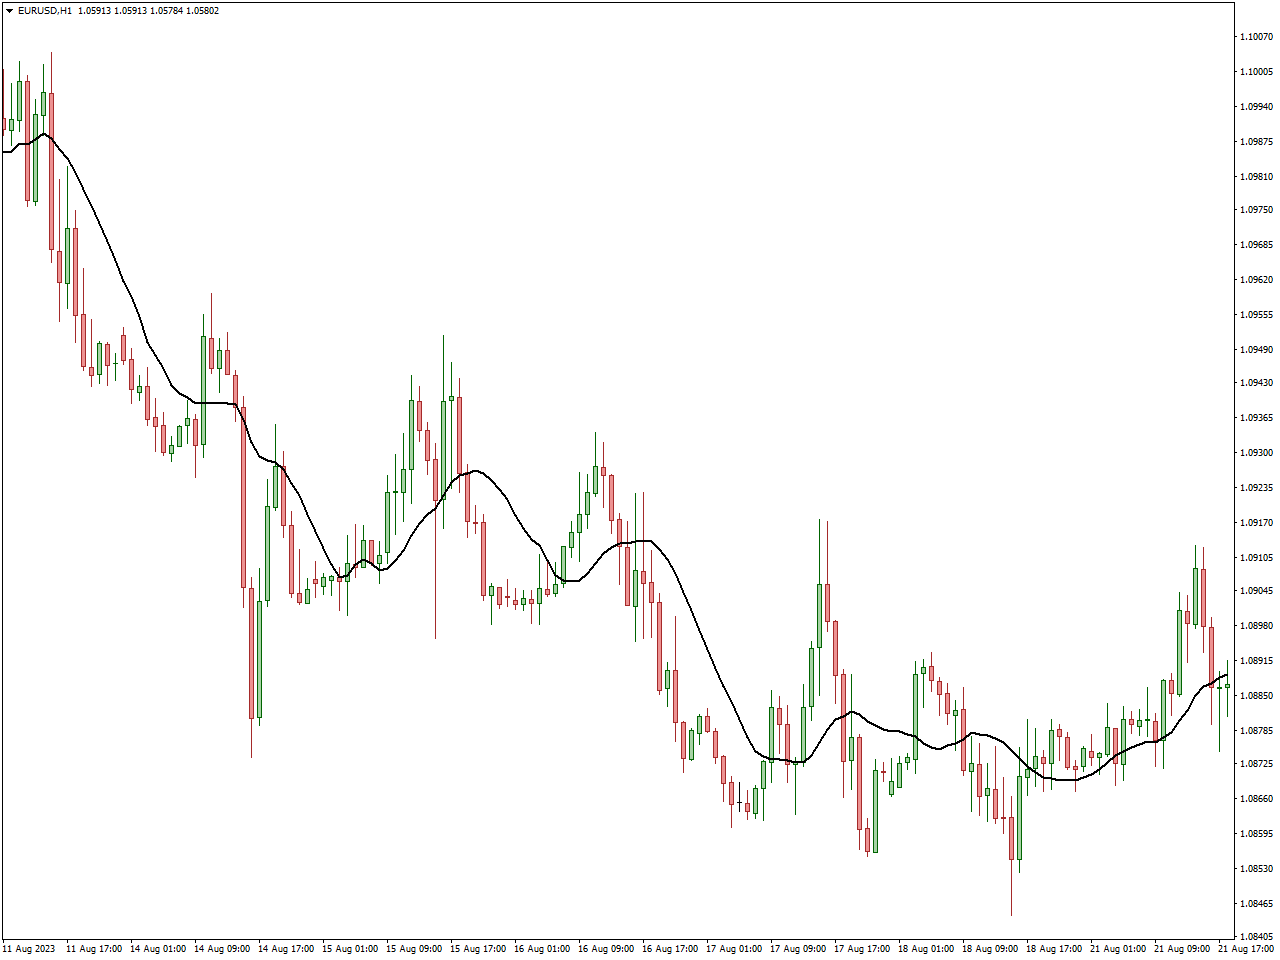
The Moving Average (MA) Indicator stands as a fundamental tool in technical analysis, widely utilized by traders to gauge the direction and strength of a price trend. It accomplishes this by creating a continually updated average, smoothing out price data and offering a clearer representation of the underlying trend over a specified period.
Traders commonly deploy two primary types of moving averages: the Simple Moving Average (SMA) and the Exponential Moving Average (EMA). The SMA treats all data points equally, providing a straightforward average, while the EMA assigns greater weight to recent prices, rendering it more responsive to current market conditions.
Moving Averages serve diverse purposes in trading, aiding in the identification of trends, potential reversal points, and areas of support or resistance. A crossover where the current price moves above the moving average may signal an upward trend, while a position below could indicate a downward trend. Furthermore, moving averages contribute to the smoothing of price fluctuations, offering a clearer perspective on the overall trend direction.
In essence, the Moving Average Indicator proves indispensable for traders, empowering them to comprehend market trends, pinpoint potential entry or exit points, and adapt strategies according to prevailing market conditions. Whether focusing on short-term fluctuations or long-term trends, the incorporation of moving averages enriches a trader’s capacity to make well-informed decisions in the dynamic realm of financial markets.
Keltner Channel Indicator
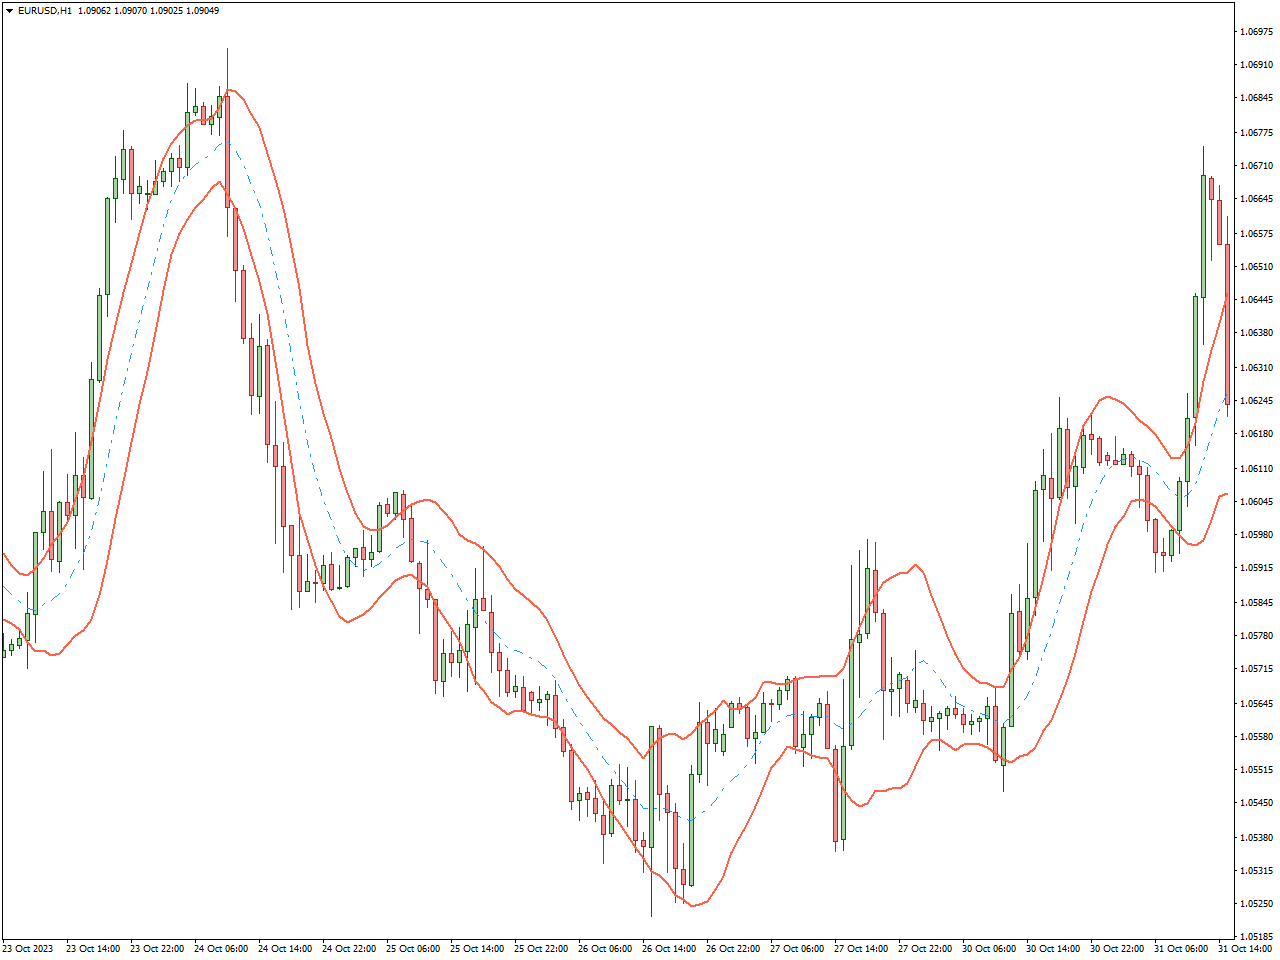
The Keltner Channel Indicator, named after its creator Chester W. Keltner, serves as a technical analysis tool employed by traders to evaluate volatility and recognize potential trends within financial markets. Comprising three lines plotted around an asset’s price, the indicator typically includes an exponential moving average (EMA) at the center, accompanied by upper and lower channel lines determined by the average true range (ATR).
Functioning to encapsulate price movements within a channel, the Keltner Channel enables traders to observe deviations from the prevailing trend. The channel’s width, influenced by the ATR, reflects market volatility. When prices venture outside the channel, it may signal potential trend reversals or breakouts.
Traders commonly utilize the Keltner Channel to pinpoint overbought or oversold conditions, identify potential entry or exit points, and assess the strength of a trend. Contact with or surpassing the upper channel may suggest overbought conditions, while interaction with the lower channel may indicate oversold conditions.
In essence, the Keltner Channel Indicator offers traders a dynamic tool for analyzing volatility, trends, and potential reversal points in financial markets, enhancing the basis for more informed decision-making.
Conclusion
In our examination of lagging indicators, it’s clear that these tools serve as reliable allies in a trader’s toolkit. The top 7 lagging indicators we’ve introduced each play a nuanced role in revealing market dynamics, offering traders a retrospective view for well-informed decision-making. Whether through the consistent smoothing of price fluctuations via moving averages, nuanced signals from oscillators, or the collective confirmation strength these indicators provide, they present a comprehensive panorama of market trends.
As traders navigate the financial landscape, the unique strengths and applications of lagging indicators take center stage, validating trends, pinpointing potential reversals, and gauging market strength. Beyond theory, these indicators prove their practical worth in real-time decision-making, guiding traders through intricate financial pathways with confidence and precision. The diverse perspectives and applications of the top 7 lagging indicators underscore the importance of a multifaceted approach to market analysis, enhancing a trader’s adaptability and resilience in evolving market conditions.
Concluding this exploration, it’s evident that lagging indicators go beyond mere confirmation; they stand as indispensable tools, empowering traders to decode the intricate language of the markets and make strategic decisions grounded in a profound understanding of trends and dynamics.