

Embark on a quest for market mastery as we delve into the prowess of the Top Moving Average Indicator. In the ever-evolving realm of trading, the ability to comprehend and harness market trends is of utmost importance. The Moving Average Indicator emerges as a pivotal instrument, furnishing traders with priceless perspectives on price trends and possible entry or exit points. Whether you’re an experienced trader or a newcomer, this guide aims to shed light on the crucial role of the Top Moving Average Indicator in attaining accuracy and triumph in your trading endeavors.
Top 10 Moving Average Indicator
- Moving Average Ribbon Indicator
- 3 MA Cross with Alert MTF Indicator
- Absolutely No Lag LWMA Indicator
- Best Moving Average Indicator
- EMA Indicator
- Hull Moving Average Indicator
- Color MA Indicator
- DEMA Indicator
- TEMA Indicator
- LSMA Indicator
Moving Average Ribbon Indicator
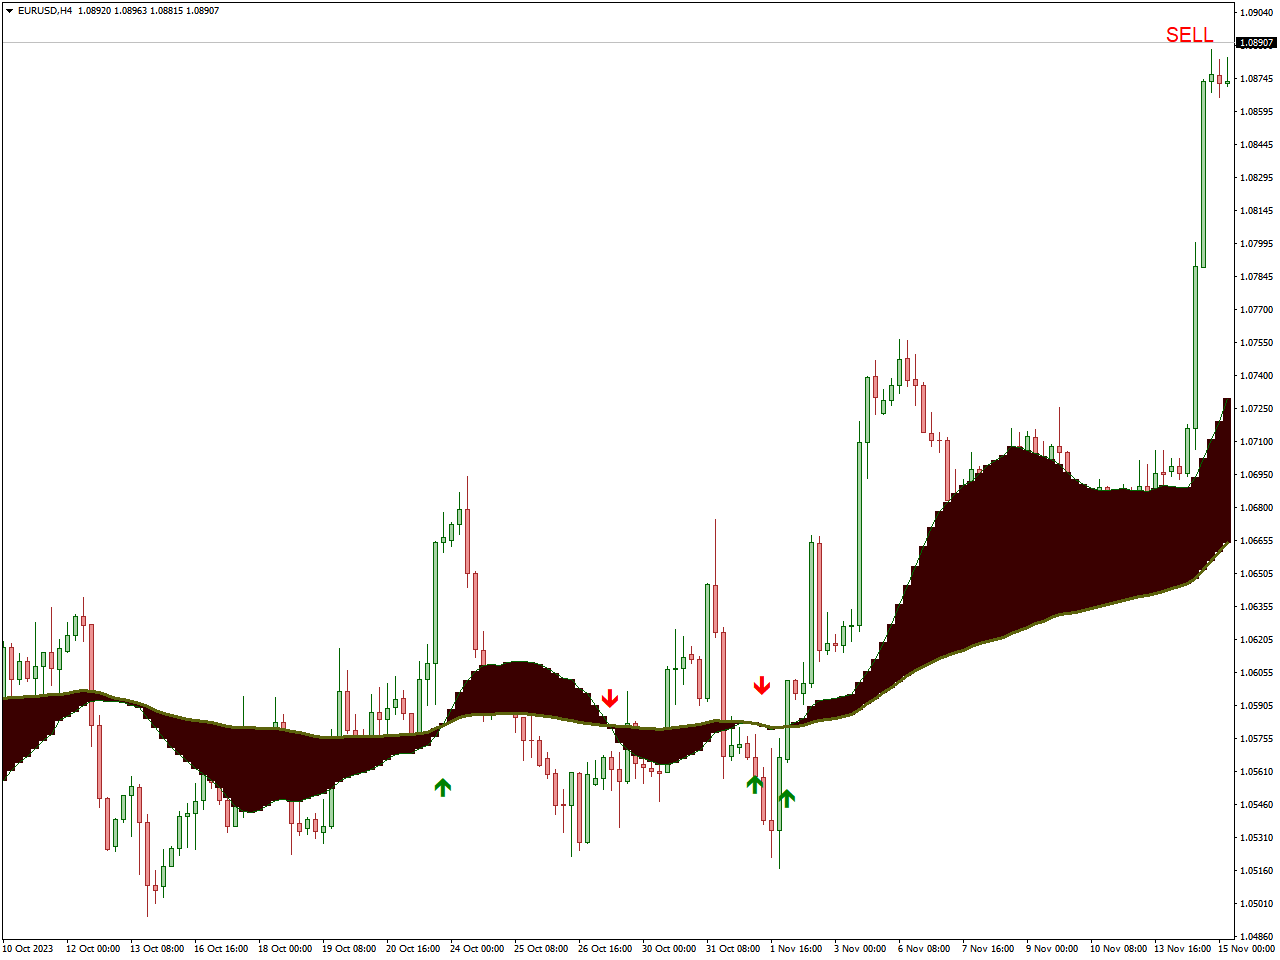
The Moving Average Ribbon stands as a valuable tool in the realm of technical analysis, characterized by the simultaneous plotting of multiple moving averages featuring different periods on a single chart. The amalgamation of these moving averages creates a distinctive ribbon-like visual representation. Traders employ this indicator as a means to evaluate the robustness and trajectory of a market trend. Fundamental considerations in utilizing the Moving Average Ribbon encompass the selection of diverse moving average periods, the application of distinctive colors for each, and the nuanced interpretation of the ribbon’s pattern to gain insights into prevailing market trends.
In the pursuit of a comprehensive analysis, traders closely monitor critical aspects such as crossovers between various moving averages and the emergence of divergence between the price movement and the direction of the moving averages. These phenomena offer valuable cues about potential trend shifts and market dynamics. Moreover, traders often find enhanced analytical efficacy by combining the Moving Average Ribbon with other technical indicators or chart patterns. This multifaceted approach contributes to a more refined and comprehensive understanding of the prevailing market conditions.
In essence, the Moving Average Ribbon serves not only as a visual aid in depicting the intricacies of multiple moving averages but also as a versatile tool that, when integrated judiciously with other analytical methods, provides traders with a holistic perspective for making informed decisions in the dynamic landscape of financial markets.
3 MA Cross with Alert MTF Indicator
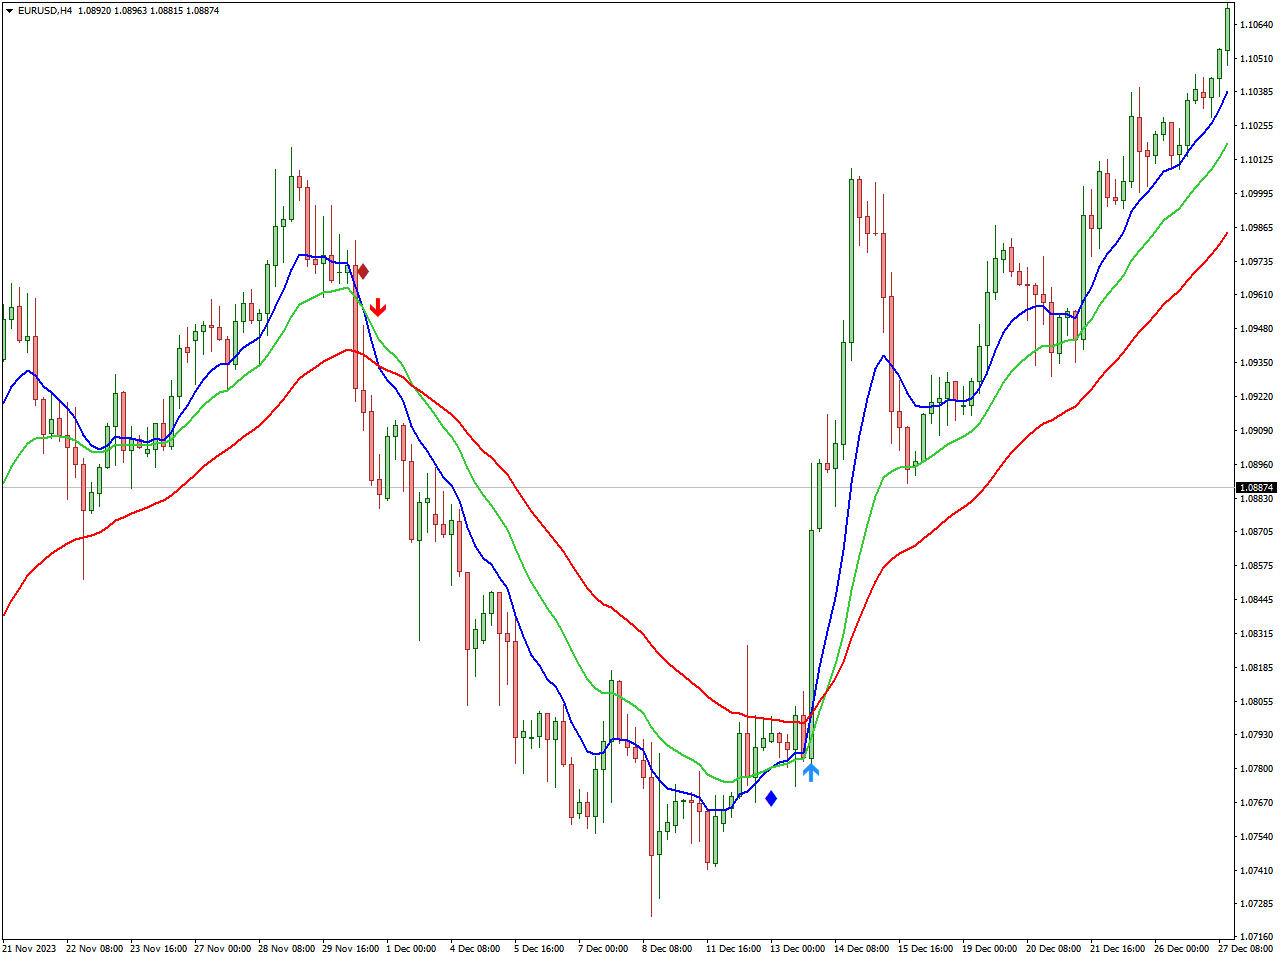
The “3 MA Cross with Alert MTF Indicator” is a widely used technical analysis tool in financial markets designed to identify potential shifts in trends through the analysis of crossovers involving three distinct moving averages (MA). “MA” denotes Moving Average, a statistical calculation employed to analyze data points by creating an average series. The “3 MA Cross” implies the involvement of three moving averages with different periods in this analytical approach.
The “Cross with Alert” feature signifies that the indicator issues alerts or signals when there is a crossover among the three moving averages. A crossover occurs when one moving average line crosses either above or below another on the price chart, commonly interpreted as an indicator of potential shifts in the market direction.
The “MTF” acronym stands for Multiple Time Frame, indicating that the indicator can be utilized across various time frames. This capability allows traders to evaluate crossovers and signals not only on a specific time frame but also concurrently across multiple time frames. The analysis of multiple time frames provides traders with a more comprehensive understanding of market dynamics.
In summary, the “3 MA Cross with Alert MTF Indicator” is a tool that leverages crossovers of three moving averages to generate alerts for potential changes in trends. Its adaptability across different time frames enhances its utility for traders seeking well-informed decisions by considering multiple perspectives of market movements.
Absolutely No Lag LWMA Indicator
The “No Lag LWMA Indicator” is a tool employed in technical analysis that incorporates a “No Lag” variation of the Linear Weighted Moving Average (LWMA). The LWMA, a type of moving average, assigns varying weights to data points, with greater emphasis on recent prices. The “No Lag” adaptation is specifically crafted to mitigate or eliminate the delay commonly associated with conventional moving averages, offering a more immediate representation of price movements.
Fundamentally, the objective of the “No Lag LWMA Indicator” is to furnish a smoother and more timely indication of the prevailing trend or momentum in the market. The reduction of lag proves advantageous, especially for traders seeking prompt signals to inform their decision-making process.
When utilizing this indicator, traders typically observe the interaction between the No Lag LWMA and price movements. Crossovers between the No Lag LWMA and the price chart, along with alterations in the indicator’s slope, are often construed as signals indicating potential shifts or reversals in the trend.
Like any technical tool, it is crucial for traders to integrate the “No Lag LWMA Indicator” with other analytical tools and methods to make well-founded trading decisions. Additionally, it is recommended to experiment with and tailor the indicator’s parameters to align with the specific market conditions and timeframes under consideration.
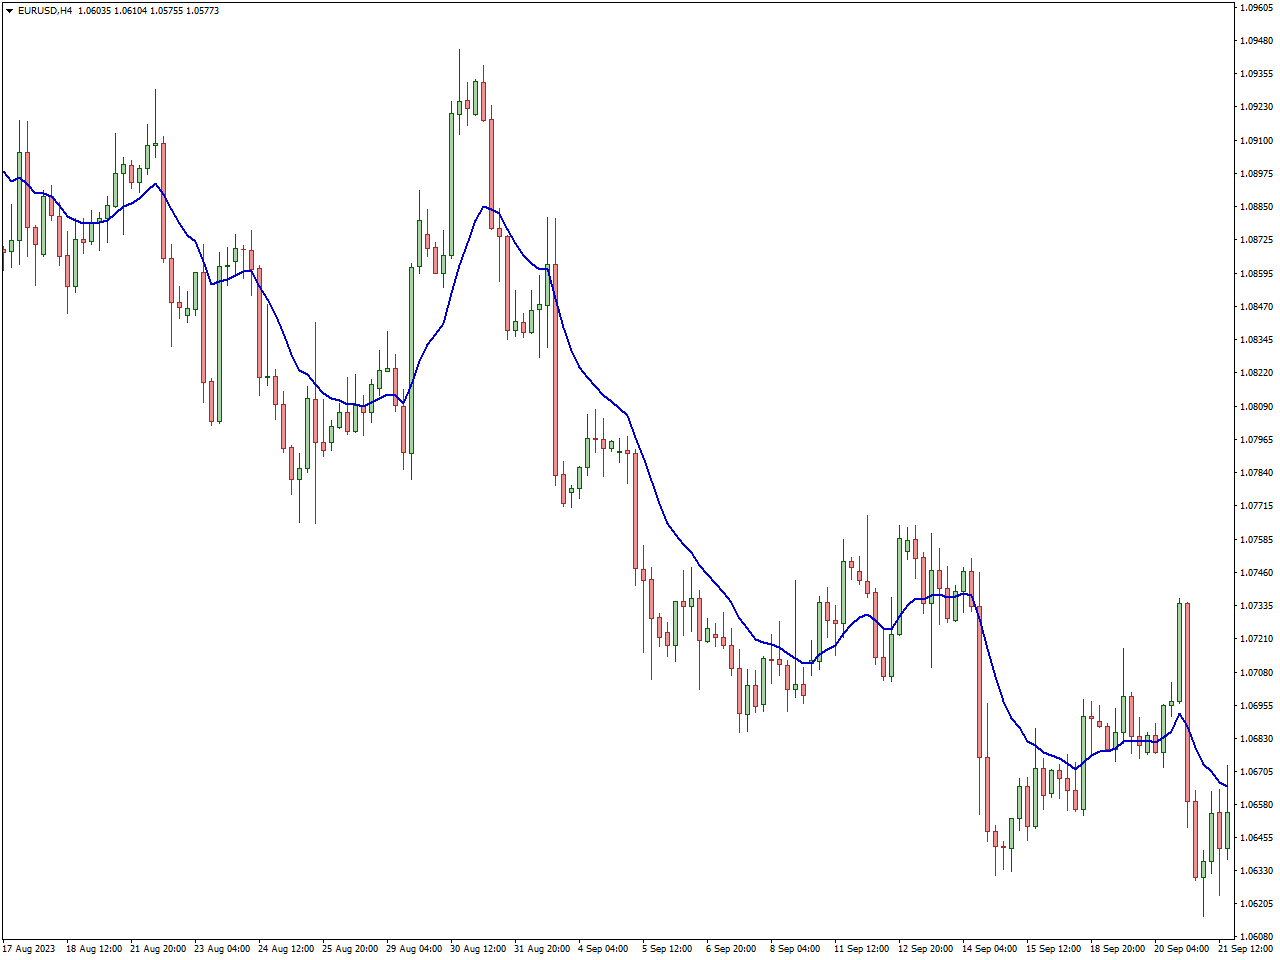
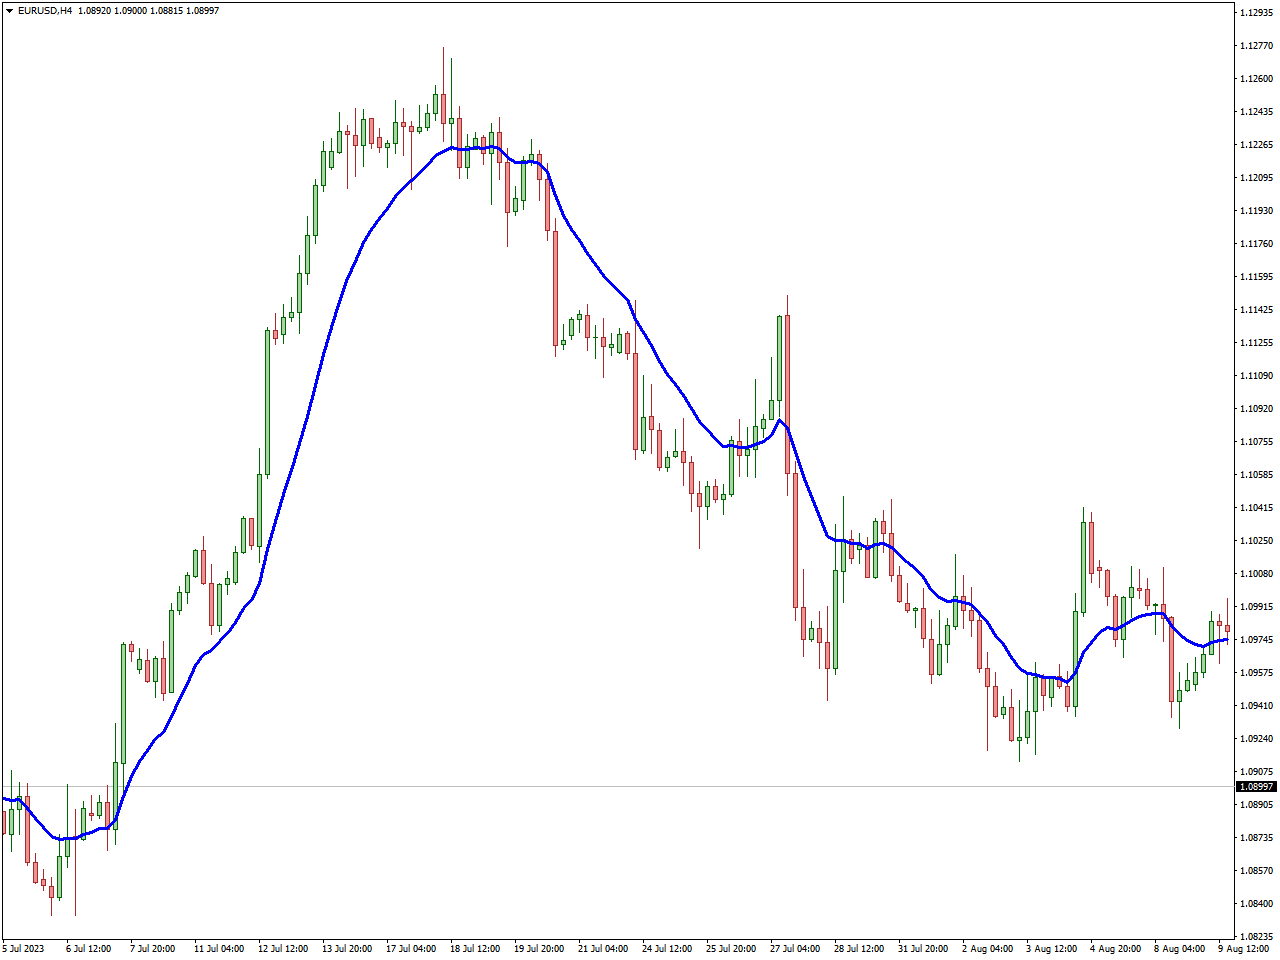
Best Moving Average Indicator
The Moving Average (MA) indicator is a fundamental component of technical analysis, designed to smooth out price data over a specified time period. Its primary purpose is to assist traders in discerning the prevailing trend direction and potential levels of support or resistance. By averaging a set of prices over a defined period, the Moving Average is available in various types, such as the Simple Moving Average (SMA) and the Exponential Moving Average (EMA). The SMA treats all data points equally, while the EMA assigns greater weight to recent prices.
Interpreting the Moving Average involves analyzing the indicator’s direction to ascertain the overall market trend. It also aids in pinpointing potential support and resistance levels, with moving averages functioning as dynamic barriers. Crossovers, where shorter-term and longer-term moving averages intersect, serve as indicators of potential trend changes. For example, a “golden cross” occurs when a short-term MA crosses above a long-term MA, suggesting a potential uptrend.
The versatility of the Moving Average extends to its application across diverse time frames, including daily, weekly, or hourly charts. Traders can select time frames based on their preferences and trading styles. Shorter-term moving averages respond more promptly to price changes but may generate more false signals, while longer-term moving averages offer smoother trends but lag behind current prices. Frequently employed in conjunction with other indicators, the Moving Average is a foundational element in technical analysis, aiding traders in making informed decisions and eliminating noise from price fluctuations.
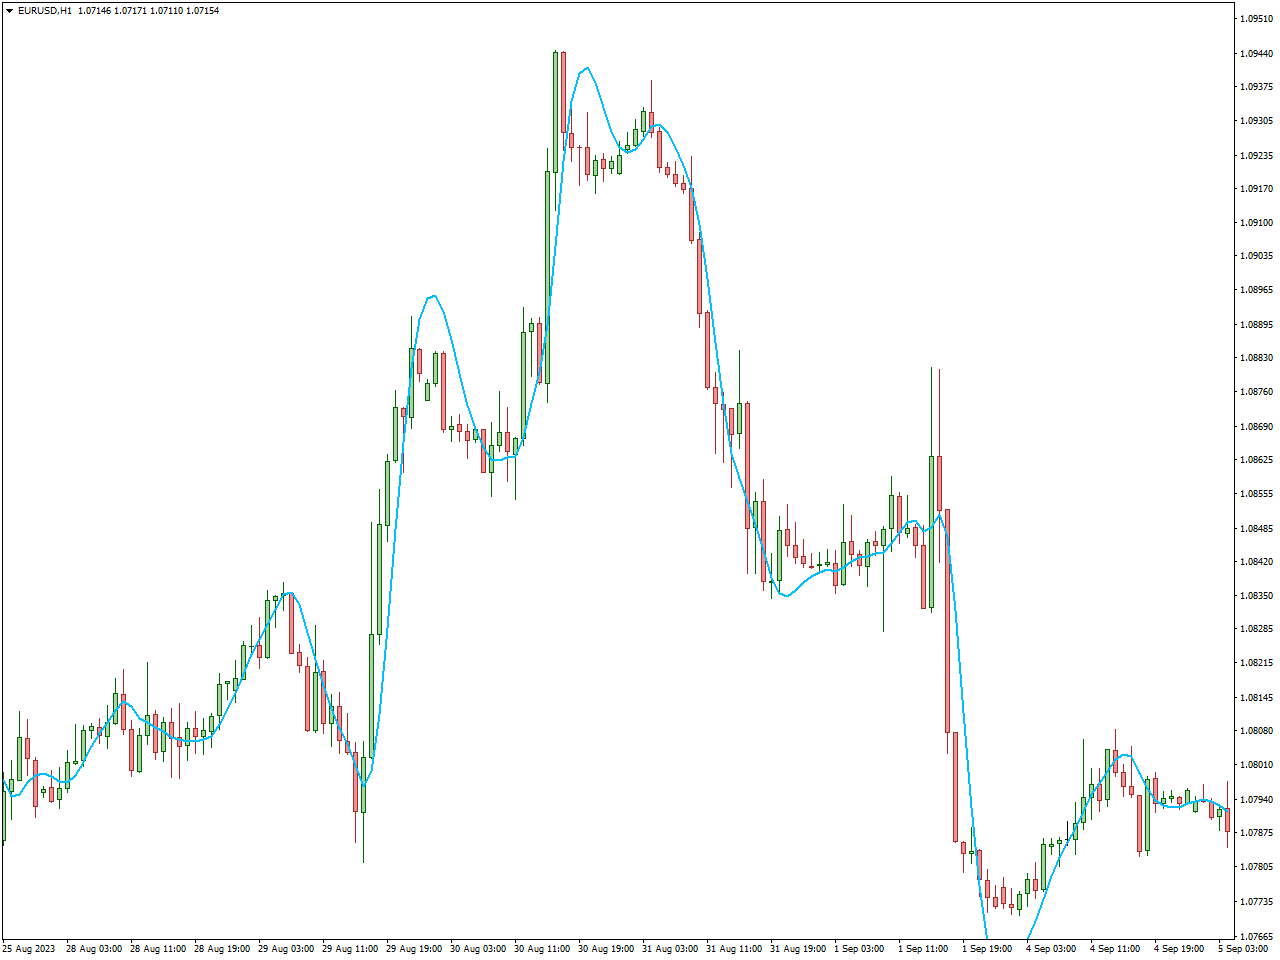
EMA Indicator
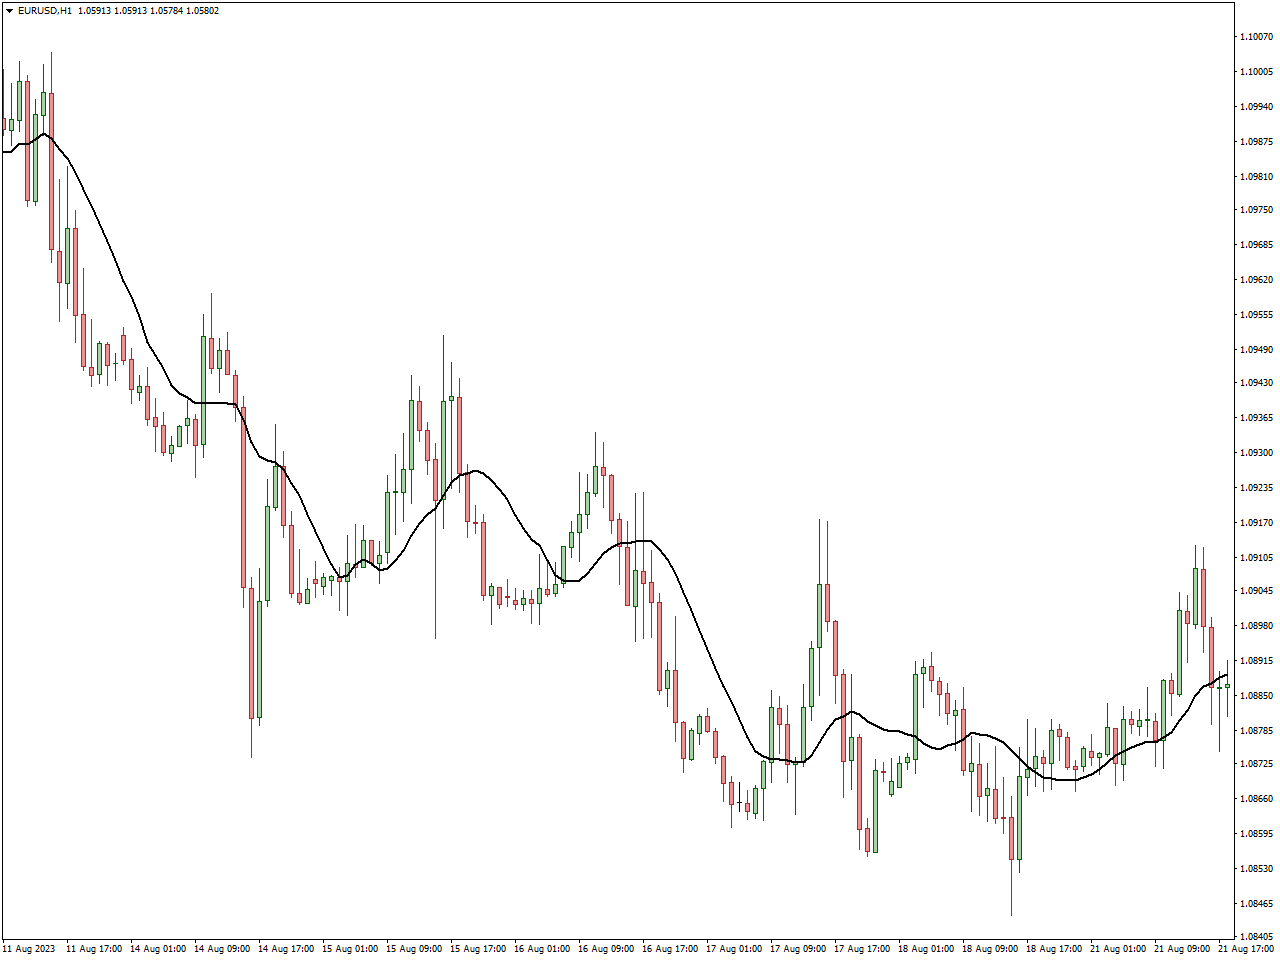
The Exponential Moving Average (EMA) stands as a pivotal indicator in technical analysis, utilized for scrutinizing price trends within financial markets. Diverging from the Simple Moving Average (SMA), the EMA attributes greater significance to recent price data, rendering it more attuned to current market dynamics.
Fundamentally, the EMA computes the average of a designated set of prices over a defined time span, with the most recent prices exerting more influence in the calculation. This weighted approach empowers the EMA to promptly adapt to shifts in price, making it especially beneficial for traders aiming to capture short-term trends.
Traders frequently leverage the EMA for diverse objectives, including trend identification, analysis of support and resistance levels, and evaluating market momentum. When plotted on a price chart, the EMA’s line visually portrays the average price over time, accentuating recent data points. Instances of crossovers between various EMAs or between the EMA and the price chart often serve as indicators of potential shifts in trend direction.
Hull Moving Average Indicator
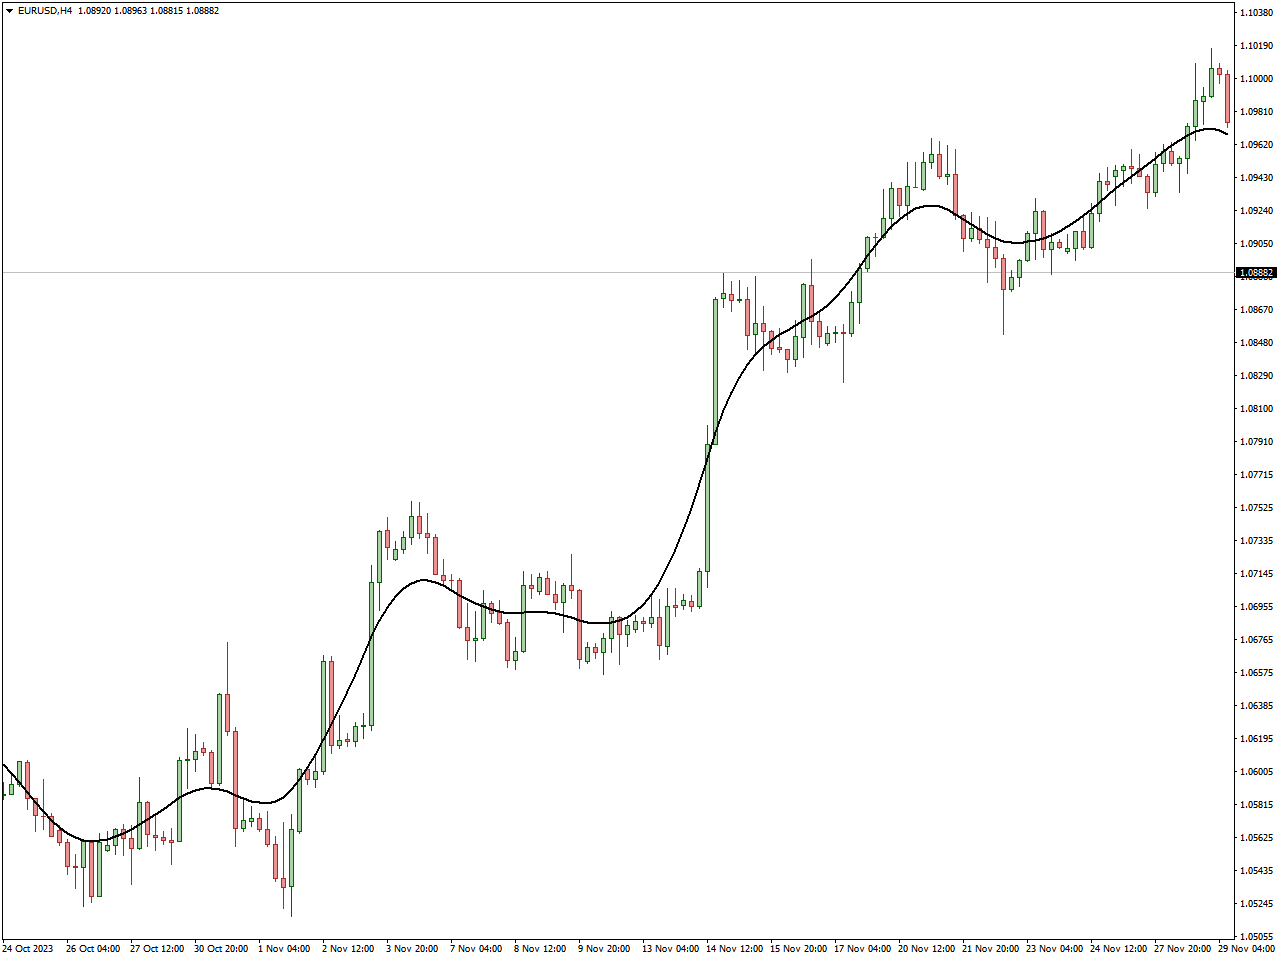
Alan Hull introduced the Hull Moving Average (HMA) as a technical analysis indicator aimed at presenting a refined depiction of price movements while minimizing latency. Positioned as an evolved iteration of conventional moving averages, the HMA incorporates weighted moving averages and a weighted moving average of the weighted moving averages to achieve a distinctive smoothing effect.
Diverging from simple or exponential moving averages, the HMA strives to strike a balance between responsiveness and smoothness by employing a series of weighted moving averages. This methodology is instrumental in diminishing the lag commonly associated with traditional moving averages.
The computation of the HMA involves a sequence of steps, encompassing the calculation of weighted moving averages for predefined periods and the application of mathematical operations to attain the desired smoothing effect. The resulting HMA materializes as a line on a price chart, offering a more seamless curve in comparison to conventional moving averages.
Traders employ the HMA to discern trends, potential reversals, and consequential support or resistance levels. Its versatility in adapting to diverse market conditions and its ability to reduce lag make it a favored choice for those seeking a more responsive indicator. It is not uncommon for traders to integrate the HMA with other technical tools to augment their comprehensive analysis and decision-making processes in financial markets.
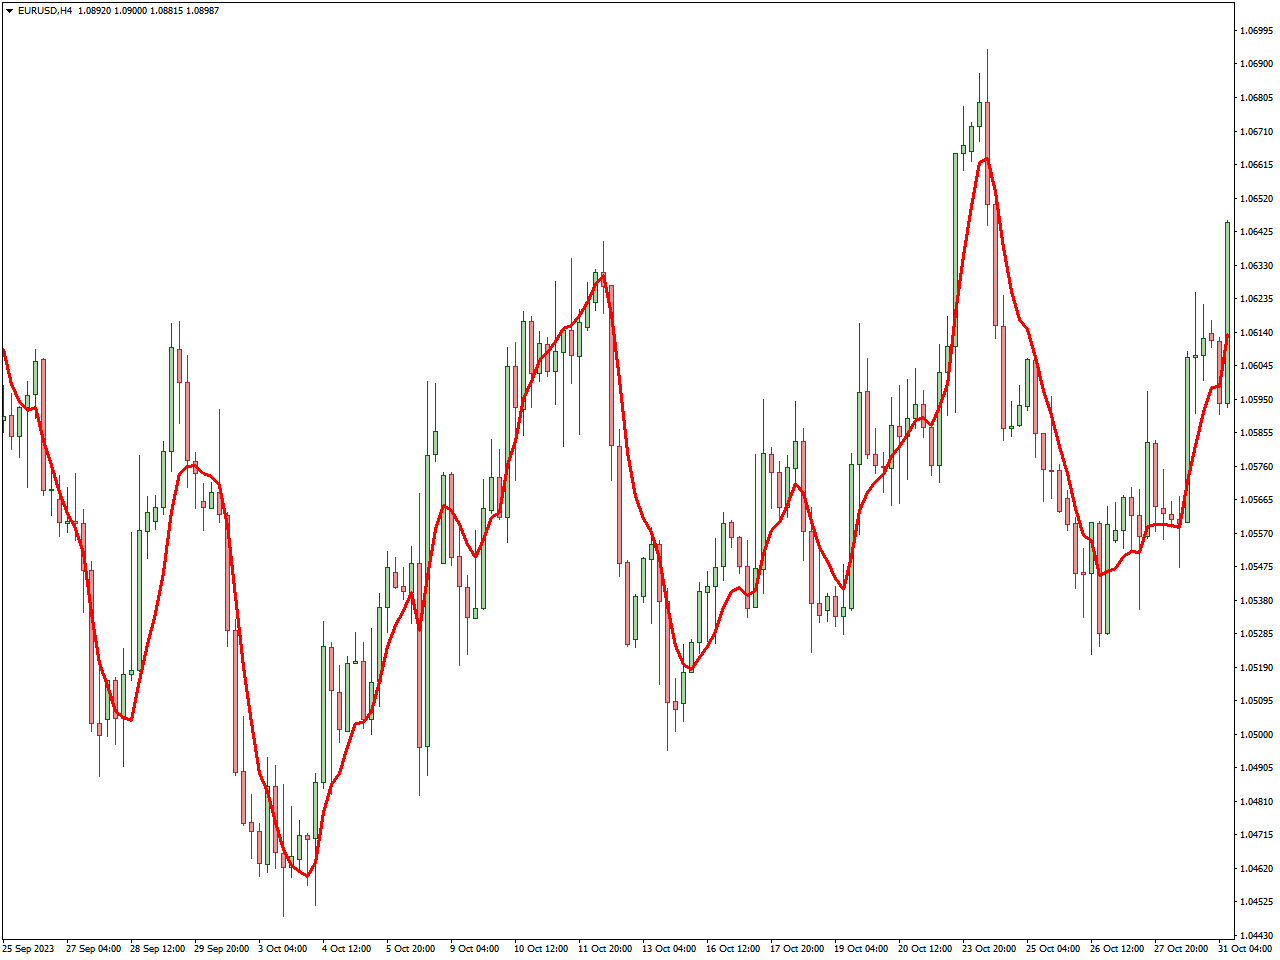
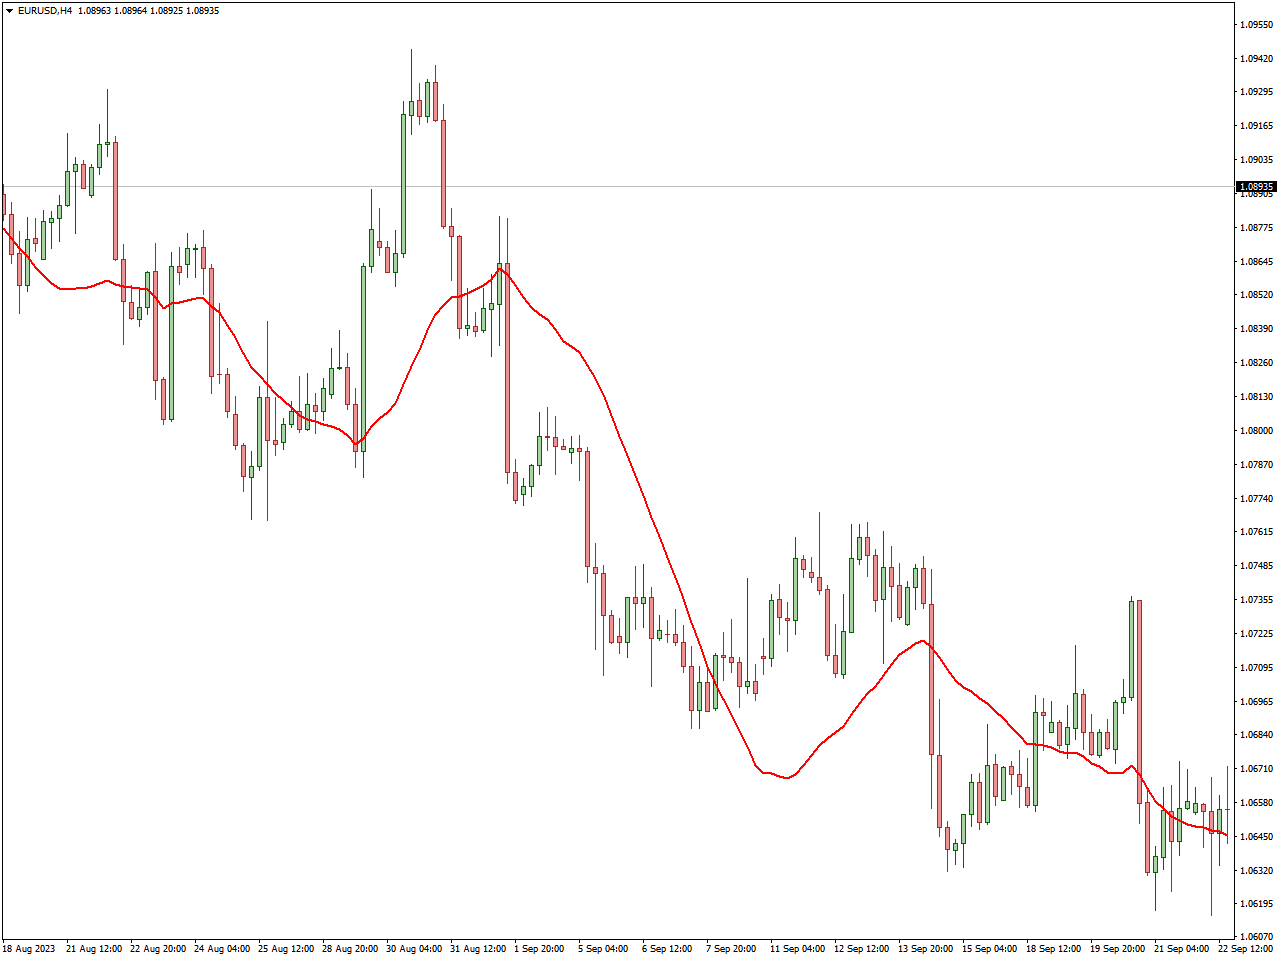
Color MA Indicator
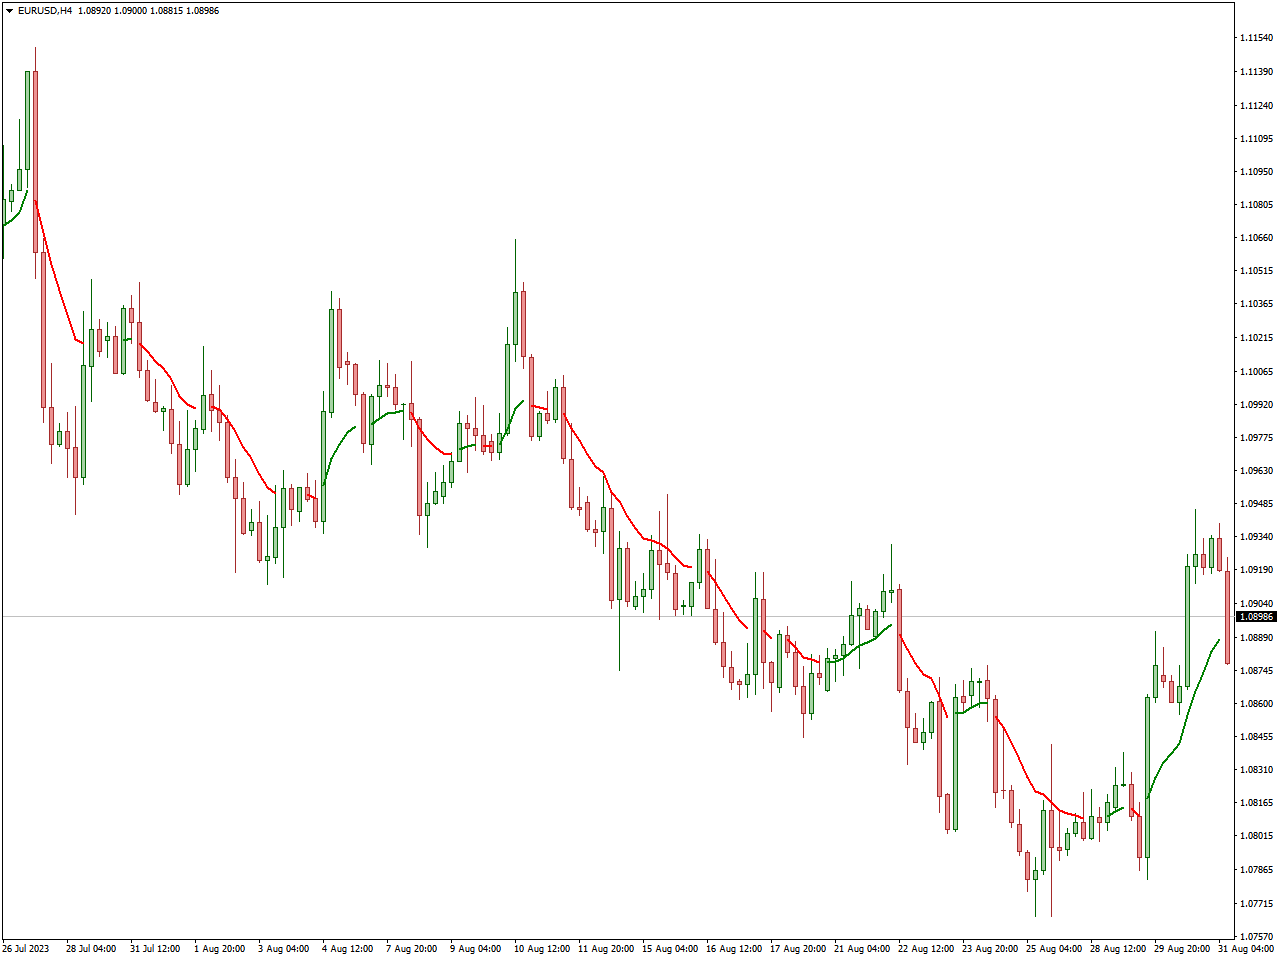
The Color MA (Moving Average) Indicator serves as a tool in financial market technical analysis, offering a visual representation of trends and potential reversals based on the behavior of moving averages. Its primary objective is to enhance the depiction of moving averages by incorporating a color-coded system, enabling traders to easily discern shifts in trend direction.
At its core, the Color MA Indicator operates similarly to traditional moving averages, smoothing out price data to highlight underlying trends. However, its distinctive feature lies in the color-coded presentation. Traders have the flexibility to assign specific colors to different moving averages or utilize color changes to indicate crossovers or shifts in trend momentum.
As an illustration, a trader might designate a green color for a rising moving average and a red color for a falling one. When the two moving averages cross, suggesting a potential alteration in trend direction, the colors may switch, offering a visual cue to the trader.
The Color MA Indicator is adaptable across various time frames, allowing traders to tailor the color scheme according to their preferences and analytical requirements. It is commonly employed alongside other technical indicators and chart patterns to reinforce trend analysis and pinpoint potential trading opportunities.
DEMA Indicator
The Double Exponential Moving Average (DEMA) is a member of the moving averages family within technical analysis. Its primary purpose is to offer a more refined depiction of price trends with decreased lag compared to conventional moving averages. The methodology employed by the DEMA to achieve this involves the application of a double exponential smoothing technique.
In practical terms, the DEMA is computed by implementing the exponential moving average (EMA) formula twice. Initially, the first EMA is applied to the price data, followed by the application of a second EMA to the result of the initial calculation. This dual smoothing approach is strategically employed to heighten the indicator’s responsiveness to recent changes in price.
The formula for computing the DEMA is notably more intricate than that of a standard EMA, encompassing diverse parameters and coefficients. Although this increased complexity might render the DEMA calculation less straightforward, it plays a crucial role in empowering the indicator to capture short-term price movements with a diminished lag.
TEMA Indicator
The Triple Exponential Moving Average (TEMA) stands as a technical analysis indicator within the moving averages category, aiming to provide a more seamless representation of price trends while mitigating lag compared to conventional moving averages. This is achieved through the application of a triple exponential smoothing technique.
Essentially, the TEMA is computed by utilizing the exponential moving average (EMA) formula three times. The initial EMA is applied to the price data, followed by two successive EMAs applied to the outcome of the preceding calculation. This triple smoothing approach is designed to augment the indicator’s responsiveness to recent price changes while preserving a smoother curve.
The formula for computing the TEMA is more complex than that of a standard EMA, involving a range of parameters and coefficients. This heightened complexity is deliberate, aiming to enhance the TEMA’s efficacy in capturing short-term price movements with minimized lag.
LSMA Indicator
The Least Squares Moving Average (LSMA) serves as a technical analysis indicator utilized for examining price trends in financial markets. Its primary objective is to present a more precise depiction of the underlying trend by minimizing the sum of squared differences between actual prices and the values predicted by the linear regression line.
Fundamentally, the LSMA computes the linear regression line that optimally fits historical price data over a designated period. This regression line is subsequently employed as the foundation for the moving average calculation. The overarching aim is to mitigate the impact of outliers and enhance the overall capturing of the trend.
The LSMA proves particularly advantageous in scenarios where traditional moving averages might exhibit sensitivity to extreme price fluctuations. Through the implementation of a linear regression approach, the LSMA strives to provide a more steadfast and resilient representation of the prevailing trend.
Conclusion
You have acquired a more profound comprehension of the Top Moving Average Indicator, a crucial tool for interpreting market trends with precision. Incorporating this indicator into your trading strategy enhances decision-making, providing you with the confidence to navigate the intricacies of the market. Keep in mind that continuous learning is the cornerstone of trading success, and the Top Moving Average Indicator serves as your steadfast ally on this journey. With this knowledge in hand, step into the financial markets with newfound confidence and expertise.