

Successfully maneuvering the dynamic landscape of financial markets demands a profound grasp of market trends. For traders, the ability to interpret the subtle shifts and patterns within these trends is imperative for making well-informed decisions. In this in-depth guide, we immerse ourselves in the realm of trend indicators – potent tools meticulously crafted to unravel the intricacies of market movements. Whether you find yourself among the seasoned traders with years of experience or are taking your initial steps into the finance realm, grasping the nuances of the best trend indicators could be the linchpin to unlocking your trading prowess. Come alongside us as we embark on an exploration of these indicators, illuminating their distinctive features, practical applications, and the ways in which they can be effectively employed to elevate your trading strategy.
TOP 20 Trend Indicators
- Advanced Trendlines Indicator
- Trend Path Non-Repaint Indicator
- Elliott Wave Count Indicator
- Keltner Channel Indicator
- FXSSI.Ratios
- VWAP Bands Indicator
- Jebatfx Breakout Trendline Indicator
- Half Trend Buy Sell Indicator
- Donchian Channel Indicator
- FXSSI.StopLossClusters
- Schaff Trend Cycle Indicator
- Auto TrendLine Indicator
- Trendline Indicator MT4
- High Way Channel Indicator
- Trend Strength Indicator
- Heiken Ashi Smoothed Indicator
- Fibonacci Retracement Indicator
- Power Trend Indicator
- EMA Indicator
- MACD 4C Indicator
Advanced Trendlines Indicator
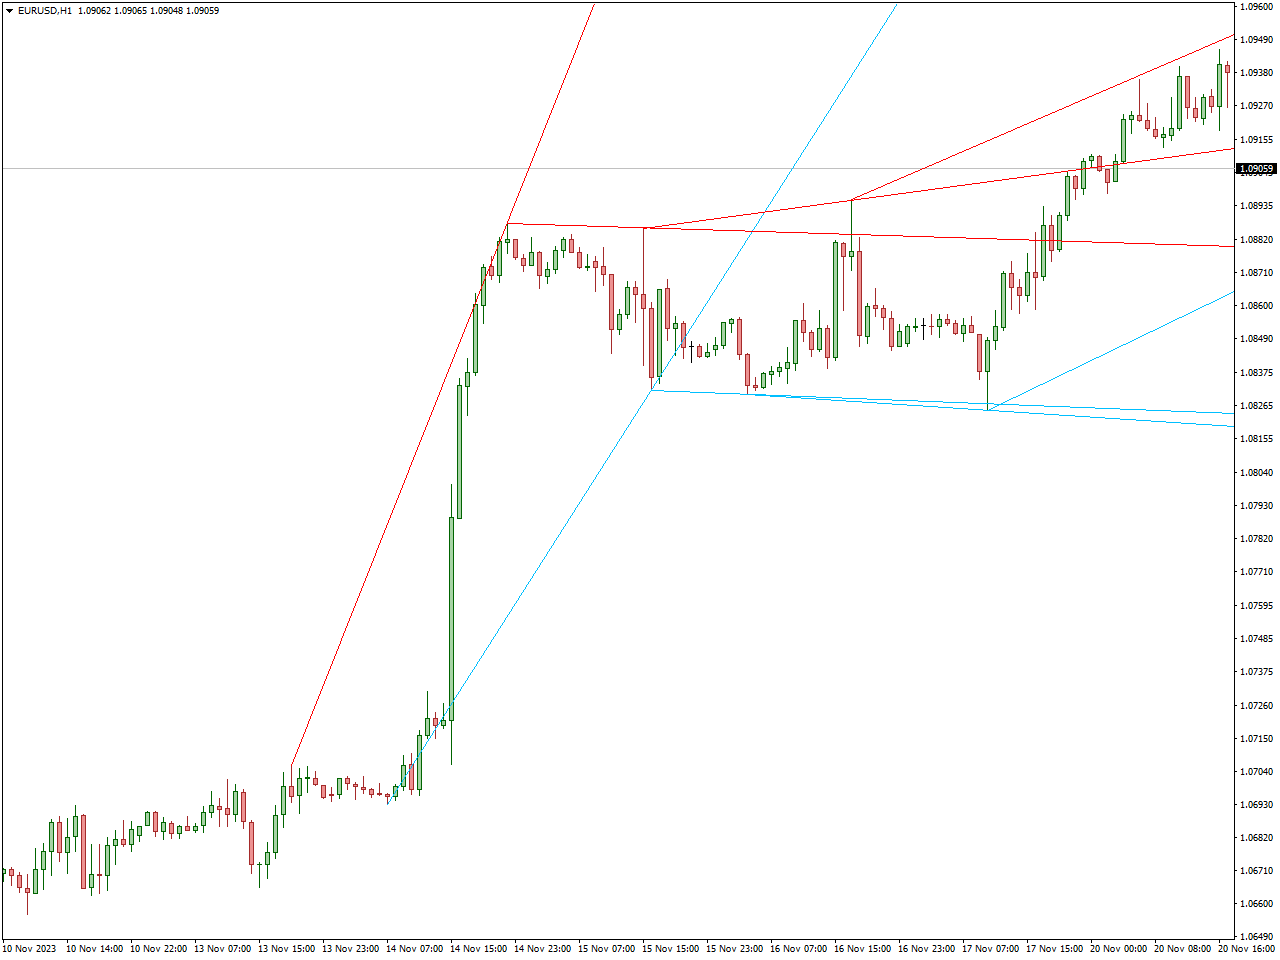
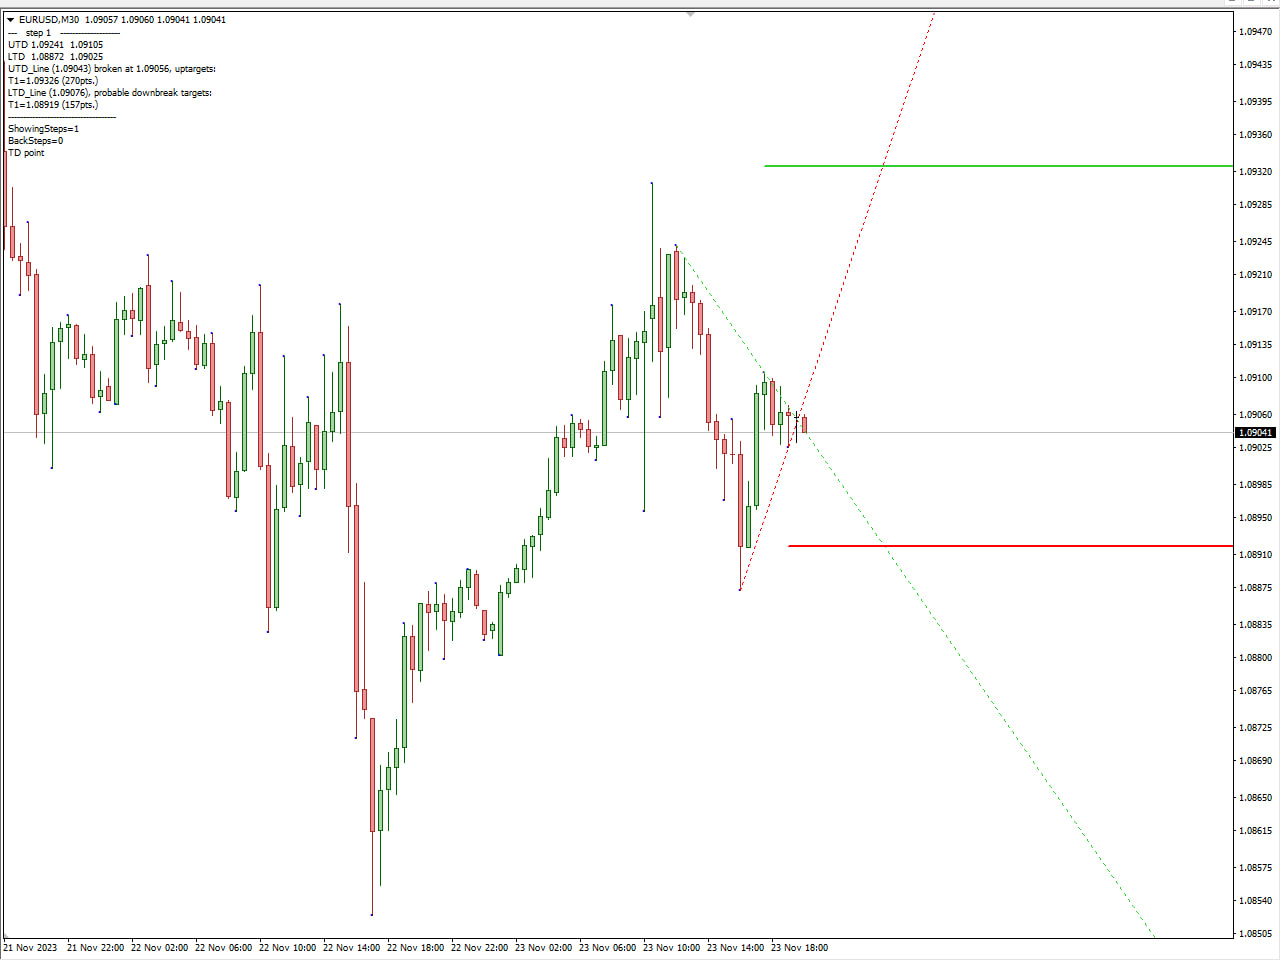
The Metatrader 4-exclusive Advanced Trend Lines Forex indicator is ingeniously designed to autonomously plot trend lines on your trading chart, significantly augmenting the potential profitability of your trading endeavors.
The process is remarkably uncomplicated – simply integrate the indicator into your chart, and the trend lines will promptly manifest.
Trading Signals:
- For a Buy Signal: Exercise patience for a price break and subsequent closure above the red horizontal price line.
- For a Sell Signal: Exercise patience for a price break and subsequent closure below the blue horizontal price line.
This innovative indicator serves as a valuable tool for traders, offering clear visual cues and signals to guide decision-making in the dynamic landscape of the financial markets.
Trend Path Non-Repaint Indicator
The Trend Path Non-Repaint Indicator serves as a specialized tool utilized in financial markets, specifically within the realm of Forex trading.
This Forex indicator is crafted to recognize and track trends in asset prices without exhibiting repainting in its signals. The term “non-repaint” signifies that once a signal is generated, it should remain unchanged and not alter its direction or disappear with the emergence of new price data. This attribute proves invaluable for traders who seek steadfast and consistent signals to inform their trading decisions.
Distinguishing itself as an exceptional technical trading indicator, it caters well to various trading styles, including scalpers, day traders, intraday traders, and swing traders alike.
Elliott Wave Count Indicator
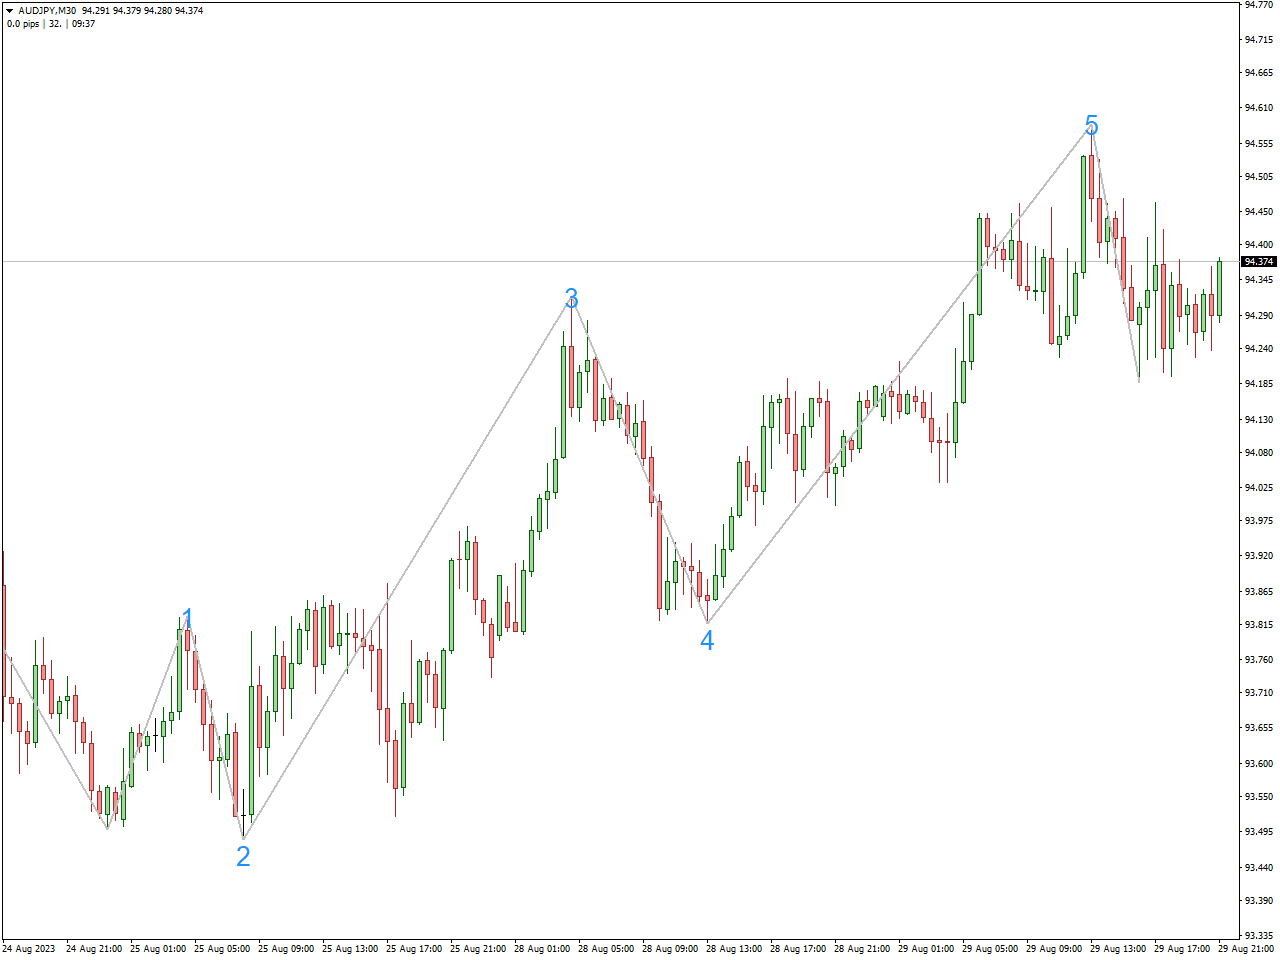
The Elliott Wave Count Indicator serves as a tool tailored for traders in financial markets, especially in the domain of technical analysis. Its primary purpose is to aid in the identification and analysis of Elliott Wave patterns.
Grounded in the Elliott Wave Theory, a technical analysis framework positing that market prices follow specific and predictable wave patterns, this indicator is designed to automatically count and showcase these waves on a price chart. This functionality streamlines the process for traders, facilitating the interpretation and application of Elliott Wave analysis principles.
By recognizing these wave patterns, traders can glean insights into potential future price movements and overall market trends. For those who integrate Elliott Wave analysis into their trading strategies, this indicator proves to be a valuable asset, offering a visual representation of wave counts and enhancing the overall technical analysis process.
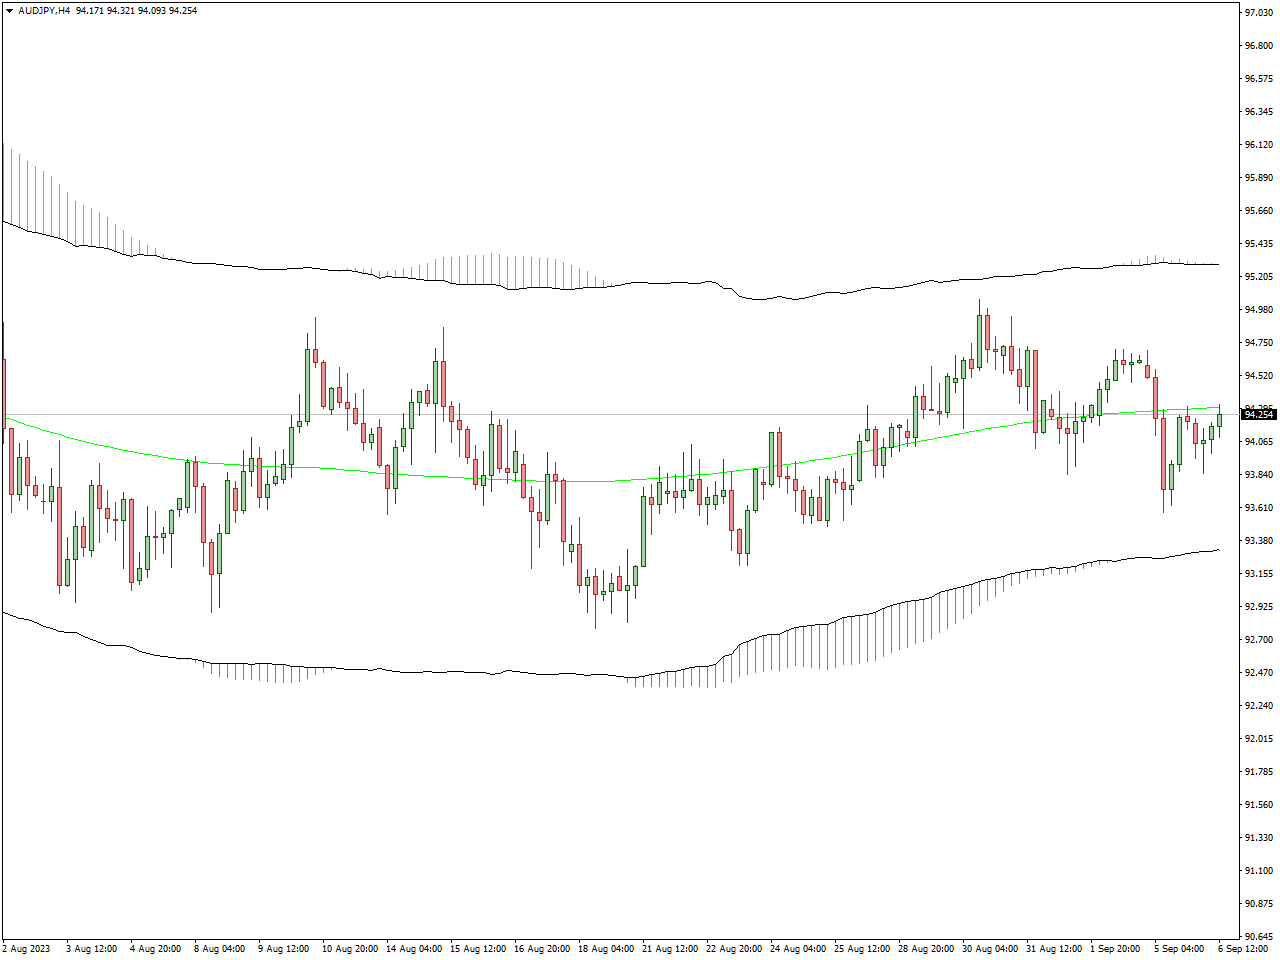
Keltner Channel Indicator
The Keltner Channel Indicator stands as a valuable tool employed by traders in financial markets, specifically within the domain of technical analysis. Named after its creator, Chester W. Keltner, this indicator is crafted to aid in the identification of potential price trends and market volatility.
Comprising three lines on a price chart, the Keltner Channel includes a middle line representing an exponential moving average (EMA) of the asset’s price, flanked by two outer channels positioned above and below the middle line. These outer channels are typically derived from the Average True Range (ATR) of the price, serving as an indicator of market volatility.
Traders frequently utilize the Keltner Channel to pinpoint potential trend reversals, identify overbought or oversold conditions, and recognize periods of heightened or diminished volatility. The width of the channels provides insights into the level of market activity, with wider channels signaling increased volatility. Overall, the Keltner Channel Indicator proves to be a versatile instrument for technical analysts, aiding in the assessment of price trends and market conditions.
FXSSI.Ratios
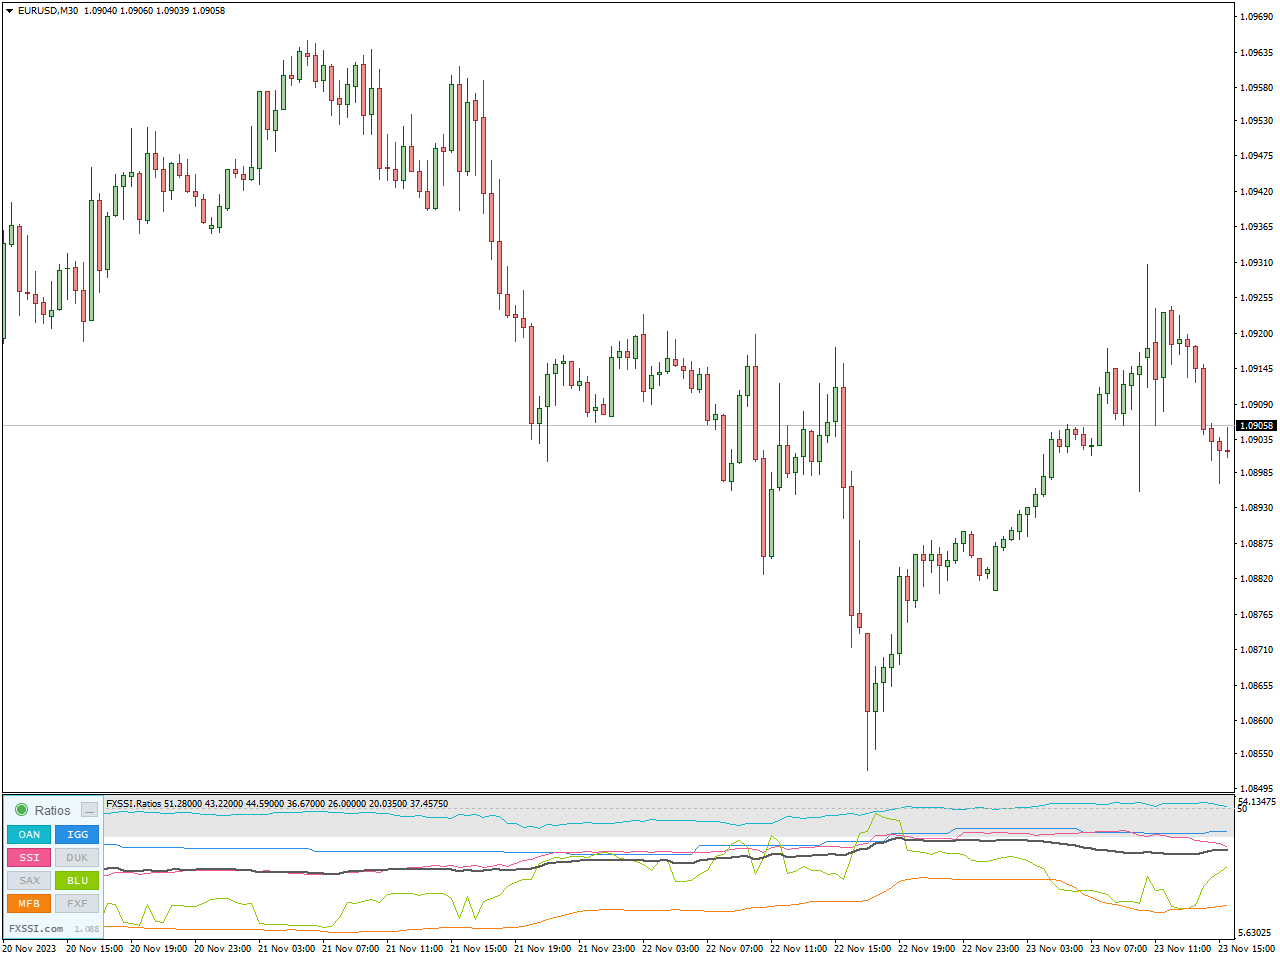
Track market sentiment dynamics through the Ratios indicator, which leverages historical data on the buyers and sellers ratio. This tool allows for a more detailed analysis of key points on the chart, offering insights into potential future price movements.
The Ratios Indicator is designed to present the ratio of buyers’ and sellers’ positions in the form of a chart. The ratio data is sourced from major brokerage companies and services like Oanda. Notably, the indicator only considers currently open trades, excluding closed ones from its calculations. The indicator offers data on open positions from 10 sources across 12 Forex pairs, selected based on their relevance.
The core principle guiding the indicator’s functionality is to avoid opening trades in the same direction as the majority of traders in the market. By adhering to this principle, traders increase their chances of executing successful trades, especially when trading against the prevailing market sentiment. Trading against the market majority often aligns with the trend, as most trades tend to be positioned against the prevailing trend.
The Ratios indicator supports various analysis algorithms, providing traders with multiple options to enhance their decision-making processes.
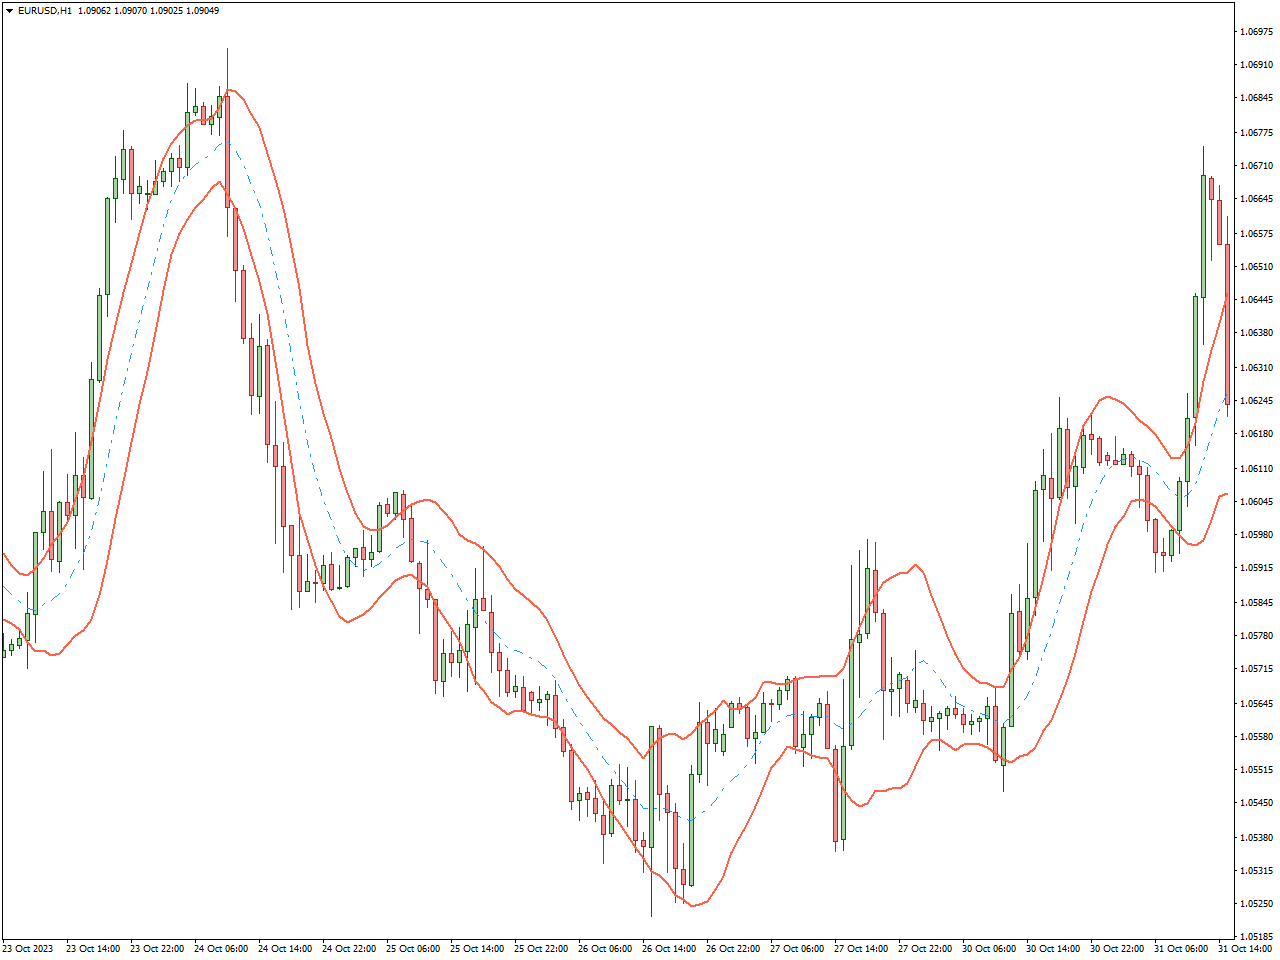
VWAP Bands Indicator
The VWAP Bands Indicator is a widely utilized tool in financial markets, specifically within the domain of technical analysis. VWAP, which stands for Volume Weighted Average Price, is the focal point of this indicator, aiding traders in scrutinizing price trends with respect to volume.
Typically, the VWAP Bands comprise three lines plotted on a price chart: the VWAP line itself, an upper band representing a certain multiple of the standard deviation above the VWAP, and a lower band representing a certain multiple of the standard deviation below the VWAP. These bands serve as indicators for identifying potential overbought or oversold conditions and evaluating the robustness of a price trend.
Traders commonly leverage the VWAP Bands to make well-informed decisions regarding potential trend reversals, market entry or exit points, and to assess the prevailing market sentiment. The dynamic interplay between the price and the VWAP Bands yields valuable insights into the market’s perception of value, rendering it an invaluable tool for technical analysis.
Jebatfx Breakout Trendline Indicator
The Jebatfx Breakout Trendline Indicator for MetaTrader stands out as an exceptional tool for trading trend breakouts. This automated indicator effortlessly identifies and plots valid trend lines on your forex chart, complete with a reliable target for profit-taking.
Ideal for both day and intra-day trading, this indicator offers a streamlined trading experience, particularly for those who heavily rely on trendlines. The manual task of drawing trendlines is eliminated, thanks to the indicator’s automation.
Whether you’re a seasoned trader or a novice, the Jebatfx Breakout Trendline Indicator is a valuable addition to your chart. For beginners, it serves as a learning aid, solidifying the understanding of trendlines and their application. Meanwhile, experienced traders benefit from its time-saving features, ensuring efficiency in their trading endeavors. With this indicator, you won’t miss out on potential explosive moves resulting from breakouts, and it does so without cluttering your chart with excessive lines.
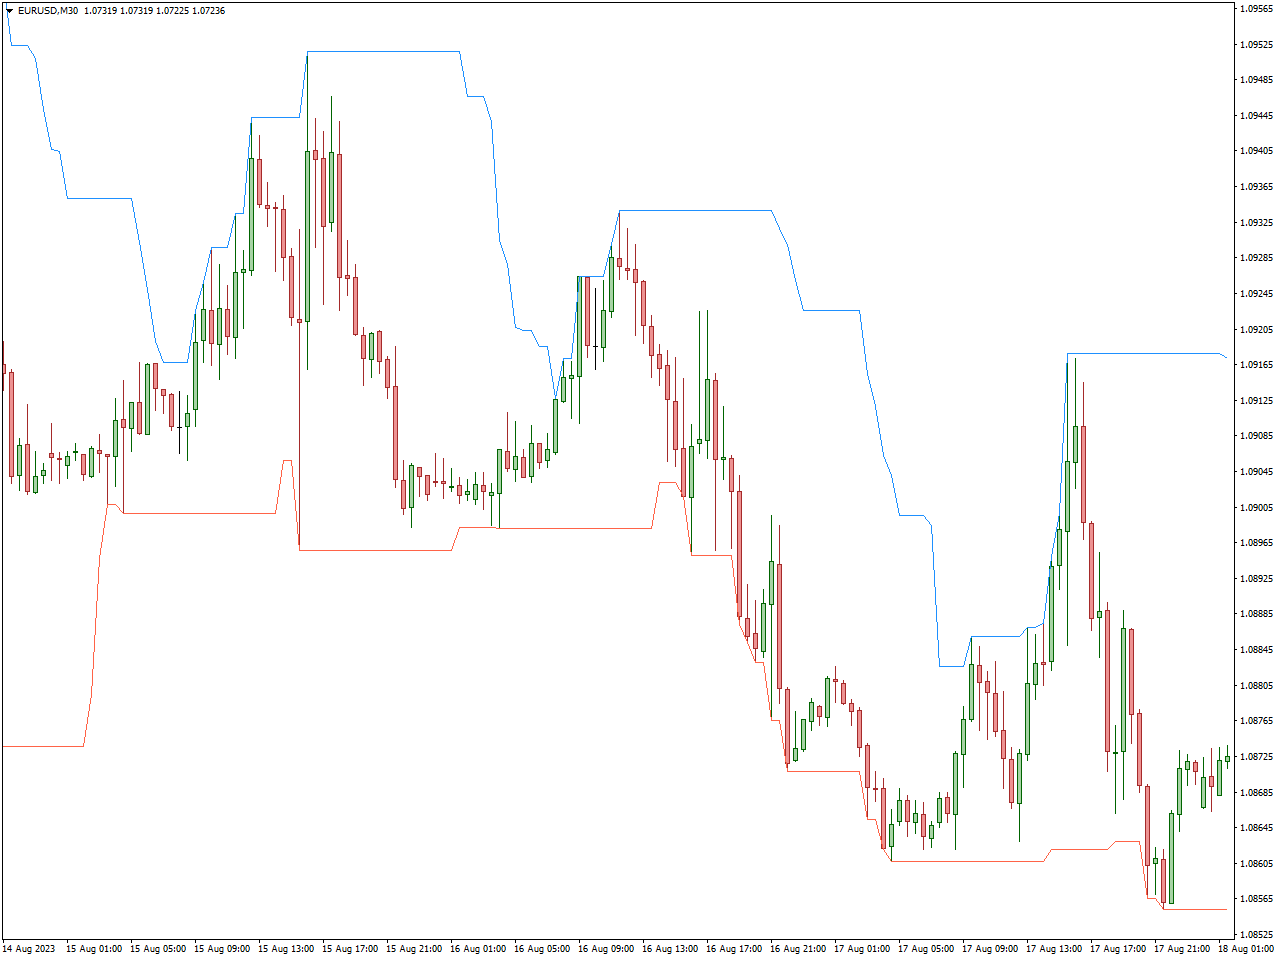
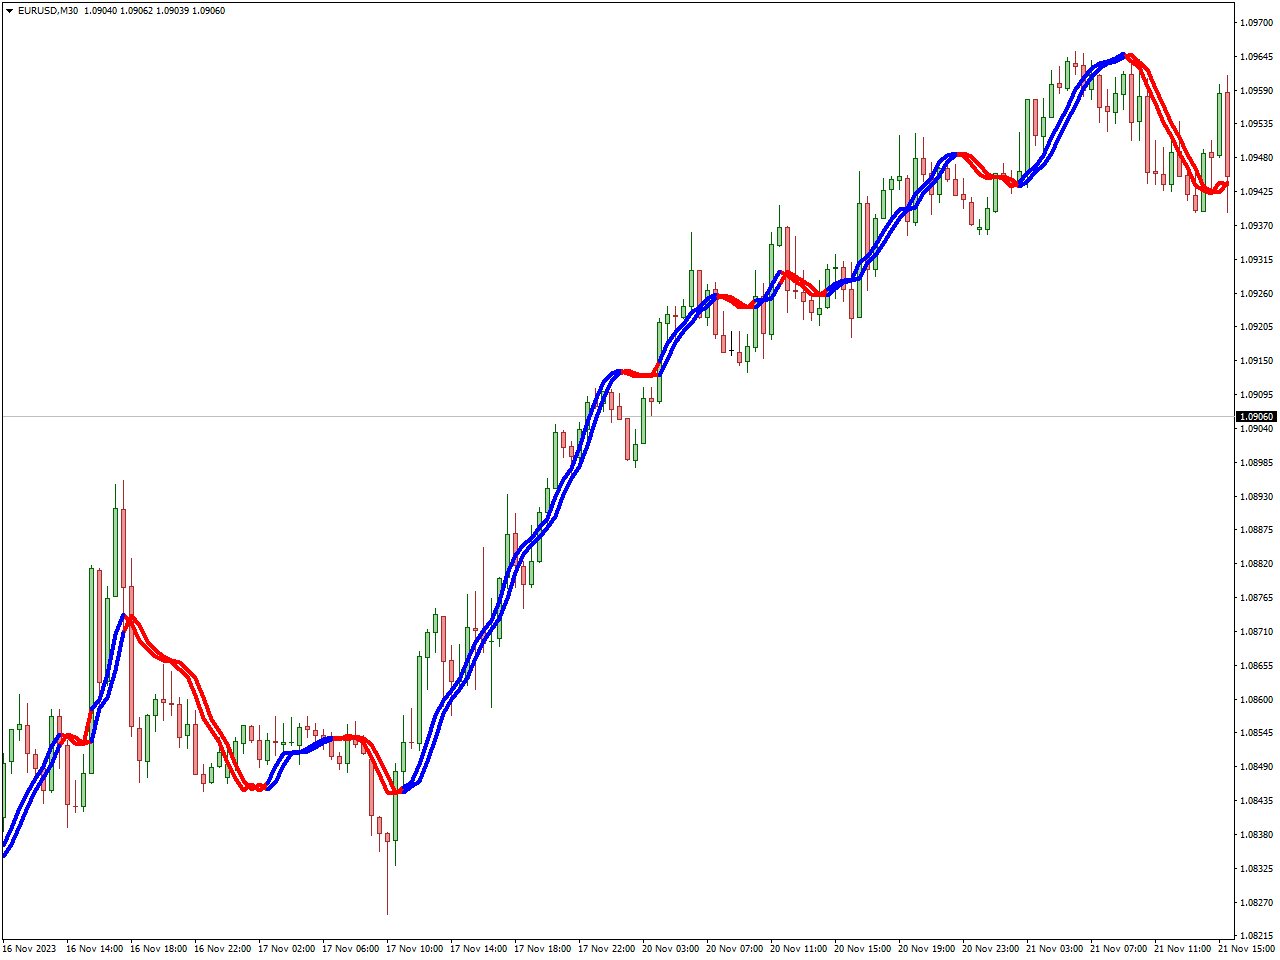
Half Trend Buy Sell Indicator
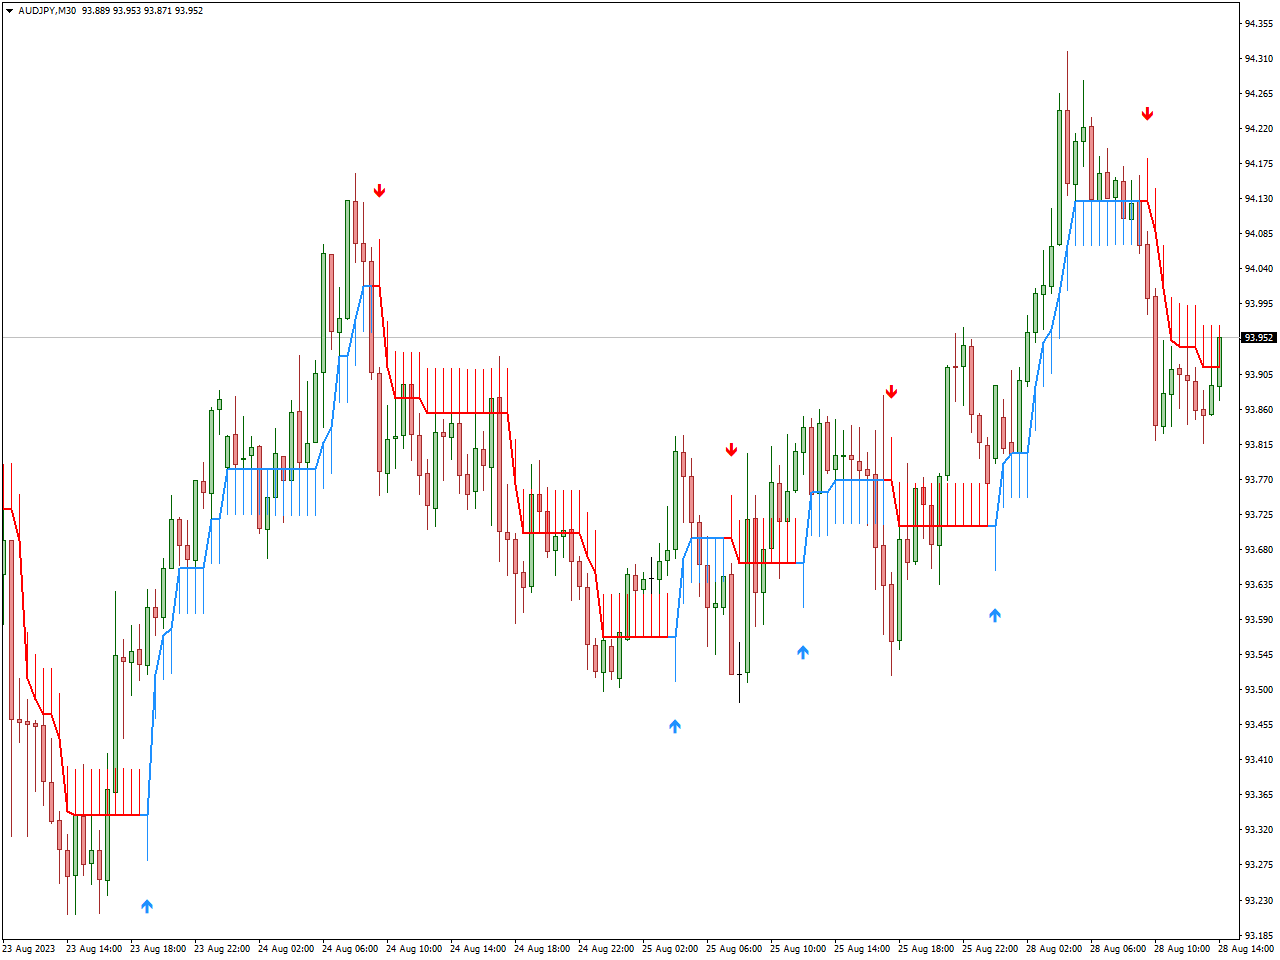
The Half Trend Buy Sell Indicator stands out as a potent tool crafted for traders navigating the financial markets, with a particular emphasis on technical analysis. Its primary goal is to furnish valuable insights into potential buying and selling opportunities by effectively identifying and illustrating the prevailing trend in the market.
Upon application to a price chart, this indicator promptly generates clear signals, clearly delineating optimal entry and exit points for trades based on the identified trend direction. The utilization of sophisticated algorithms enables the indicator to filter out market noise, providing traders with a more precise representation of the underlying trend.
Designed to cater to traders of diverse experience levels, the Half Trend Buy Sell Indicator proves advantageous for both beginners and seasoned professionals, facilitating well-informed trading decisions. Whether one is a day trader, swing trader, or engaged in long-term investing, this indicator serves as a valuable tool to elevate technical analysis and refine trading strategies.
Donchian Channel Indicator
The Donchian Channel Indicator is a powerful tool employed by traders in financial markets, especially within the realm of technical analysis. Bearing the name of its creator, Richard Donchian, this indicator is crafted to aid traders in identifying potential price trends and gauging market volatility.
Comprising three lines on a price chart—namely, an upper band, a lower band, and a middle band representing the average of high and low prices over a specified period—the Donchian Channel assists traders in spotting potential breakout or breakdown points. This offers insights into potential trend reversals and market momentum.
Traders frequently utilize the Donchian Channel Indicator to make well-informed decisions regarding market entry or exit points, evaluate trend strength, and identify potential trading opportunities. The width of the channel can also serve as an indicator of market activity, with wider channels indicating higher volatility.
FXSSI.StopLossClusters
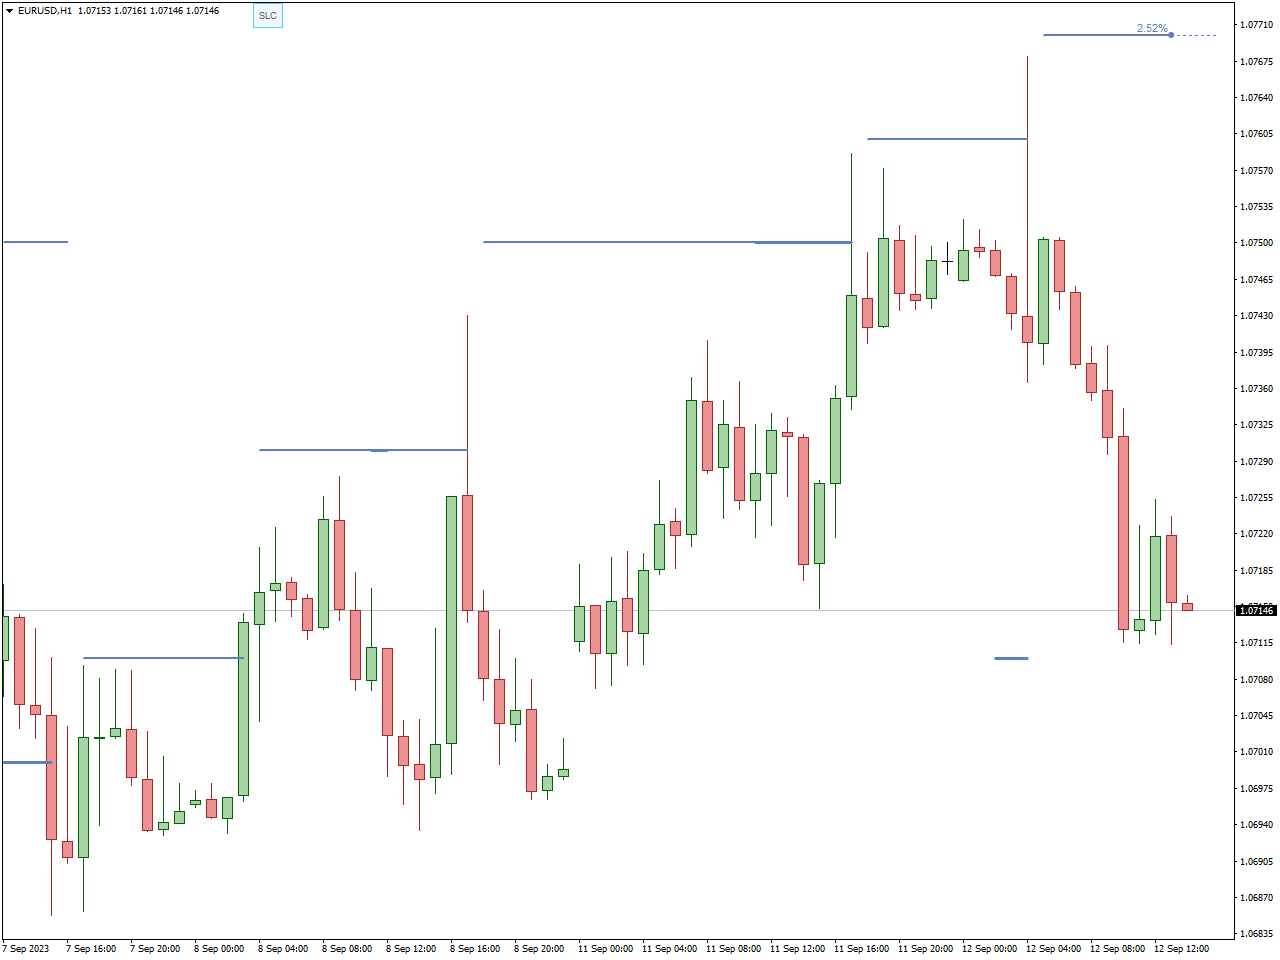
The Stop Loss Clusters (SLC) indicator unveils areas on the chart where a considerable number of market participants have established their Stop Loss orders for their trades. This indicator visually highlights the most conspicuous concentrations of these orders, commonly known as clusters, directly within the MT4 terminal.
A cluster, sometimes referred to as an accumulation, denotes a specific price range of an asset that encompasses a significant quantity of Stop Loss orders placed by other market participants. These clusters often emerge at local price peaks and valleys, as well as at critical support and resistance levels.
The thickness of the SLC indicator line exhibited on the chart is directly proportional to the overall volume of the cluster. This feature introduces a third dimension, considering the cluster volume, to the chart, resulting in a visual representation reminiscent of a heat map.
Since the trend in the market is not only rising highs and lows and vice versa, but also price movement against the majority, the FXSSI SLC indicator can rightfully be considered a trend indicator. Since it assumes the most probable direction of the price, because it can be said to “hunt” for the stop orders of most traders, who in fact, as it turns out later, open their transactions against the trend.
Schaff Trend Cycle Indicator
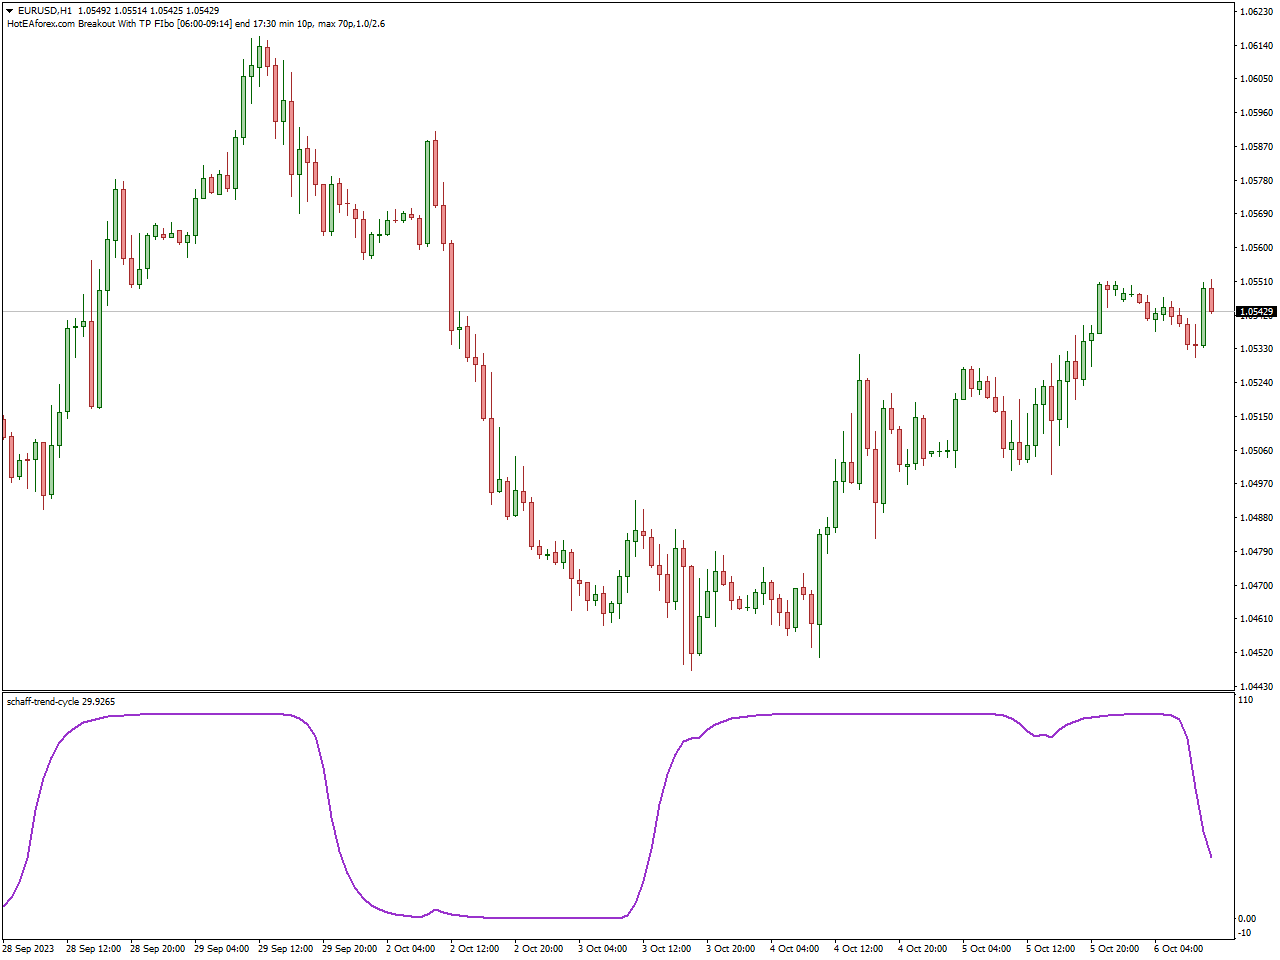
The Schaff Trend Cycle Indicator proves to be an instrumental tool in the arsenal of traders navigating financial markets, especially within the domain of technical analysis. Devised by Doug Schaff, this indicator is geared towards offering valuable insights into potential reversals in trends and providing an assessment of the overall strength of an existing trend.
Integrating concepts from the Stochastic Oscillator and the Moving Average Convergence Divergence (MACD) indicator, the Schaff Trend Cycle Indicator is crafted to discern cyclical trends, providing traders with a nuanced comprehension of market dynamics. Its utility shines particularly bright for traders seeking to identify potential inflection points in the market, empowering them to make well-informed decisions grounded in the cyclical nature of price movements.
When applied to a price chart, the Schaff Trend Cycle Indicator generates precise signals, marking optimal entry or exit points based on the identified trend cycles. Traders commonly rely on this indicator to assess the momentum and strength of a trend, extracting valuable insights for the formulation of effective trading strategies. Regardless of whether one engages in day trading, swing trading, or long-term investing, the Schaff Trend Cycle Indicator stands out as a versatile tool that enhances technical analysis and optimizes overall trading approaches.
Auto TrendLine Indicator
The Auto TrendLine Indicator stands as a robust tool tailored for traders in the financial markets, specifically within the realm of technical analysis. This indicator offers automated support for the identification and plotting of trendlines on price charts, streamlining the often intricate process of trend analysis.
Upon application to a chart, the Auto TrendLine Indicator swiftly and accurately draws trendlines, eliminating the need for manual plotting. This automation proves invaluable for traders who heavily rely on trendlines to make well-informed decisions regarding market trends and potential entry or exit points.
Noteworthy features of the Auto TrendLine Indicator include its adaptability to changing market conditions, ensuring the provision of dynamic trendlines that effectively reflect the evolving price action. Traders can derive substantial benefits from this indicator by gaining a clearer visual representation of trend directions and utilizing the automatically drawn trendlines for precise technical analysis.
In essence, the Auto TrendLine Indicator stands out as a user-friendly and efficient tool suitable for traders across various experience levels. It offers a seamless way to incorporate trendlines into trading strategies, thereby enhancing the precision of market analysis and aiding in more informed decision-making.
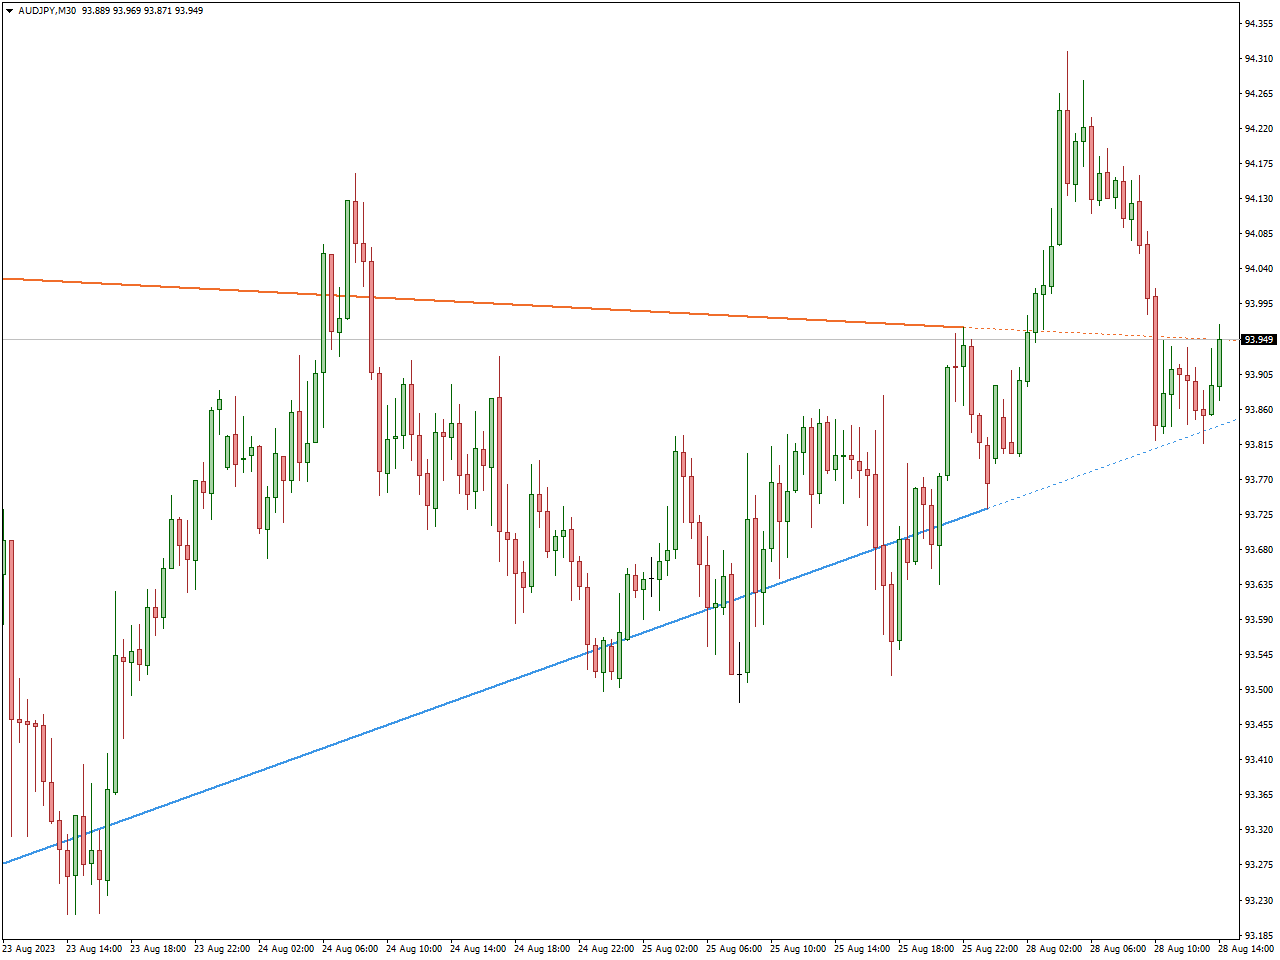
Trendline Indicator MT4
The Trendline Indicator stands as a pivotal tool for traders navigating financial markets, particularly within the domain of technical analysis. This indicator plays a crucial role in identifying and visually representing trend directions on price charts, providing traders with valuable insights to make well-informed decisions.
Upon application to a chart, the Trendline Indicator precisely draws lines that connect significant price points, effectively highlighting the prevailing trend. Traders commonly leverage trendlines to discern potential entry or exit points, assess trend strength, and anticipate possible reversals in the trend.
A standout feature of the Trendline Indicator lies in its adaptability to diverse market conditions. This flexibility empowers traders to adjust and modify trendlines, ensuring their continued relevance and accuracy in the dynamic landscape of price movements.
Whether you are a novice embarking on your trading journey or an experienced trader refining your strategies, the Trendline Indicator proves indispensable for seamlessly incorporating technical analysis into your approach. It offers a clear visual representation of market trends, thereby facilitating more precise decision-making in the complex world of financial trading.
High Way Channel Indicator
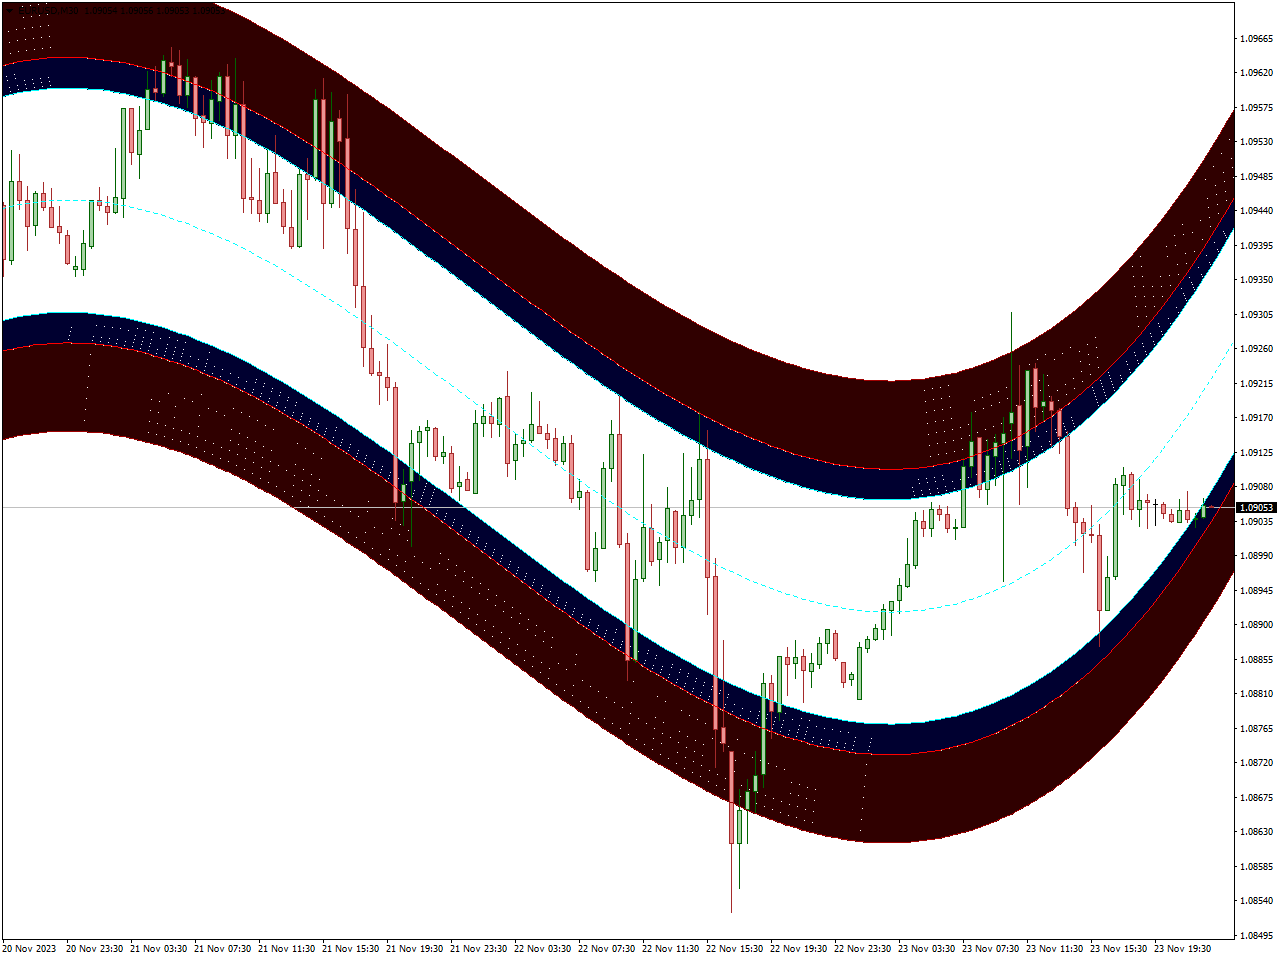
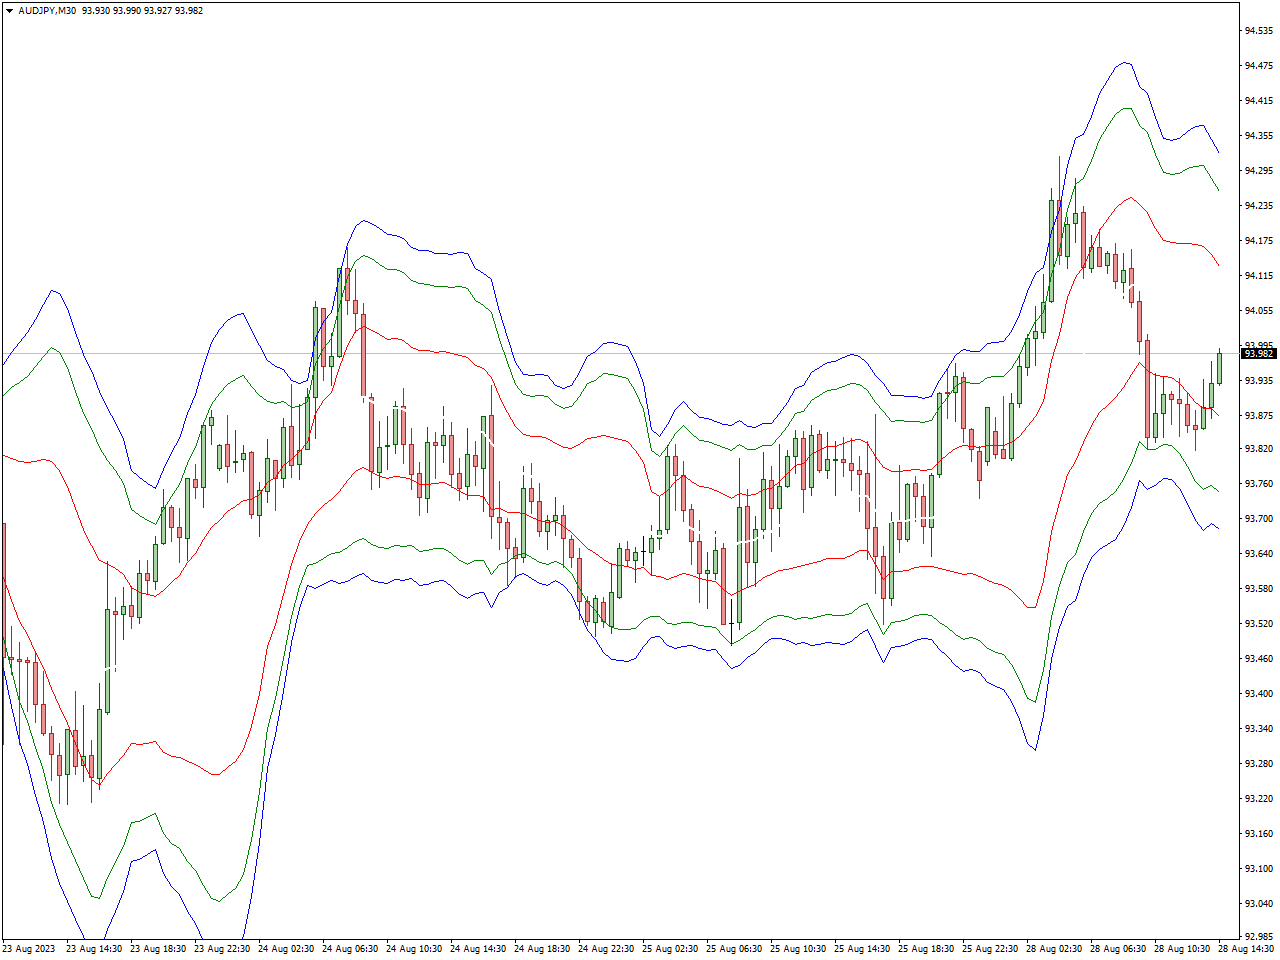
The High Way Channel indicator, designed for compatibility with MetaTrader, emerges as a dynamic tool in the domain of forex trading. Aptly named for its visual resemblance to a highway, this indicator distinguishes itself by efficiently identifying and charting price channels directly on your trading chart.
What makes the High Way Channel indicator unique is its distinctive feature – the incorporation of two specific zones within the channel where price reversals are expected. The initial reversal point is represented by the BLUE zone, while the subsequent potential reversal is indicated by the RED zone.
For BUY Signals: Begin by identifying the trend bias, such as a bullish trend. Subsequently, await the price to engage with the lower RED zone of the channel. Once this occurs, consider opening a BUY/LONG position, especially after price action forms a bullish candlestick pattern, such as a bullish engulfing.
For SELL Signals: Commence by identifying the trend bias, such as a bearish trend. Then, observe the price as it interacts with the upper RED zone of the channel. Following this interaction, you may opt to open a SELL/SHORT position, particularly when price action forms a bearish candlestick pattern, such as a bearish engulfing.
Trend Strength Indicator
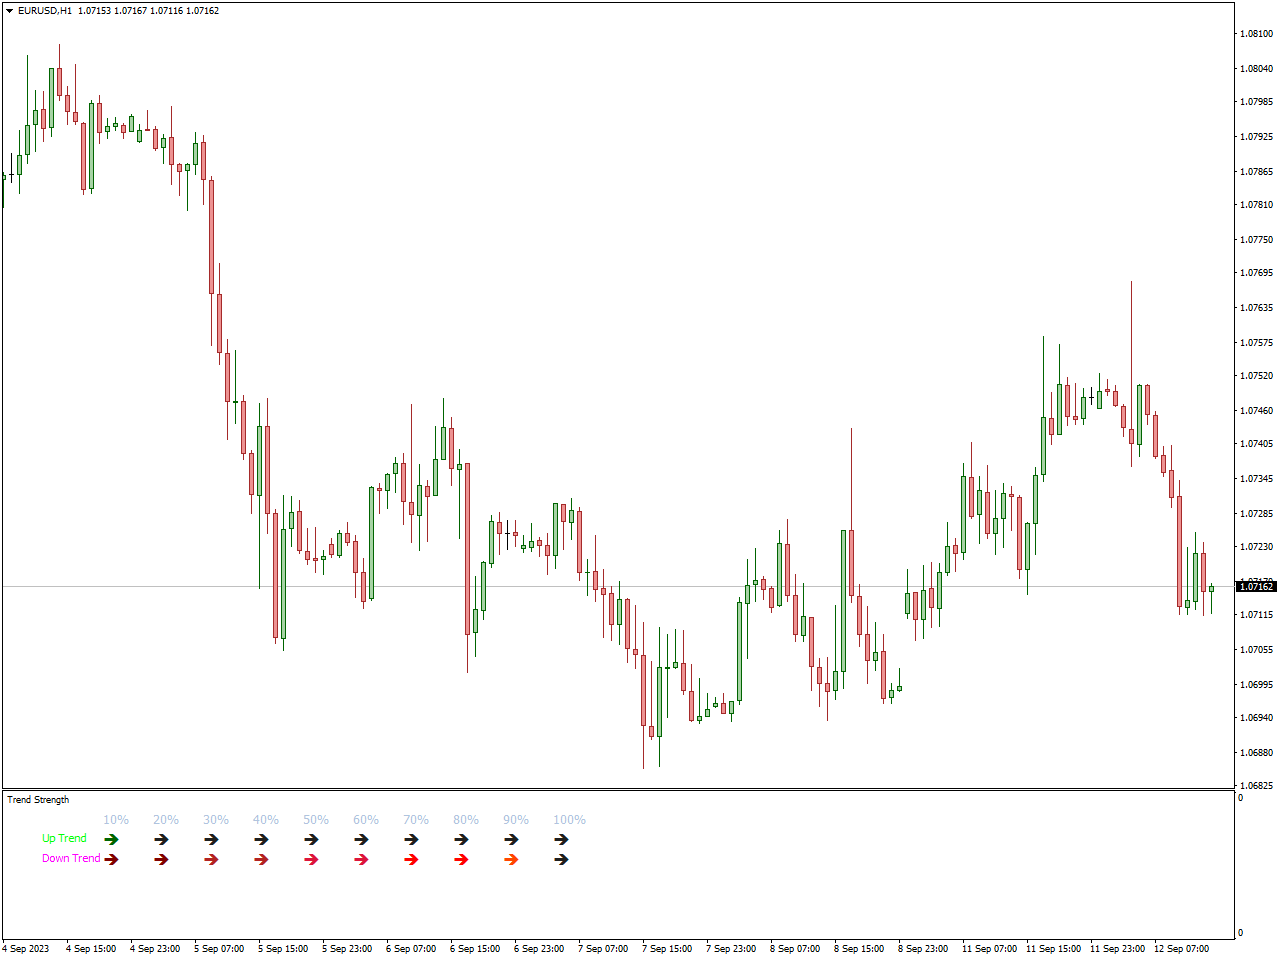
The Trend Strength Indicator stands as a potent tool utilized by traders in financial markets, particularly in the domain of technical analysis. Its primary purpose is to assess the strength and momentum of the existing market trend, providing traders with valuable insights for making well-informed decisions.
When applied to a price chart, the Trend Strength Indicator generates visual representations that effectively communicate the vigor of the ongoing trend. This aids traders in determining whether a trend possesses robustness and is likely to persist, or if it is waning, potentially signaling a reversal or corrective phase.
Traders often integrate the Trend Strength Indicator with other technical analysis tools to fine-tune their trading strategies. A comprehensive understanding of a trend’s strength enables traders to optimize entry and exit points, manage risk more efficiently, and align their trading decisions with the prevailing market conditions.
Heiken Ashi Smoothed Indicator
The Heiken Ashi Smoothed Indicator proves to be a valuable asset for traders in financial markets, particularly within the realm of technical analysis. This indicator serves as a refined version of the traditional Heiken Ashi, strategically crafted to offer a smoother depiction of price trends.
Diverging from conventional candlestick charts, the Heiken Ashi Smoothed Indicator utilizes modified candlesticks to sift through market noise and underscore the overall trend direction. The process involves calculating smoothed candles based on a blend of the current and preceding candlestick values, resulting in a chart that is not only visually appealing but also more focused on the prevailing trend.
Traders commonly employ the Heiken Ashi Smoothed Indicator to pinpoint the dominant trend, identify potential trend reversals, and determine optimal entry or exit points. Its capacity to diminish noise and accentuate trend direction renders it an invaluable tool for both novice and seasoned traders. Integrating this indicator into technical analysis strategies enhances the precision of trend identification and contributes to more informed trading decisions.
Fibonacci Retracement Indicator
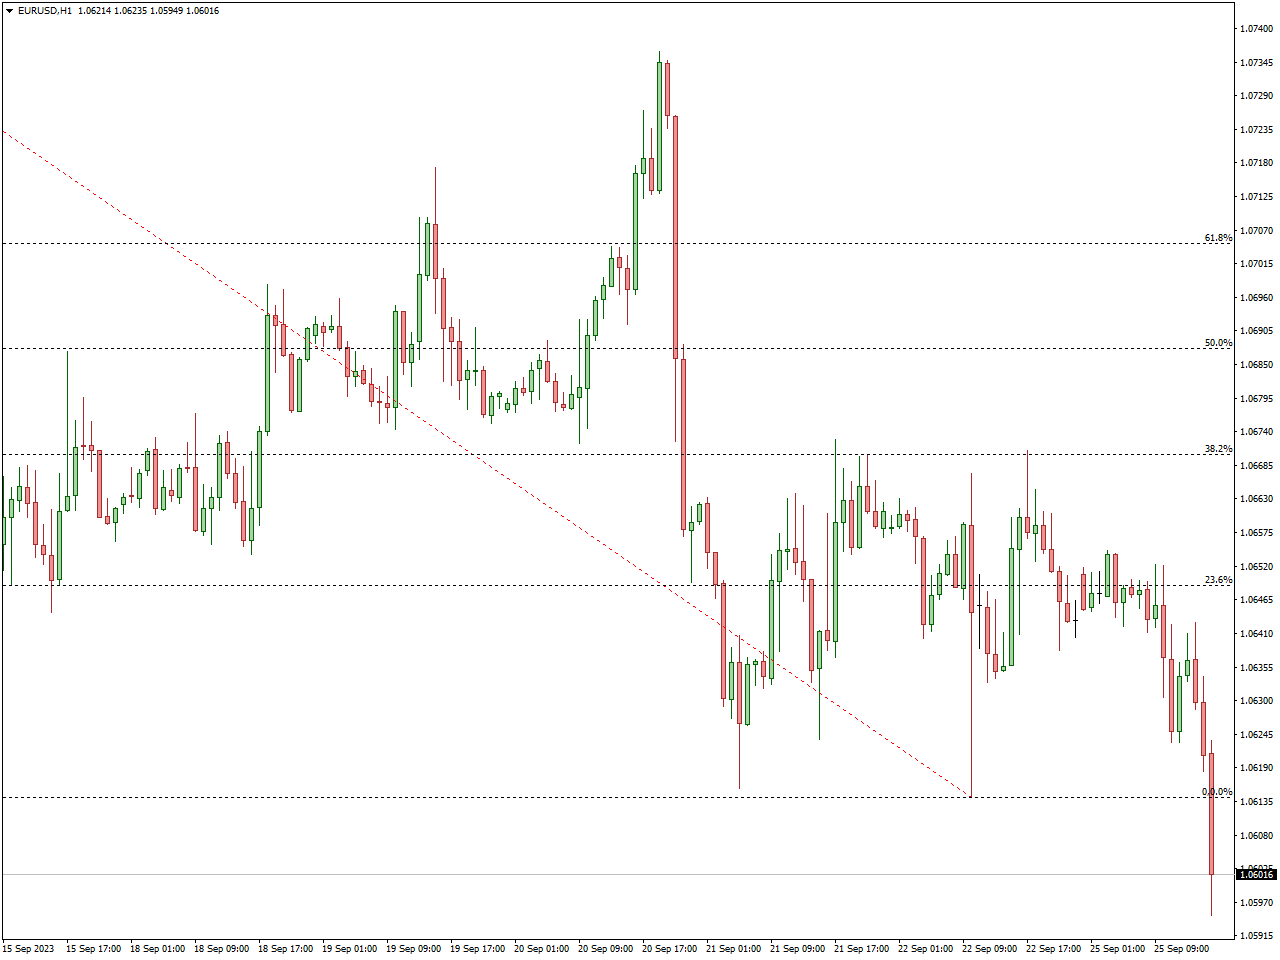
The Fibonacci Retracement Indicator proves to be an influential tool employed by traders in financial markets, especially within the realm of technical analysis. Grounded in the Fibonacci sequence, a mathematical principle that pinpoints crucial levels of potential support and resistance on a price chart, this indicator offers valuable insights for market analysis.
Upon application to a price chart, the Fibonacci Retracement Indicator generates horizontal lines, denoting potential levels where a price trend might undergo a reversal or a notable pullback. These levels are computed based on Fibonacci ratios, such as 38.2%, 50%, and 61.8%, believed to align with natural retracement levels in financial markets.
Traders regularly utilize the Fibonacci Retracement Indicator to pinpoint potential entry or exit points and to assess the vigor and trajectory of an ongoing trend. By highlighting key retracement levels, the indicator aids traders in making well-informed decisions about market entry, strategically placing stop-loss orders, and identifying areas of potential trend continuation.
Whether you’re a novice or a seasoned trader, the Fibonacci Retracement Indicator stands as a versatile tool for conducting technical analysis, contributing to the refinement of your trading strategy with enhanced precision.
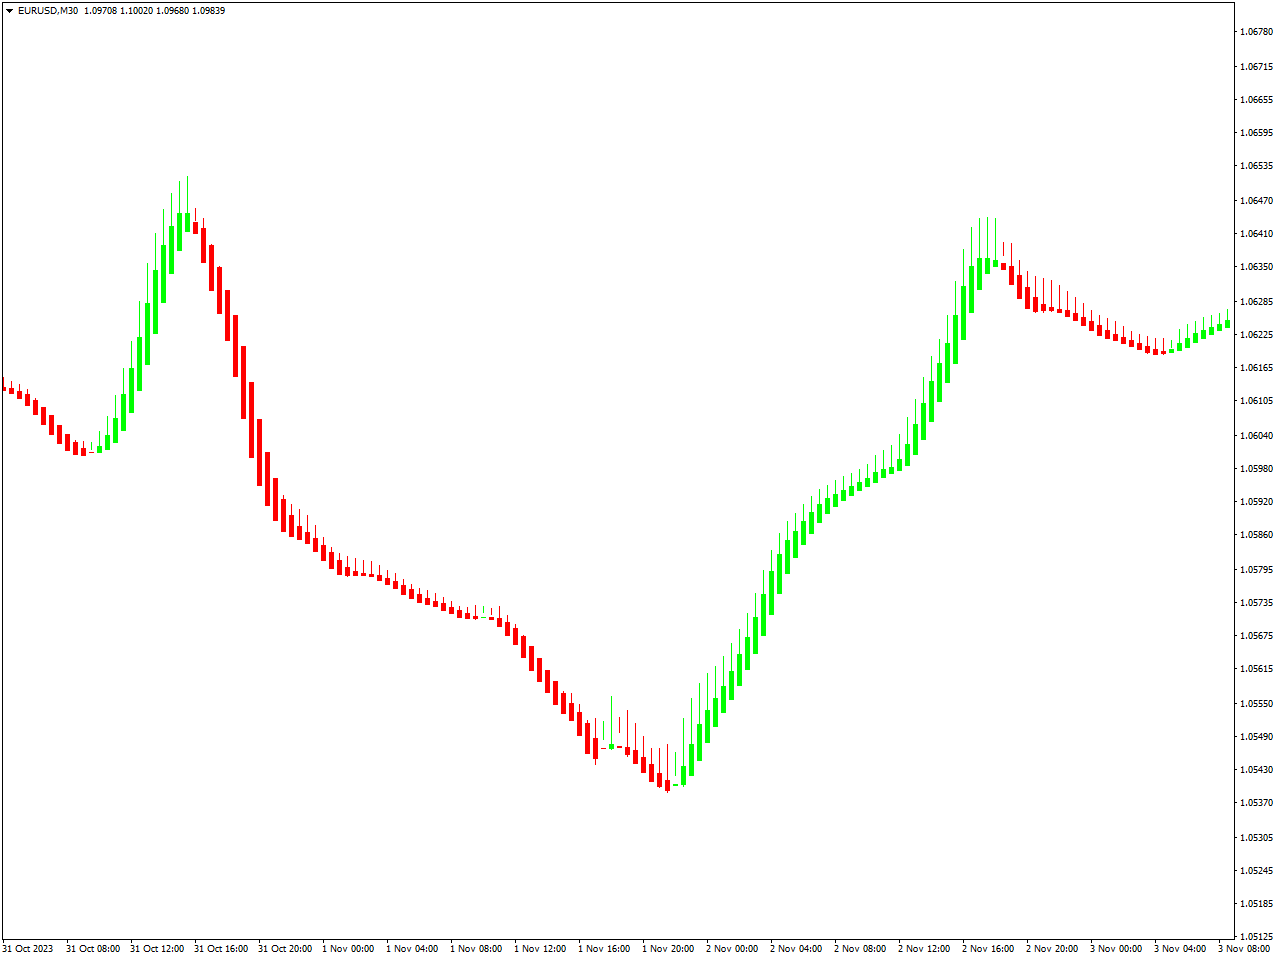
Power Trend Indicator
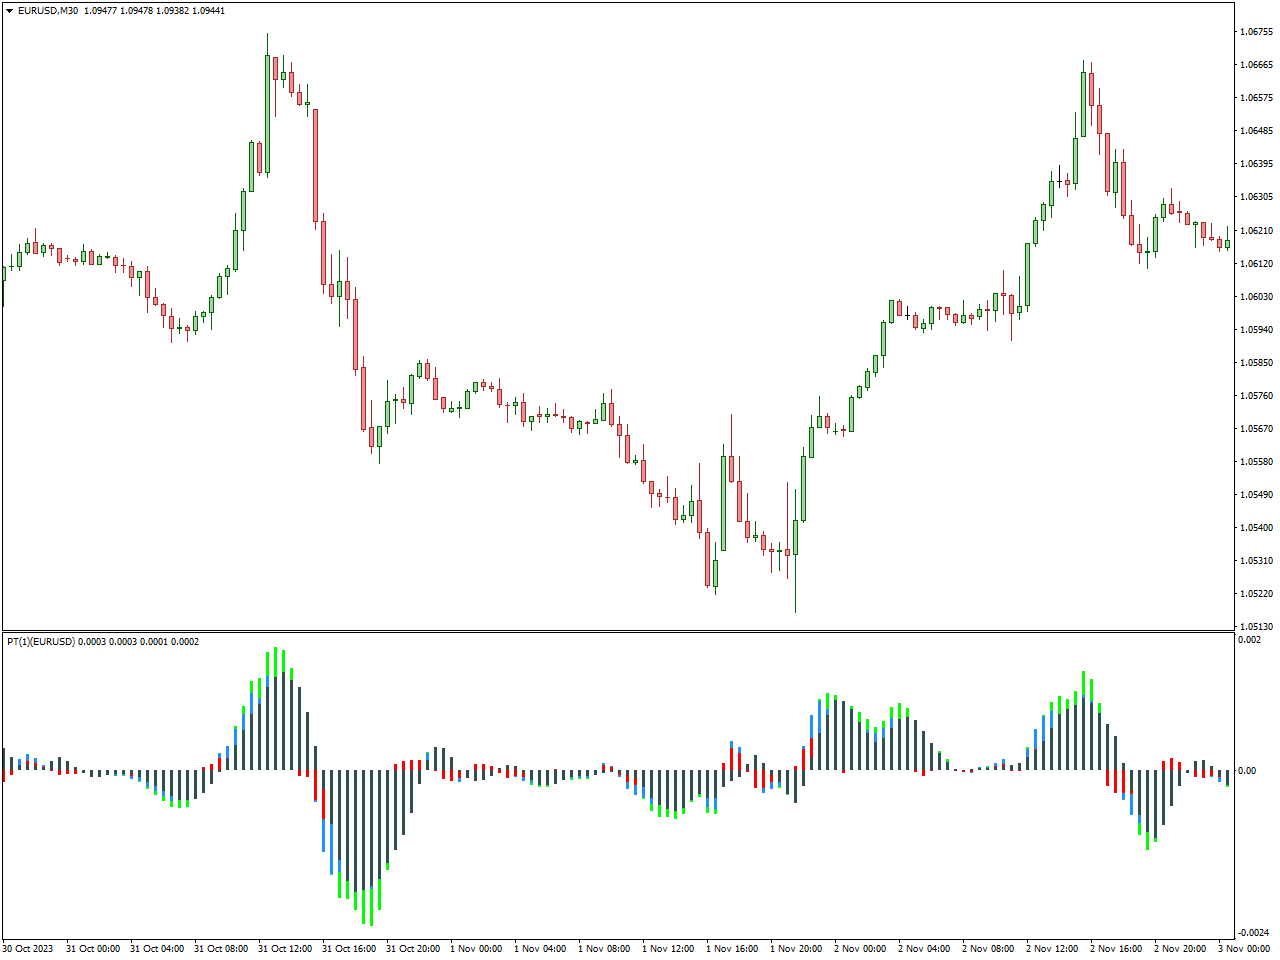
The primary objective of forex technical traders revolves around discerning the trend’s direction, a crucial determinant for successful trading. While many technical indicators can identify trends, they often fall short in gauging the trend’s true strength. The Power Trend indicator for MT4 addresses this limitation by visually representing the presence, direction, and strength of a trend in distinct colors. This key feature empowers traders with invaluable insights into the essence of the prevailing trend.
The Power Trend indicator vividly portrays trend strength through a spectrum of colors. These colors serve as a guide for forex traders to identify weak trends, anticipate potential new trends, and ascertain whether the trend’s strength is moderate or firmly established. Such information, provided by the Power Trend indicator, is critical for traders in pinpointing optimal entry and exit points. By preventing premature exits from profitable trades, traders can maximize their profits. The visual representation of trend strength through colored histograms allows traders to strategize effectively across different trend scenarios.
Exiting a trade becomes a strategic decision based on the histogram’s color transition. A shift to black indicates a weakening trend, while a change to red signifies the emergence of a new trend. The clear visualization of these histogram colors simplifies trend identification for novice traders, enabling them to ride the trend wave until its completion. Meanwhile, seasoned traders leverage the nuanced understanding of various trend strength levels to devise advanced trading strategies.
EMA Indicator
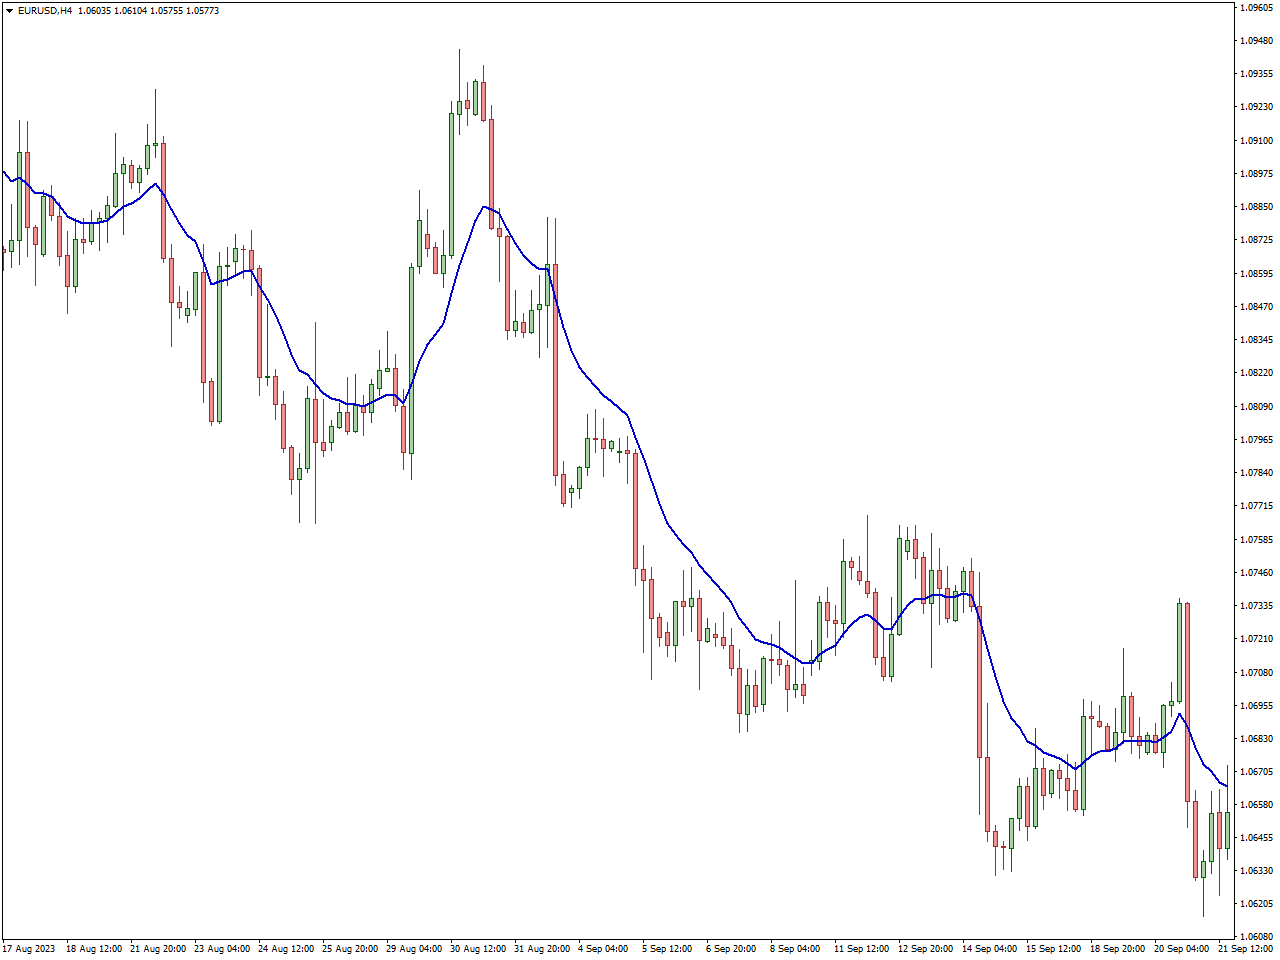
The Exponential Moving Average (EMA) Indicator holds a pivotal role among traders in financial markets, particularly in the field of technical analysis. Distinguishing itself from the Simple Moving Average (SMA), the EMA places heightened importance on recent price data, elevating its responsiveness to the evolving market conditions.
Upon application to a price chart, the EMA Indicator refines price data through a computation of an average grounded in the exponential weighting of recent prices. This calculation results in a line that closely mirrors recent price movements, effectively capturing shifts in market sentiment with heightened sensitivity.
Traders routinely employ the EMA Indicator to decipher the prevailing trend direction, anticipate potential reversals, and identify optimal entry or exit points. Its acute responsiveness to recent price shifts renders it indispensable for those seeking a nuanced understanding of more immediate market dynamics.
Whether you’re a newcomer or a seasoned trader, the EMA Indicator serves as a versatile and dynamic instrument for conducting technical analysis, empowering the formulation of well-informed trading decisions.
MACD 4C Indicator
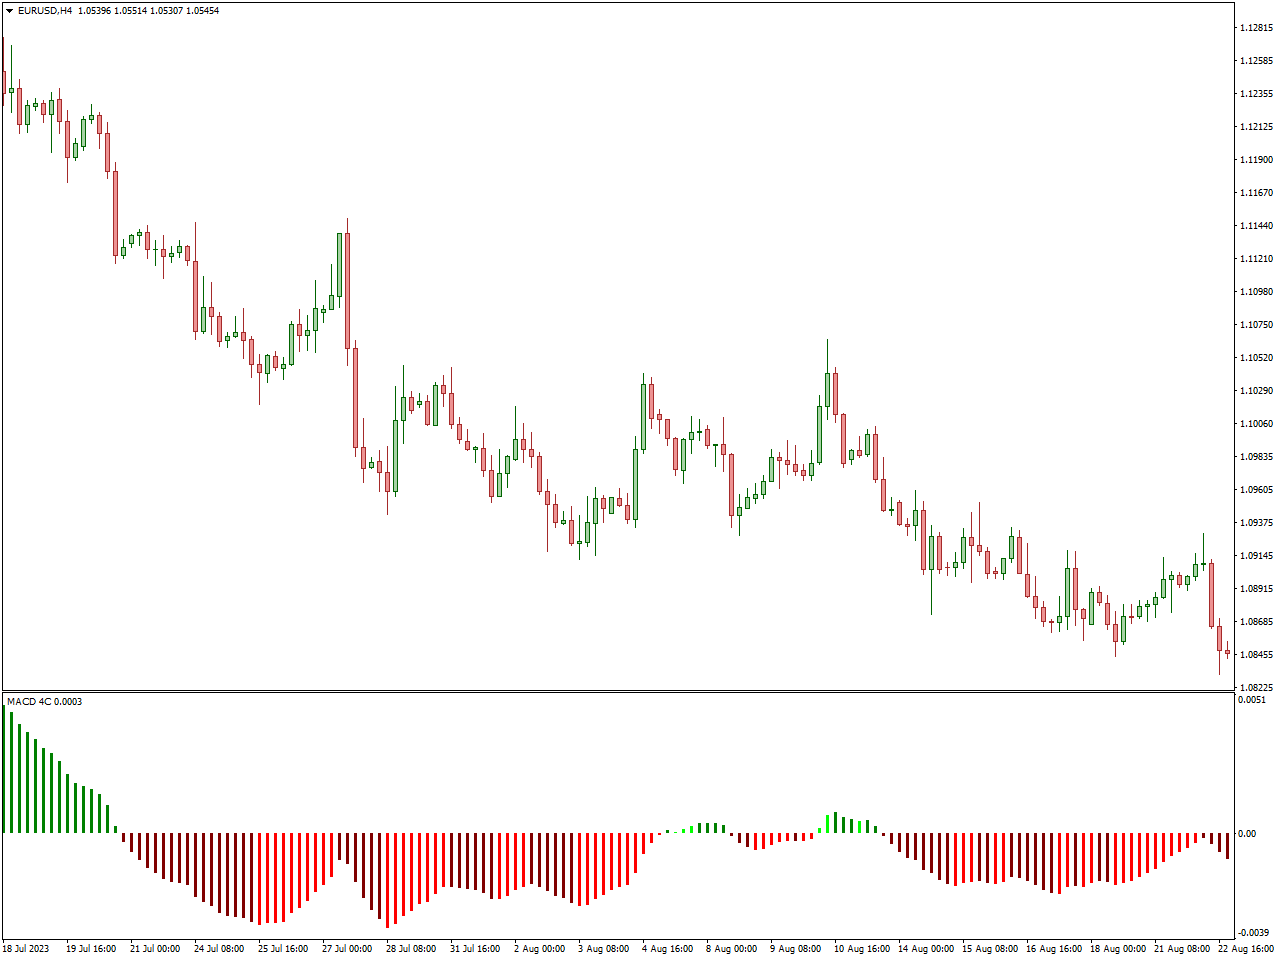
The MACD 4C Indicator is a tool employed in financial markets, encompassing stocks, forex, and commodities, designed to assist traders in recognizing potential trends, trend reversals, and shifts in momentum. An acronym for Moving Average Convergence Divergence, the “4C” in this indicator’s name signifies the inclusion of four distinct components within the MACD framework. This integration offers traders a more comprehensive understanding of market dynamics.
Introducing a central reference line, commonly known as the zero line or centerline, into the traditional MACD structure sets the MACD 4C Indicator apart. Traders closely monitor crossovers involving the MACD line, the signal line, and this central line. Specifically, an upward crossover of the MACD line above the centerline may indicate a shift from bearish to bullish momentum, signaling a potential positive change in market sentiment. Conversely, a downward crossover of the MACD line below the centerline suggests a shift from bullish to bearish momentum, indicating a potential negative change in market sentiment. These interactions with the centerline are pivotal aspects of the MACD 4C Indicator, facilitating the identification of shifts in market direction and momentum.
Conclusion
In the ever-changing landscape of financial markets, maintaining a competitive edge necessitates a mastery of trend analysis. Our journey through the finest trend indicators has provided us with valuable insights into tools capable of reshaping the way we perceive and respond to market trends. Each indicator serves a distinctive role in unraveling the complexities of market behavior. As we bring our exploration to a close, it’s essential to recognize that no single indicator harbors the secret to perpetual success. Instead, it’s the strategic integration and interpretation of these tools that empower traders to skillfully navigate the undulating waves of trends. Armed with this knowledge, may your trading journey be characterized by well-informed decisions and prosperous outcomes in the thrilling realm of financial markets.