
Oscillator indicators are essential instruments in a trader’s toolkit, offering crucial insights into market dynamics and momentum. From widely recognized indicators like the MACD to the versatile RSI, these tools hold a central role in technical analysis. As traders endeavor to unravel the intricacies of financial markets, achieving proficiency in the use of oscillators becomes a fundamental pursuit. This exploration delves into the core of the finest oscillator indicators, unveiling their importance and shedding light on their contributions to a trader’s adeptness in navigating trends, spotting reversals, and staying abreast of the ever-shifting market terrain.
TOP 20 Oscillator Indicators
- MACD 2 Line Indicator
- Schaff Trend Cycle Indicator
- Vortex Indicator
- Advanced ADX Indicator
- Woodies CCI Arrows Oscillator Indicator
- TRIX.Crossover
- Percentage Volume Oscillator Indicator
- Wave Trend Oscillator Indicator
- Spearman Correlation Indicator
- Elliott Wave Oscillator Indicator
- Heiken Ashi Oscillator Indicator
- FXSSI.Ratios
- AO Divergence Indicator
- StochRSI Indicator
- Trend Arrow Indicator
- Commodity Channel Index (CCI) Indicator
- Synthetic VIX Indicator
- Smoothed RSI Indicator
- Money Flow Index Indicator (MFI)
- Awesome Oscillator Indicator
MACD 2 Line Indicator
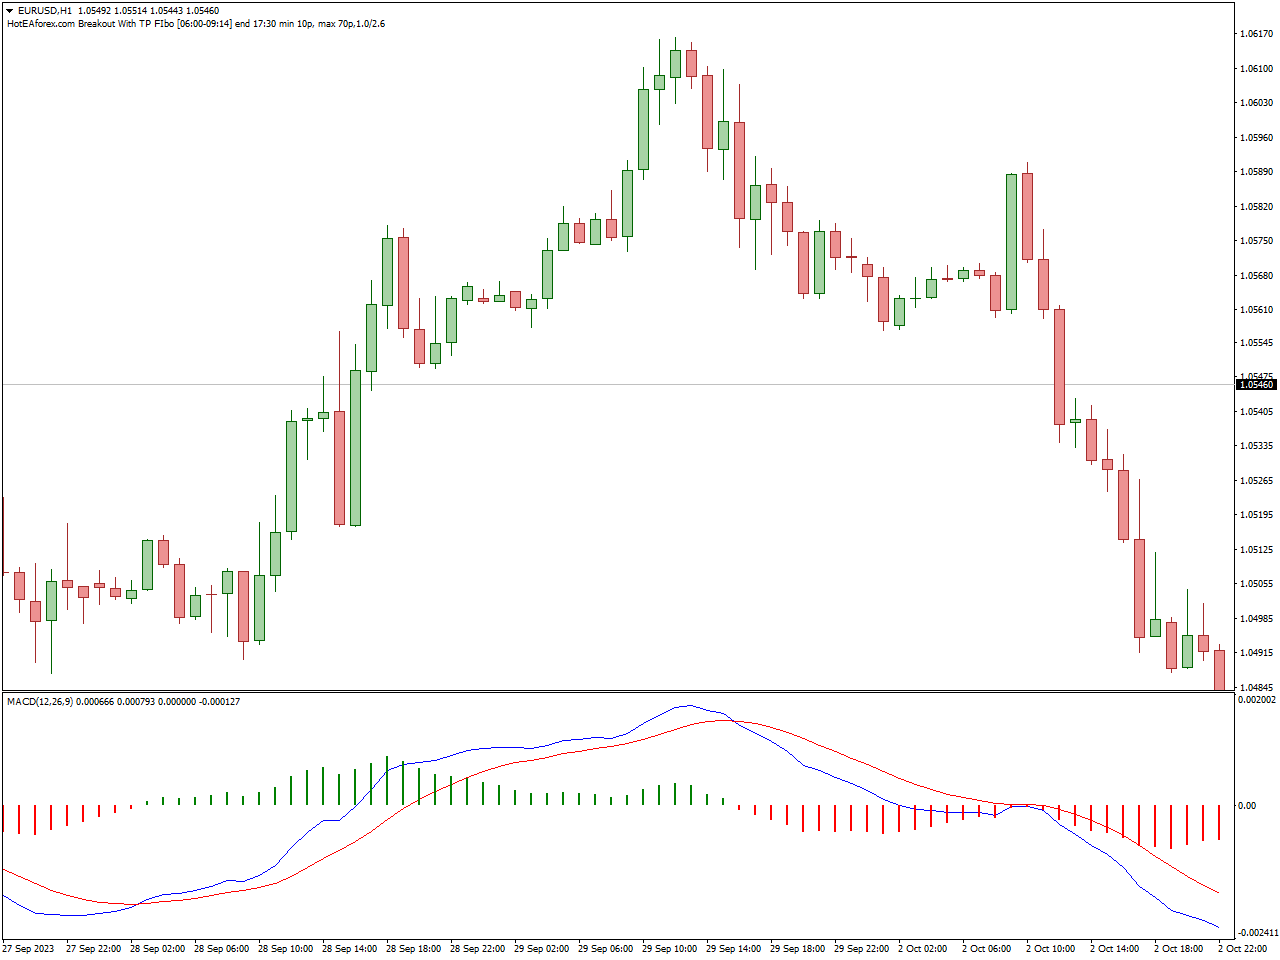
The MACD 2 Line Indicator serves as a widely utilized tool in financial markets for evaluating trends, momentum, and possible trend reversals. MACD, an acronym for Moving Average Convergence Divergence, is streamlined in the 2 Line variant, featuring only two lines on the chart.
These lines include the MACD line and the signal line. The MACD line denotes the variance between two exponential moving averages (EMAs), typically the 12-day EMA and the 26-day EMA. Subsequently, the signal line, often represented by a 9-day EMA, is applied to the MACD line. Traders closely monitor crossovers and divergences between these lines to discern potential buy or sell signals.
A crucial feature of the MACD 2 Line Indicator is its capacity to visually depict the relationship between short-term and long-term moving averages. This visualization assists traders in making well-informed decisions regarding market trends and potential entry or exit points. Whether you’re a novice or an experienced trader, the MACD 2 Line Indicator proves to be a valuable asset in your technical analysis toolkit.
Schaff Trend Cycle Indicator
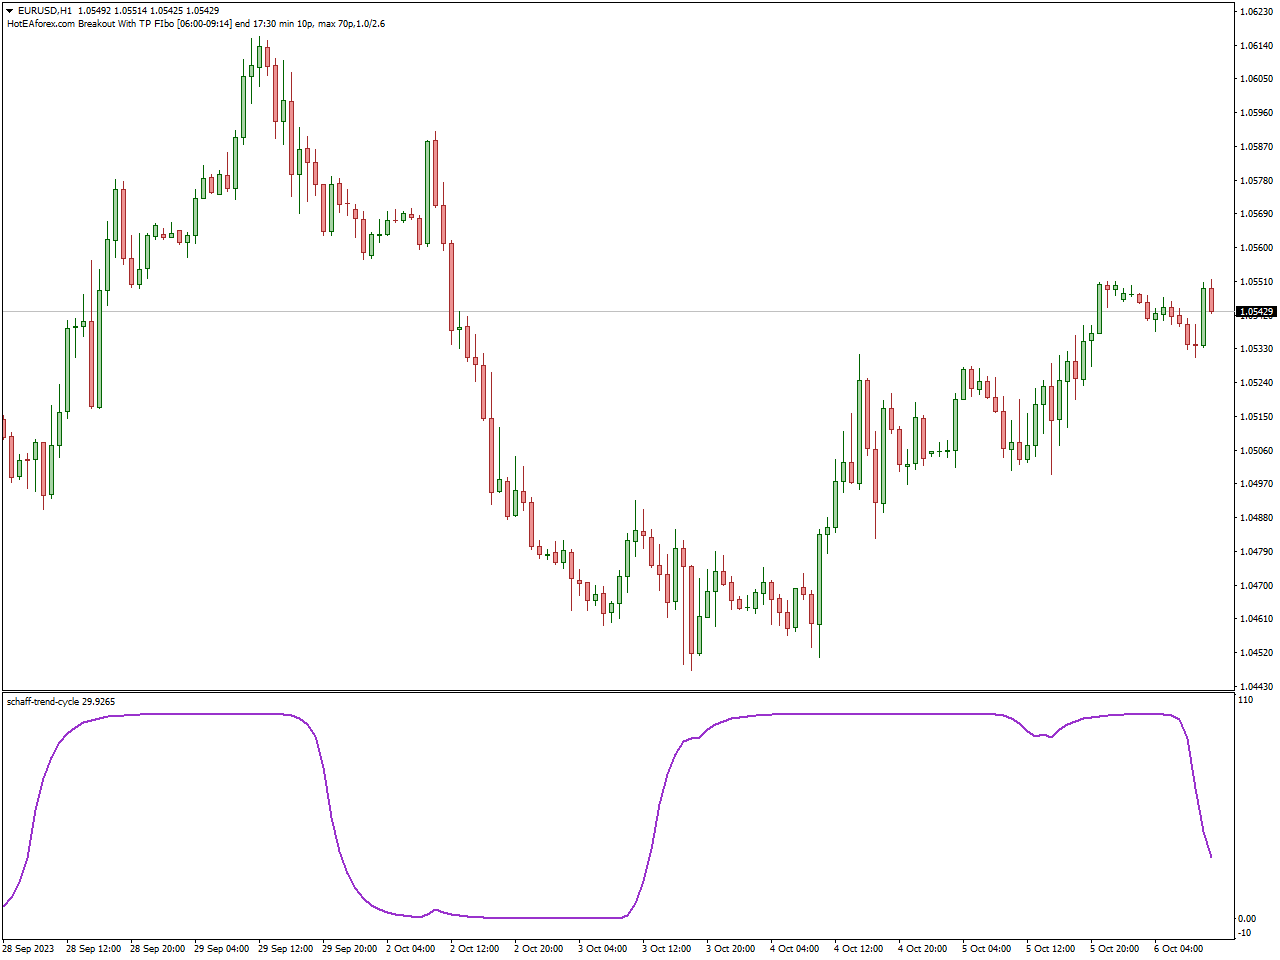
The Schaff Trend Cycle Indicator is a technical analysis tool utilized by traders in financial markets, especially within the domain of technical analysis. Crafted by Doug Schaff, this indicator is designed to offer valuable insights into potential trend reversals and the overall strength of an existing trend.
By integrating principles from the Stochastic Oscillator and the Moving Average Convergence Divergence (MACD) indicator, the Schaff Trend Cycle Indicator is formulated to identify cyclical trends, providing a more nuanced understanding of market dynamics. It proves particularly advantageous for traders aiming to pinpoint potential turning points in the market, guiding them in making well-informed decisions based on the cyclical nature of price movements.
When applied to a price chart, the Schaff Trend Cycle Indicator generates distinct signals that delineate optimal points for entering or exiting trades in alignment with the identified trend cycles. This indicator serves as a versatile tool for traders, offering insights into the momentum and strength of a trend, thereby providing valuable information for refining and optimizing trading strategies.
Vortex Indicator
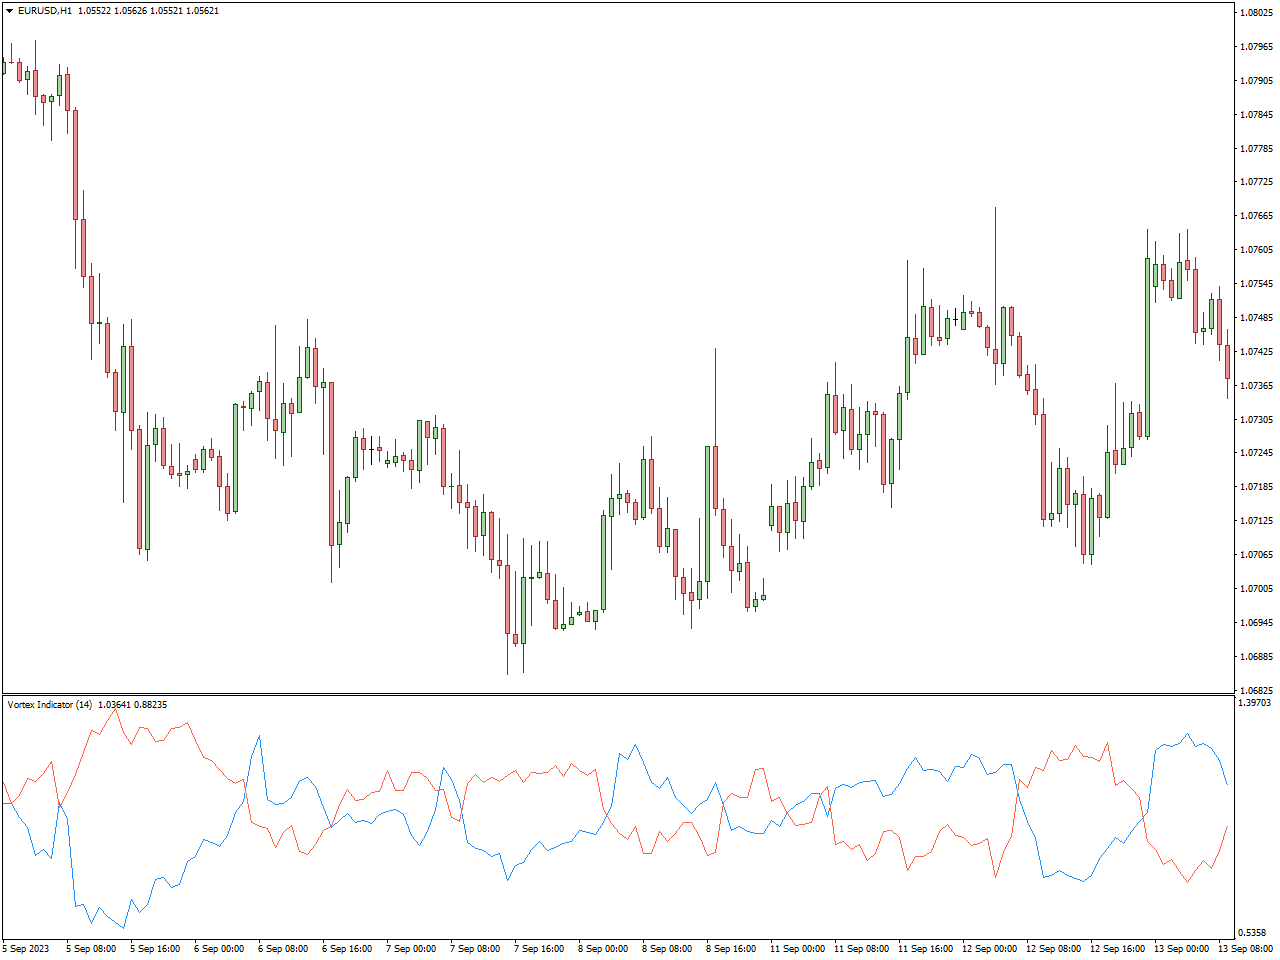
The Vortex Indicator is widely used by traders in financial markets.. Its primary objective is to furnish insights into the direction and strength of an ongoing trend.
Etienne Botes and Douglas Siepman collaborated in the development of the Vortex Indicator, which incorporates two oscillators: the Positive Vortex and Negative Vortex. These elements gauge upward and downward price movements within a defined timeframe, providing a visual representation of the trend’s strength and potential reversal zones.
Upon application to a price chart, the Vortex Indicator produces distinctive signals that highlight the momentum of the trend and possible shifts. Traders commonly rely on these signals to pinpoint opportune moments for entering or exiting trades and to assess the overall robustness of a trend.
Advanced ADX Indicator
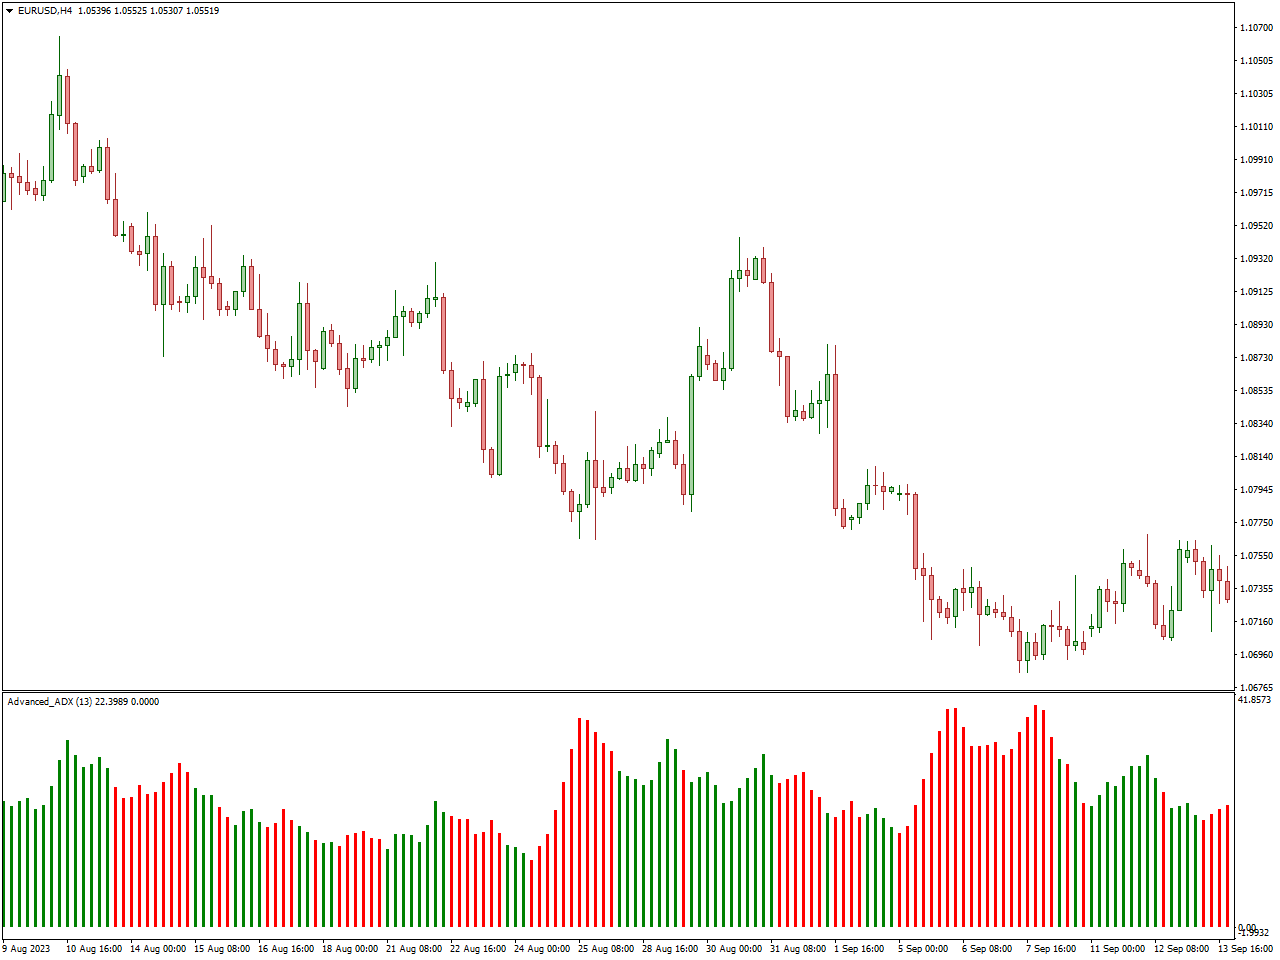
The Enhanced Average Directional Index (ADX) Indicator stands as a sophisticated tool extensively employed by traders in financial markets, particularly within the domain of technical analysis. This indicator builds upon the foundational ADX, which is crafted to evaluate the strength and direction of an existing trend.
Distinguished by its advanced features and refinements, the Enhanced ADX Indicator aims to furnish traders with more intricate insights into trend strength, potential reversals, and the overarching dynamics of market movements. By applying this indicator to a price chart, traders gain access to signals and visual representations that depict trend strength. The analysis of these signals empowers traders to make more discerning decisions regarding trade entry or exit points, risk management, and the optimization of their overall trading strategy. Tailored to meet the needs of traders navigating dynamic financial markets, this advanced iteration of the ADX Indicator offers a comprehensive tool for technical analysis.
Woodies CCI Arrows Oscillator Indicator
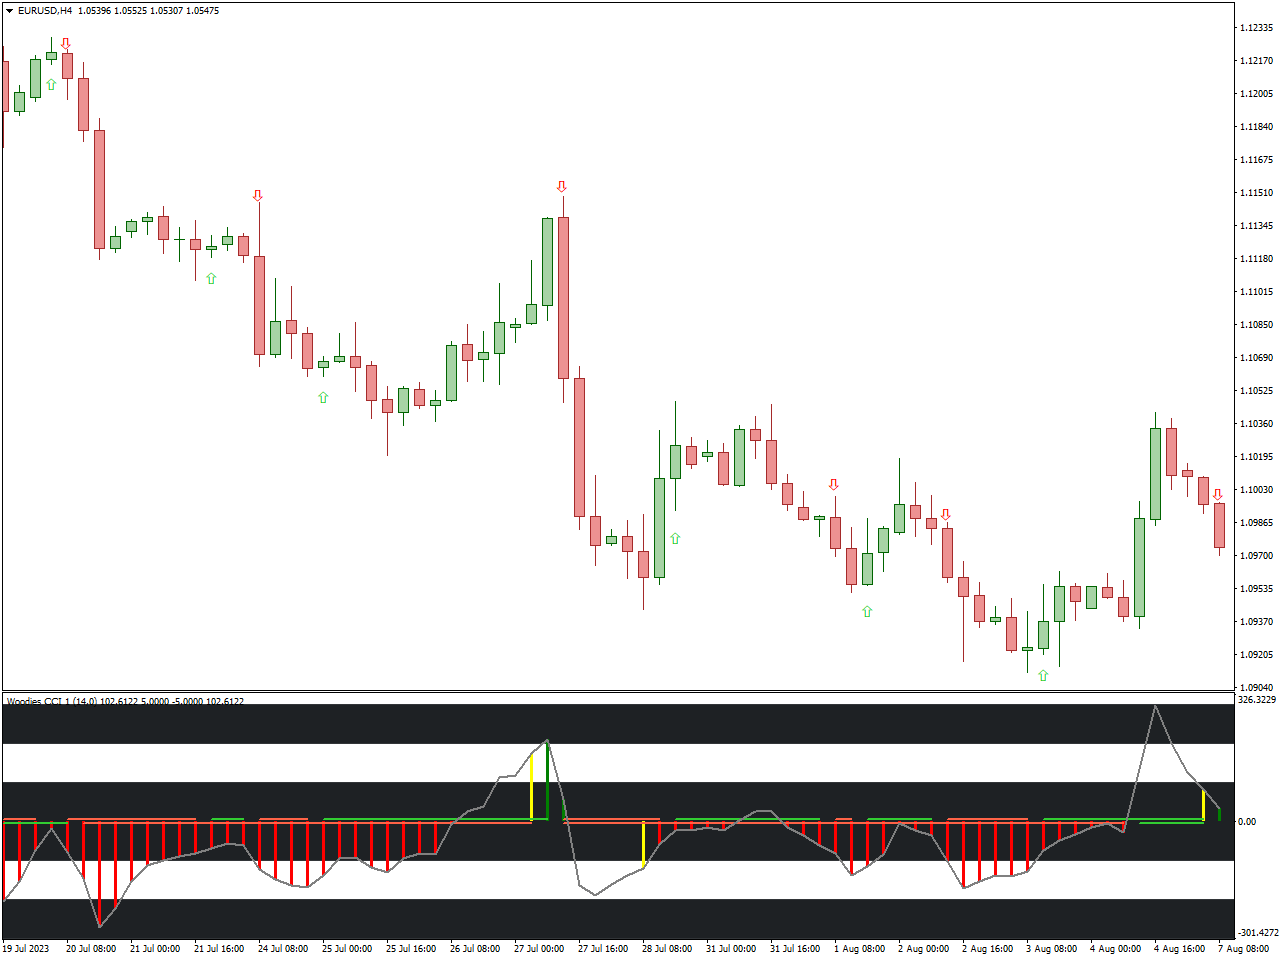
The Woodies CCI Arrows Oscillator designed for MT4/MT5 is a crucial tool for forex traders adhering to Woodies patterns and strategy. Functioning as a momentum indicator, it relies on the 14-period CCI (Commodity Channel Index) MT4/MT5 indicator. This unique feature allows forex traders not only to identify and trade Woodies patterns but also to leverage various other CCI-based patterns. Additionally, the indicator offers arrow signals, serving as optimal entry points.
The trading signals manifest as RED and GREEN arrows within the chart window. Traders can initiate a BUY position upon the appearance of a GREEN arrow and exit when confronted with an arrow of the opposite color. Similarly, for SELL signals indicated by a RED arrow, traders can enter a position and exit upon encountering an opposing arrow. The flexibility of waiting for the contrary signal enables traders to fully capitalize on the prevailing trend.
Moreover, the Woodies CCI Arrows Oscillator presents diverse trading possibilities by incorporating CCI, Turbo CCI, Zero Line, Histogram, and the 200 levels. This versatility proves highly advantageous for experienced forex traders, allowing them to integrate arrow signals seamlessly into their technical analysis and overall trading strategy.
TRIX.Crossover
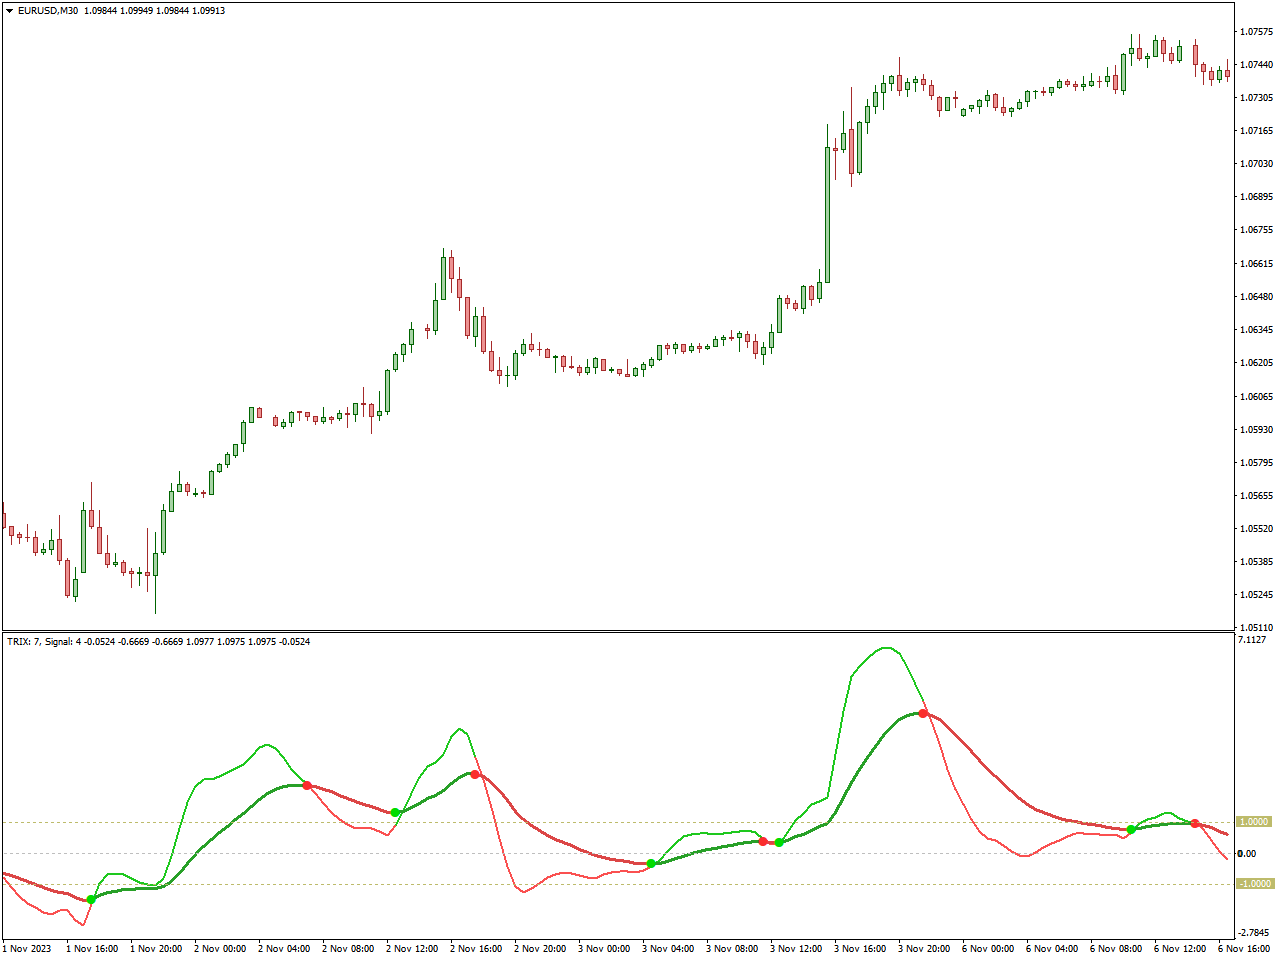
The TRIX Crossover Indicator is a tool applied in financial markets, particularly in the context of market analysis.. TRIX, denoting Triple Exponential Average, is the focal point of this crossover indicator, aiming to pinpoint potential crossover instances in the TRIX line.
Derived from a triple exponential moving average of the price, the TRIX indicator triggers the crossover indicator when its line crosses above or below a signal line—typically a simple moving average of the TRIX line.
Key trading signals produced by the TRIX Crossover Indicator encompass:
- Bullish Crossover: This occurs when the TRIX line surpasses the signal line, signaling a potential shift toward a bullish trend. Traders may interpret this as a cue to contemplate buying.
- Bearish Crossover: This takes place when the TRIX line descends below the signal line, indicating a potential shift toward a bearish trend. Traders may perceive this as a prompt to contemplate selling.
As with any technical indicator, traders often combine the TRIX Crossover Indicator with additional tools to confirm signals and make well-informed trading decisions. Considering market conditions, trend strength, and other factors is crucial before executing trades based on indicator crossovers.
Percentage Volume Oscillator Indicator
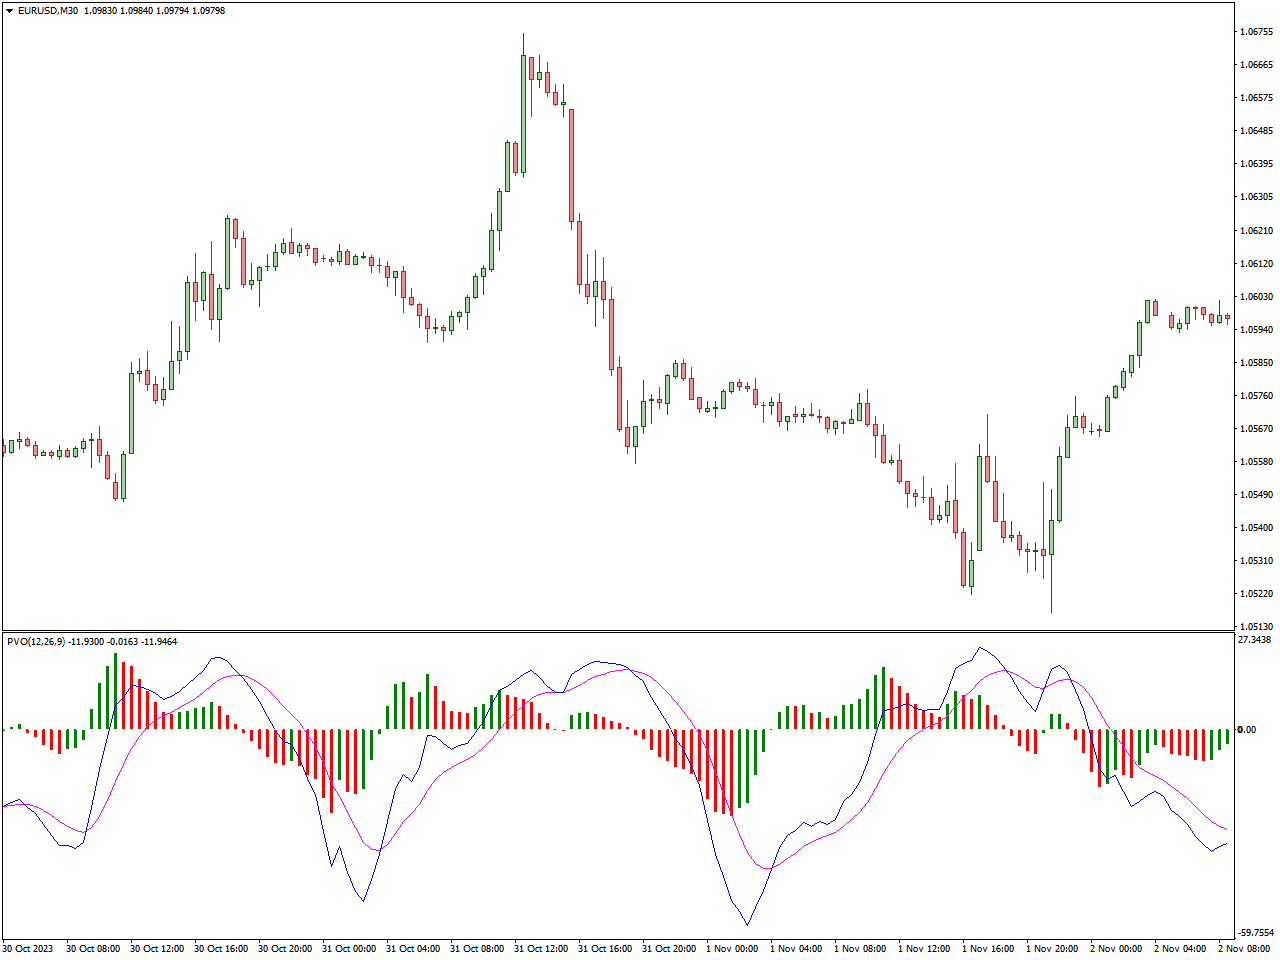
The Percentage Volume Oscillator indicator on MT4/MT5 bears a resemblance to the classic MACD indicator, incorporating moving averages and a histogram. What sets it apart is its reliance on volume data for calculation, making it an ideal choice for forex technical traders who consider volume an integral element in their strategies. Trading signals, both Bullish and Bearish, gain confirmation through the interplay of moving averages and the histogram bars featured in the indicator.
This indicator caters to both novice and advanced traders. Beginners can integrate volume-based signals with other technical indicators for added confirmation. For seasoned forex traders, recognizing the significance of volume in breakouts and reversals is crucial. Therefore, combining trend-focused technical indicators with the Percentage Volume Oscillator on MT4/MT5 yields optimal results.
A Bullish signal manifests when the BLUE moving average crosses above the MAGENTA moving average, substantiated by GREEN histogram bars positioned above the Zero line. This confluence signals a BUY position entry, with an advisable stop loss below the recent swing low. To secure profits, exiting at the opposite signal is prudent.
Conversely, a BEARISH trend is signaled by the downward crossover of the BLUE moving average to the MAGENTA moving average, corroborated by RED histogram bars below the Zero line. Placing a stop loss beneath the recent swing low is advisable, and profits can be taken at the occurrence of opposite trading signals. Ensuring a favorable risk-to-reward ratio is a sound practice when booking profits.
Wave Trend Oscillator Indicator
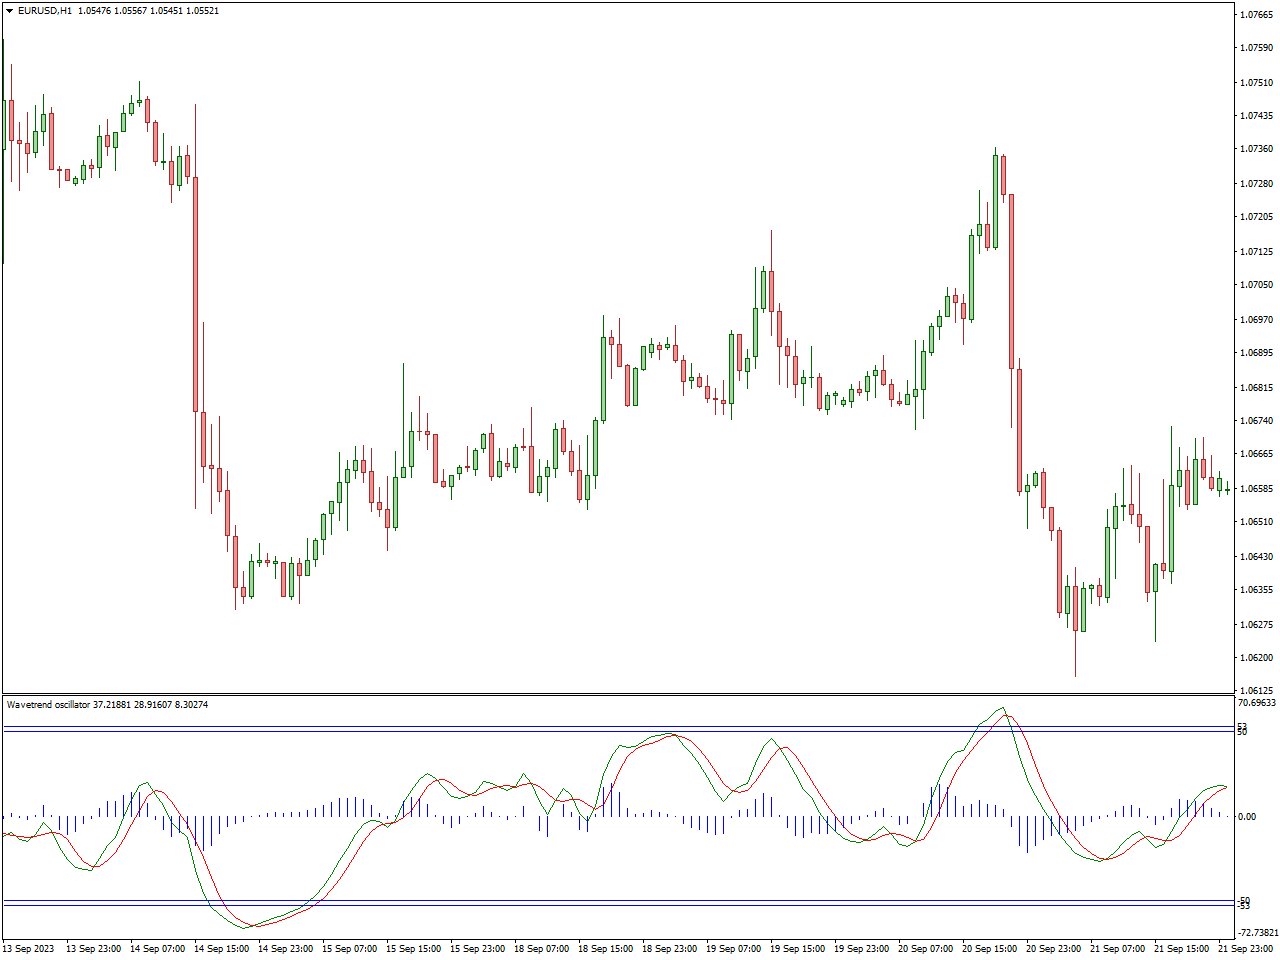
The Wave Trend Oscillator indicator is a technical tool designed for tracking market trends in forex trading. It oscillates as prices fluctuate across different levels of the chart.
This indicator closely monitors and traces the diminishing momentum of prices, serving as an early signal for potential trend reversals. The incorporation of a smoothing effect makes it highly responsive to price changes and the crossovers of the oscillator.
Equipped with exhaustion levels, known as overbought and oversold regions, the indicator provides valuable insights for anticipating potential reversals as prices approach these levels.
The versatility of the Wave Trend Oscillator makes it suitable for various trading styles, including scalping, day trading, and swing trading. Whether you’re a novice or an experienced trader, this indicator serves as a valuable tool by highlighting tradable points of interest in the market.
For a high-probability BUY setup, the oscillator should touch the oversold region, signaling a potential reversal. Opening a BUY/LONG position is recommended after the oscillator crosses the oversold level and price forms a bullish reversal candlestick pattern.
Spearman Correlation Indicator
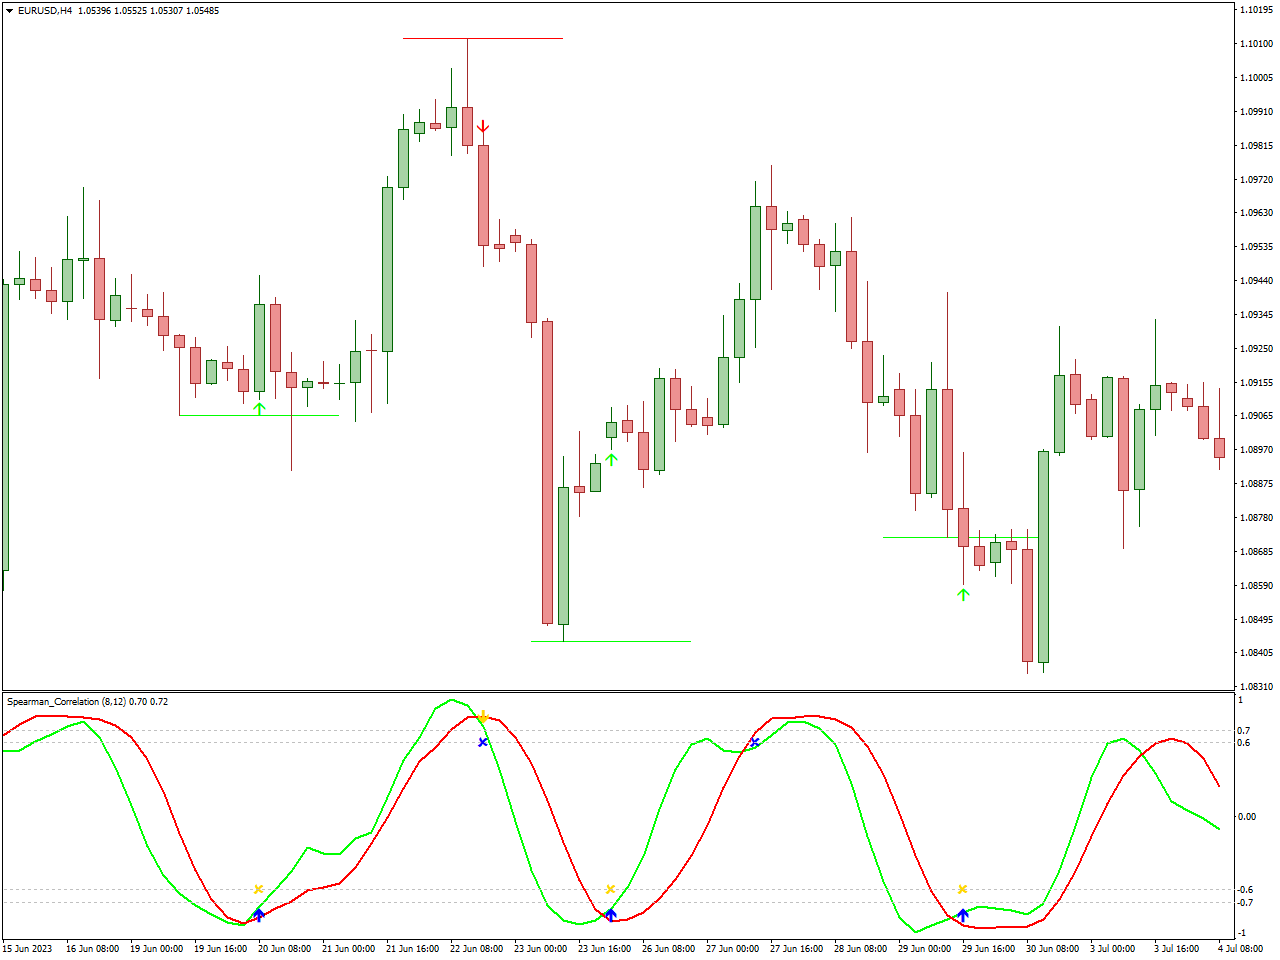
The Spearman Correlation Indicator is a statistical tool used in financial markets for technical analysis. Developed by Charles Spearman, it assesses the strength and direction of a monotonic relationship between two variables. Unlike traditional correlation measures, Spearman’s method is not reliant on linear relationships; instead, it focuses on the ranks of the data, making it effective for detecting non-linear correlations in financial instruments.
In practical terms, when applied to a price chart, the Spearman Correlation Indicator provides insights into whether the movements of two variables, such as different financial assets, are moving together or diverging. Traders use this information to understand the correlation’s strength, helping them make informed decisions about portfolio diversification and risk management. Overall, it serves as a valuable tool for technical analysts studying relationships between variables in financial markets.
Elliott Wave Oscillator Indicator
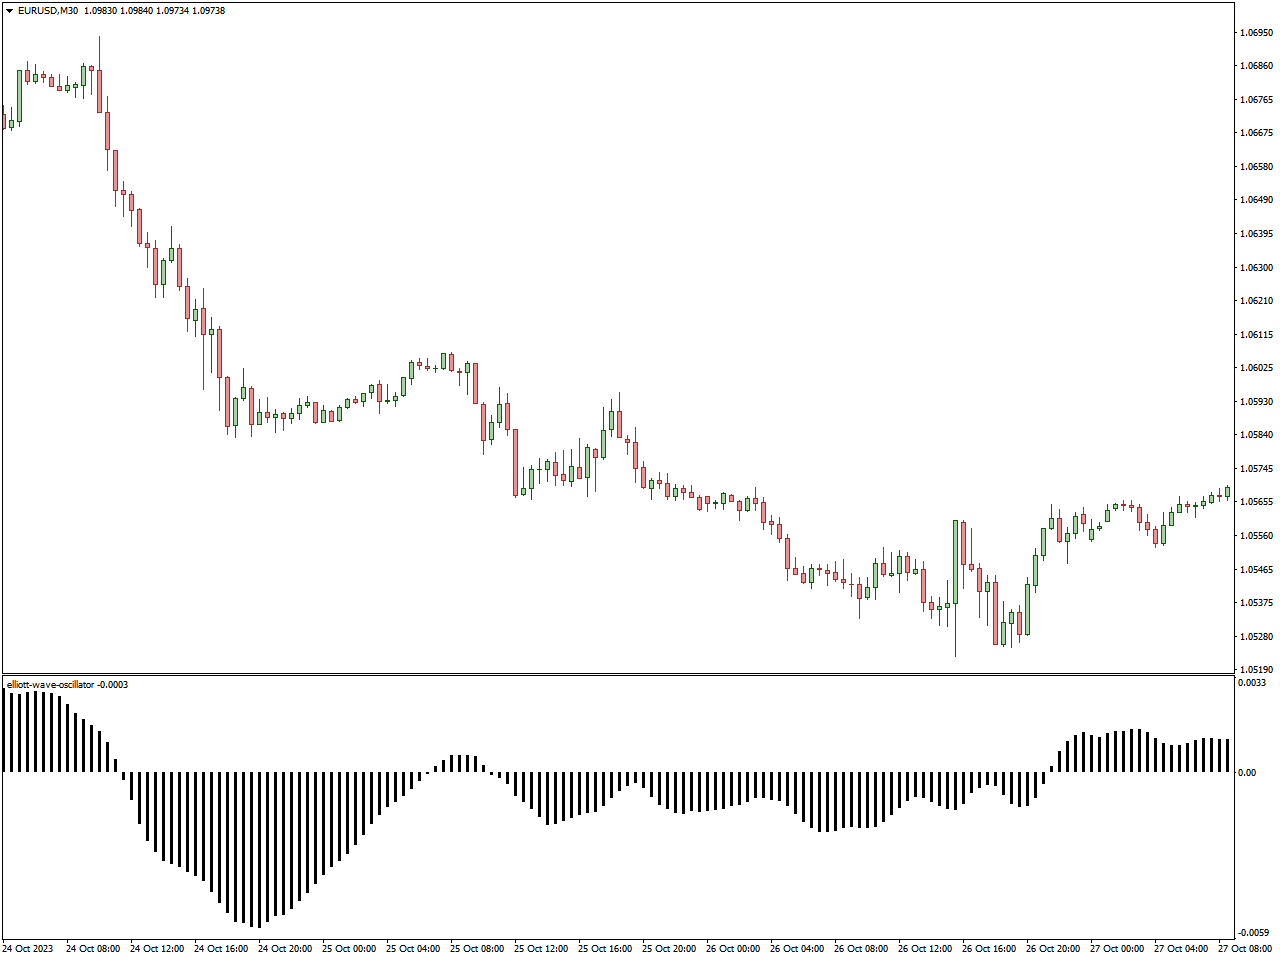
The Elliott Wave Oscillator Indicator stands as a widely employed tool in the arsenal of traders navigating financial markets, particularly within the realm of technical analysis. This indicator aligns itself with the Elliott Wave Theory, a methodology revered for its prowess in analyzing and predicting price patterns in financial markets.
Tailored to encapsulate the essence of Elliott Wave cycles and trends, the Elliott Wave Oscillator undergoes a calculation involving the disparity between a simple moving average (SMA) of closing prices and a 5-period SMA of these same closing prices. The resultant values are then graphically represented in the form of a histogram.
Upon application to a price chart, the Elliott Wave Oscillator generates visual signals manifested in the histogram bars. Traders routinely leverage these signals to discern potential shifts in market direction, gauge momentum fluctuations, and identify the inception or continuation of Elliott Wave patterns.
Through astute interpretation of the histogram’s peaks and troughs, traders glean insights into the vigor and duration of trends, facilitating the formulation of judicious trading decisions. The Elliott Wave Oscillator emerges as an invaluable asset for practitioners of Elliott Wave analysis, enriching their technical approach to navigating the intricacies of financial markets.
Heiken Ashi Oscillator Indicator
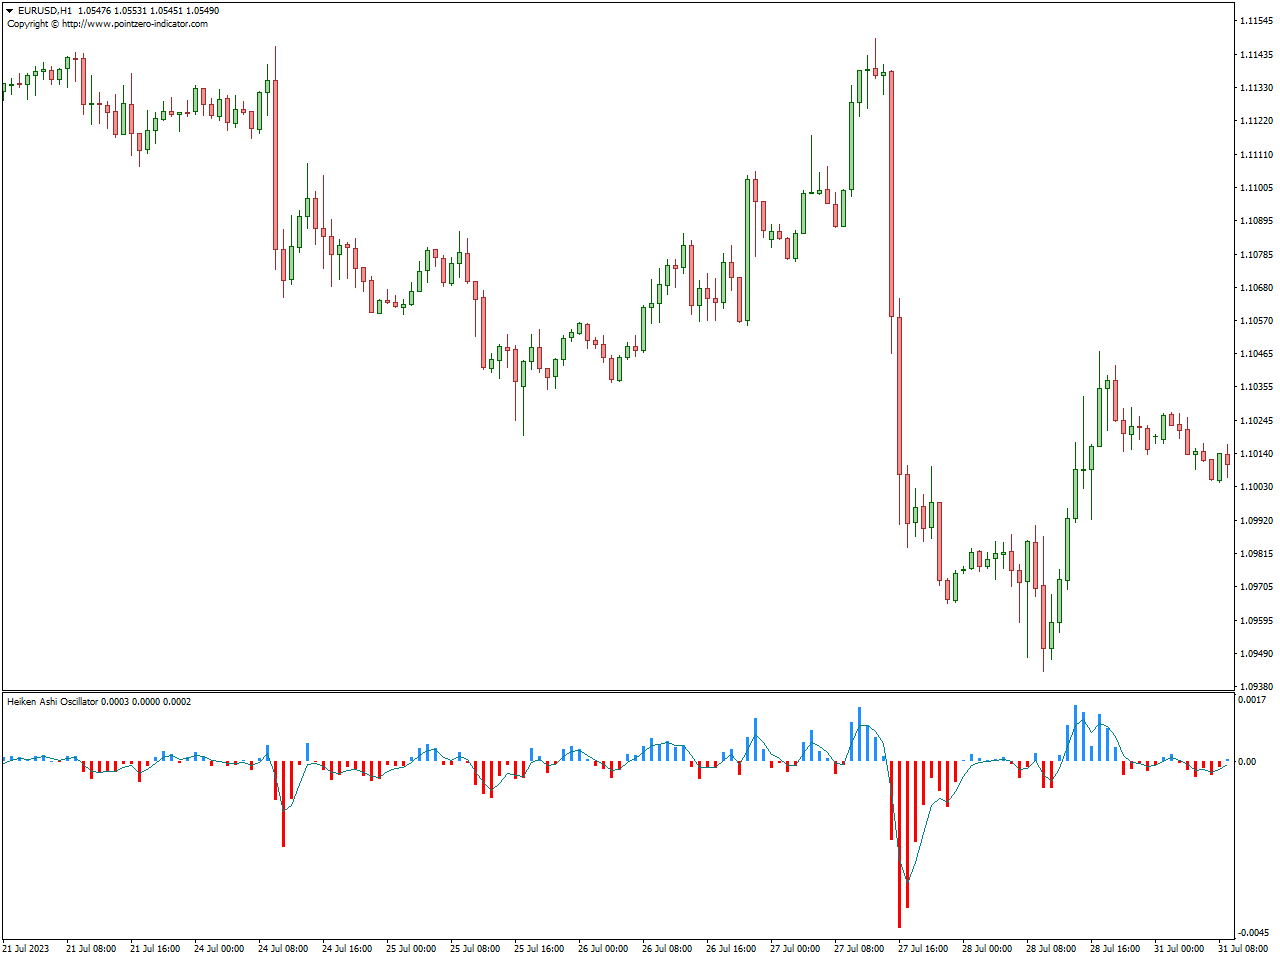
The Heiken Ashi Oscillator Indicator is derived from the default Heiken Ashi indicator, incorporating a moving average for additional smoothing. This enhanced feature allows forex traders to remain in bullish or bearish trends for extended periods.
Buy and sell signals are interpreted through various methods, offering flexibility for traders to act based on their discretion. The histogram visually represents the strengthening or weakening of the trend.
Heiken Ashi, known for its price-smoothing qualities, is a vital component in numerous automated trading expert advisors and various technical trading strategies in the forex market. The oscillator further refines values through the application of a moving average. Both novice and experienced forex traders can seamlessly integrate this indicator into their technical trading strategies.
FXSSI.Ratios
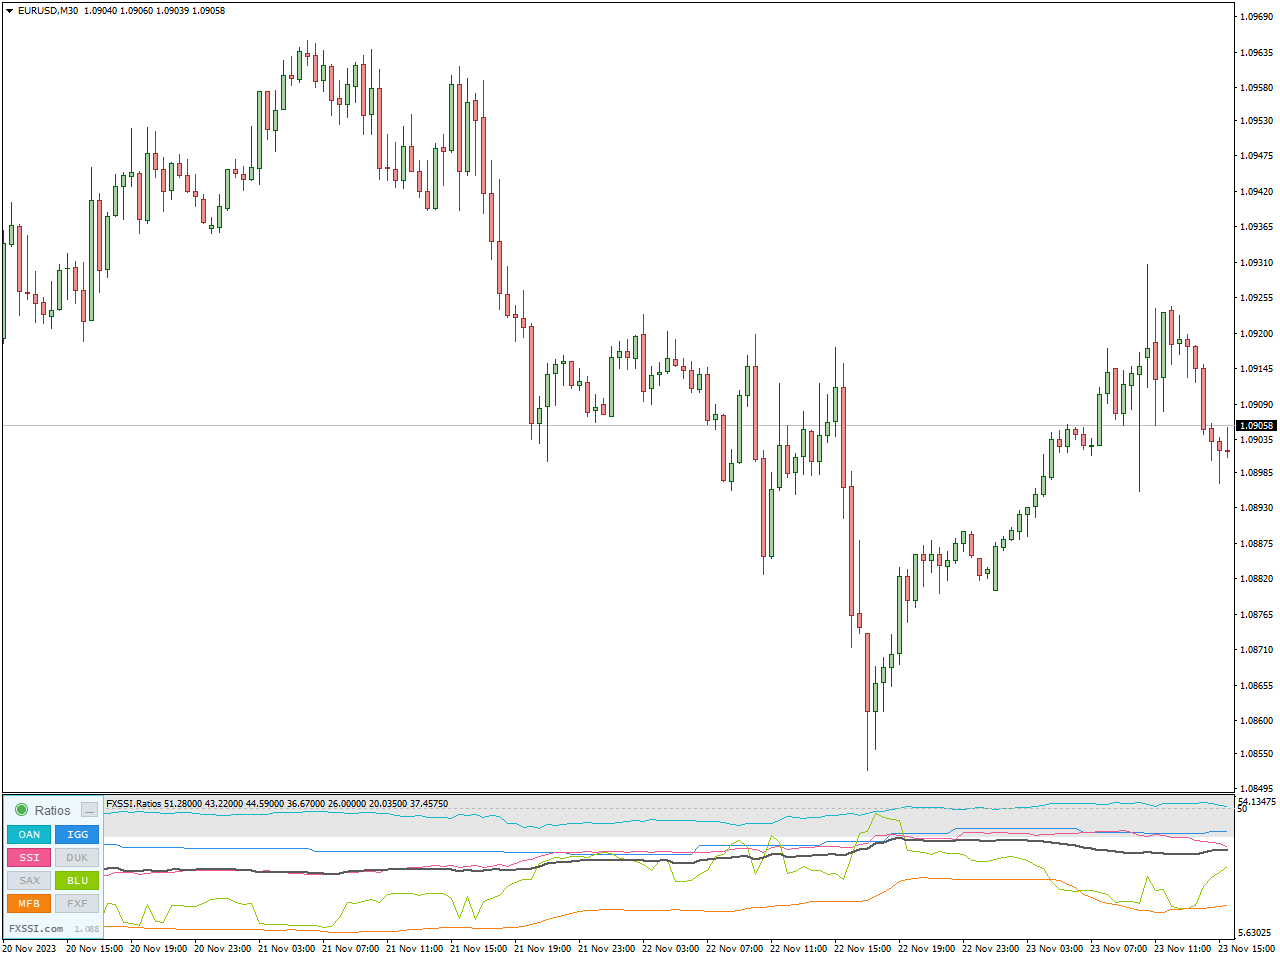
Monitor market sentiment dynamics using the Ratios indicator. Examining historical data on buyer and seller ratios enables a detailed analysis of key chart points, providing insights into potential future price movements.
This indicator serves various purposes, including:
- Confirming the direction for your upcoming trades.
- Identifying medium and long-term trends.
- Detecting manipulative price movements.
Additionally, the indicator proves beneficial for novice traders, offering an opportunity to better understand market mechanics. It facilitates the observation of manipulative price actions in the past, especially when analyzing extreme levels and corresponding candlestick readings. The greater the number of buyers entering the market to drive prices higher, the higher the likelihood of a price reversal occurring, and conversely.
Studying the historical open position ratios unveils patterns of behavior among traders in different market situations. Through these observations, traders can develop their own strategies and patterns for future trading endeavors.
AO Divergence Indicator
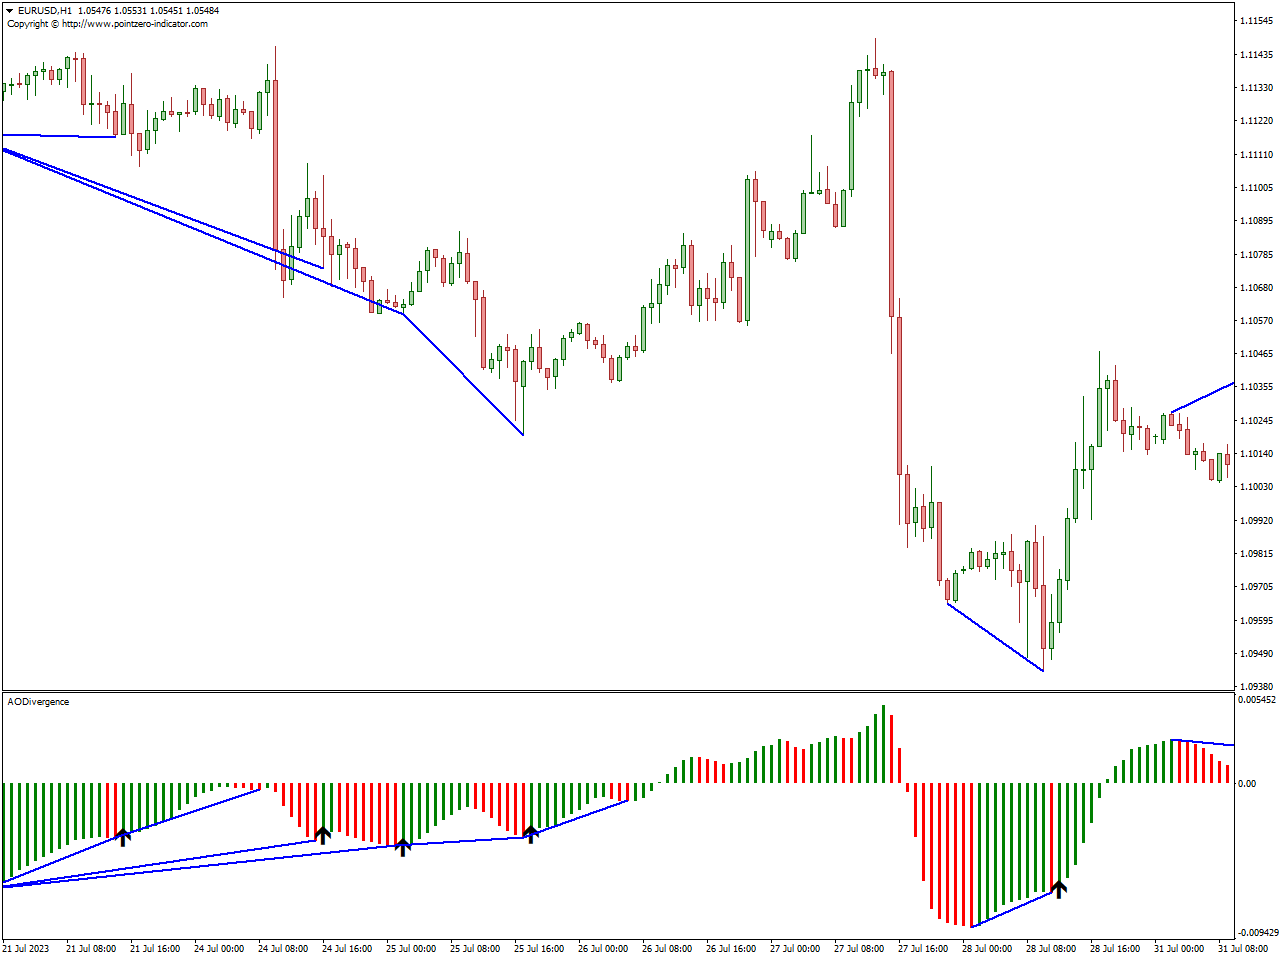
The AO Divergence Indicator is a tool employed in financial markets, specifically within the domain of technical analysis. Constructed based on the Awesome Oscillator (AO), this indicator zeroes in on recognizing divergence patterns between the AO and the price chart.
Divergence arises when there is a mismatch between the direction of price movements and the Awesome Oscillator. The AO Divergence Indicator aids traders in identifying potential reversals or shifts in momentum by pinpointing these divergent patterns.
Upon implementation on a price chart, the indicator produces signals grounded in the divergence observed between the Awesome Oscillator and price movements. Traders frequently leverage these signals to make well-informed choices regarding potential entry or exit points, enabling them to anticipate market reversals proactively.
StochRSI Indicator
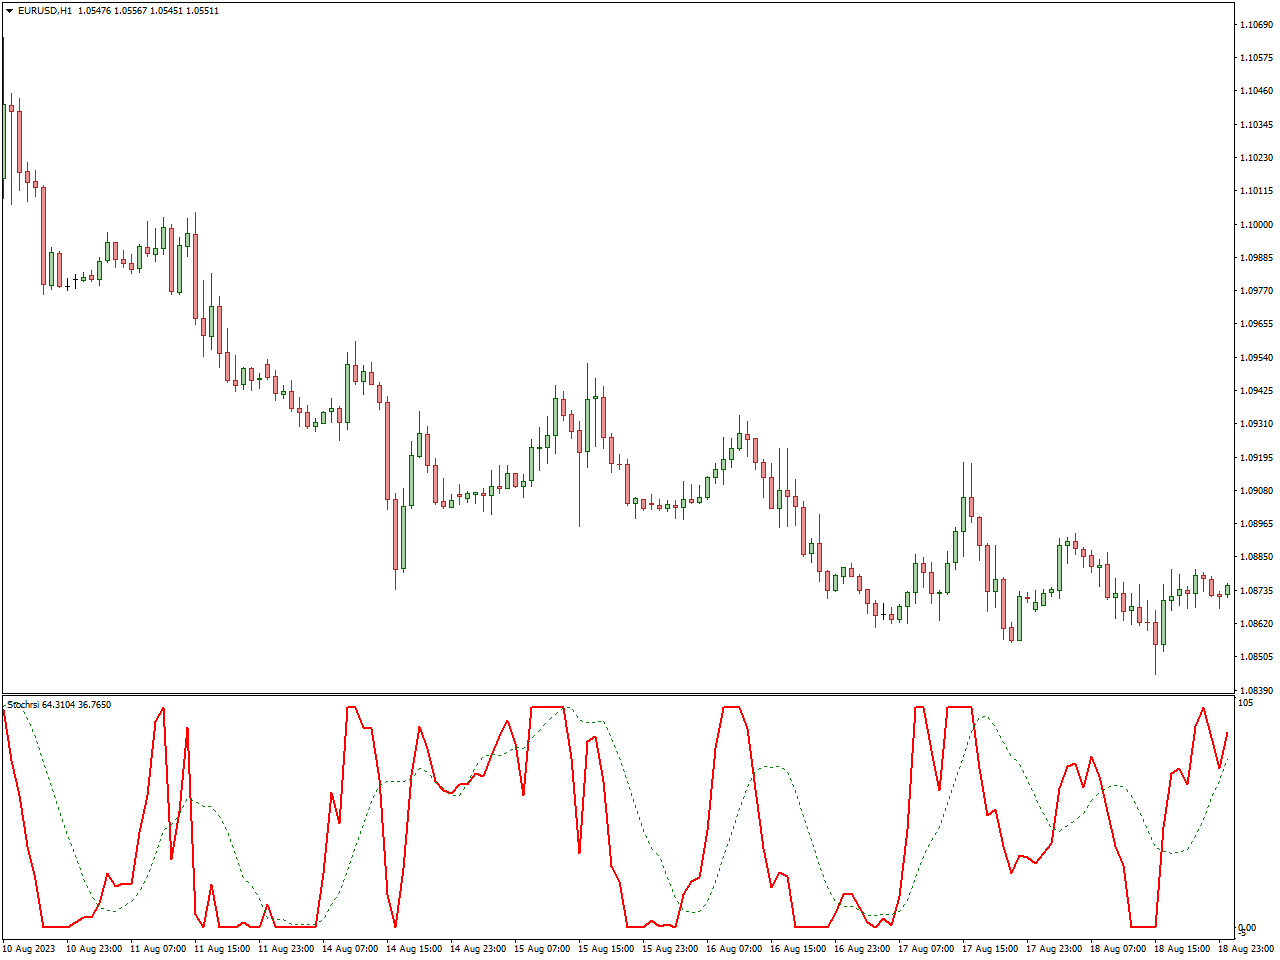
The StochRSI Indicator is a tool extensively employed in financial markets, particularly within the domain of technical analysis. This hybrid indicator merges attributes from two well-known indicators: the Stochastic Oscillator and the Relative Strength Index (RSI).
Tailored to deliver a more sensitive and responsive assessment of overbought and oversold conditions in the market, StochRSI amalgamates the momentum-measuring aspect of the Stochastic Oscillator with the trend-strength evaluation characteristic of RSI. The objective is to present traders with a comprehensive perspective on market conditions.
When applied to a price chart, the StochRSI Indicator produces values that fluctuate between 0 and 100, portraying the relative strength of the current closing price in comparison to its price range over a specific period. Traders commonly leverage StochRSI to pinpoint potential overbought or oversold conditions and identify prospective trend reversals.
In summary, the StochRSI Indicator stands as a versatile tool for traders, seamlessly blending the merits of the Stochastic Oscillator and RSI to offer nuanced insights into market momentum and potential reversal points.
Trend Arrow Indicator
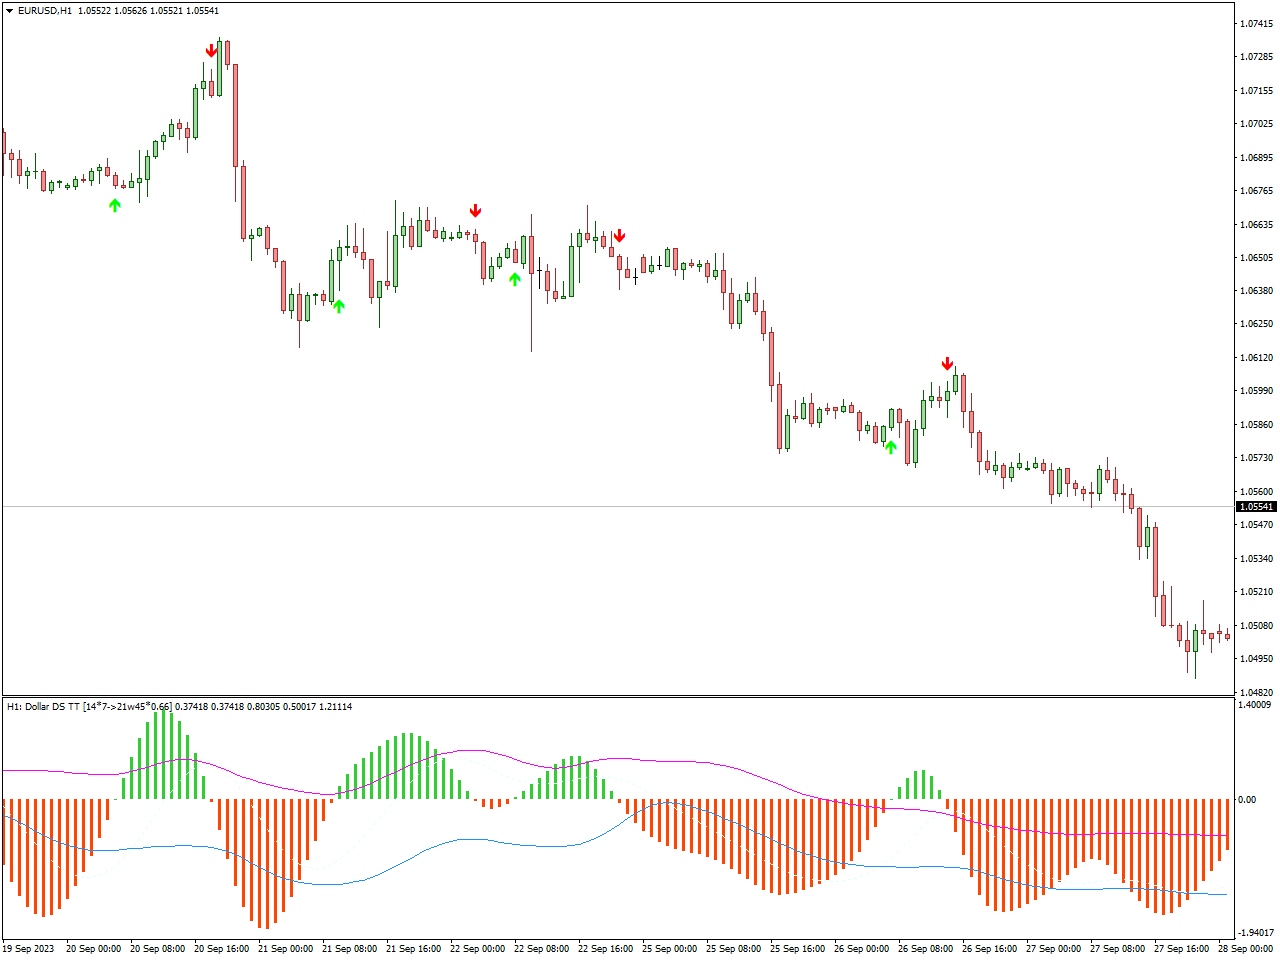
The Trend Arrow Indicator proves to be a valuable asset in financial markets, particularly in the domain of technical analysis. Tailored to visually depict the current trend direction on a price chart, this indicator stands out for its user-friendly approach.
In contrast to more intricate indicators, the Trend Arrow Indicator streamlines trend analysis by presenting arrows that clearly denote the ongoing trend’s direction. Upward-pointing arrows indicate a bullish trend, hinting at potential buy opportunities, while downward-pointing arrows signify a bearish trend, pointing towards potential sell opportunities.
Upon integration into a price chart, the Trend Arrow Indicator facilitates swift identification and tracking of the prevailing trend direction. Its straightforward design renders it suitable for traders across different experience levels, catering to both novices and seasoned professionals.
Commodity Channel Index (CCI) Indicator
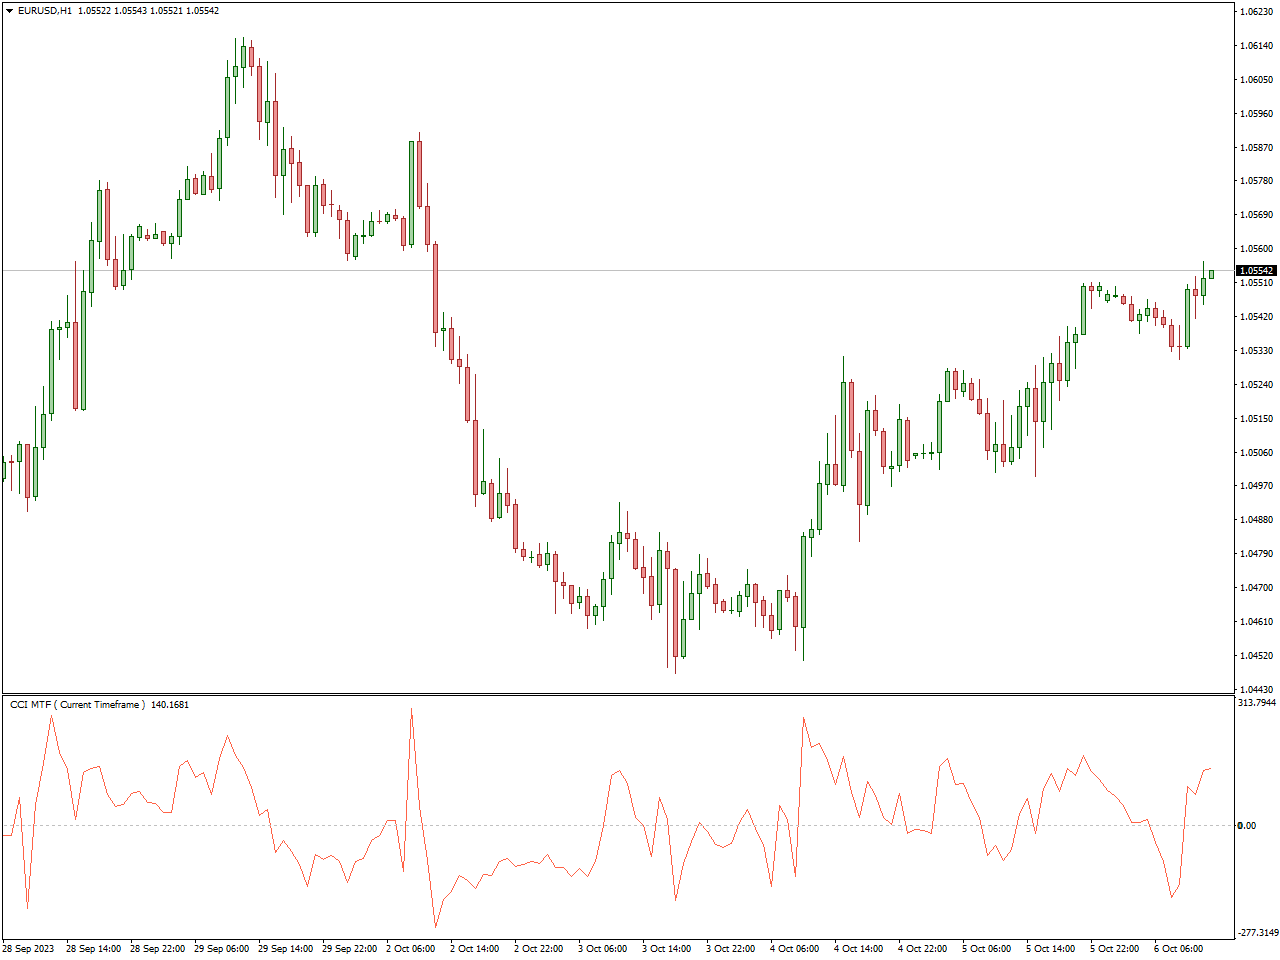
The Commodity Channel Index (CCI) Indicator holds a central position in financial markets, particularly within the realm of technical analysis. Engineered to assess the cyclical movements in commodity prices, the CCI Indicator serves as a tool for traders to pinpoint potential overbought or oversold conditions, as well as anticipate potential reversals in trends.
When applied to a price chart, the CCI Indicator produces values that oscillate around a baseline, with extreme levels serving as indicators of potential market conditions. Positive values indicate potential overbought conditions, hinting at a potential correction or reversal, while negative values suggest oversold conditions, signaling a potential upward correction.
Traders frequently leverage the CCI Indicator to identify opportune entry or exit points, evaluate the strength of an existing trend, and foresee potential reversals. Its adaptability and versatility in accommodating diverse market conditions make it an invaluable tool for traders of varying experience levels.
Synthetic VIX Indicator
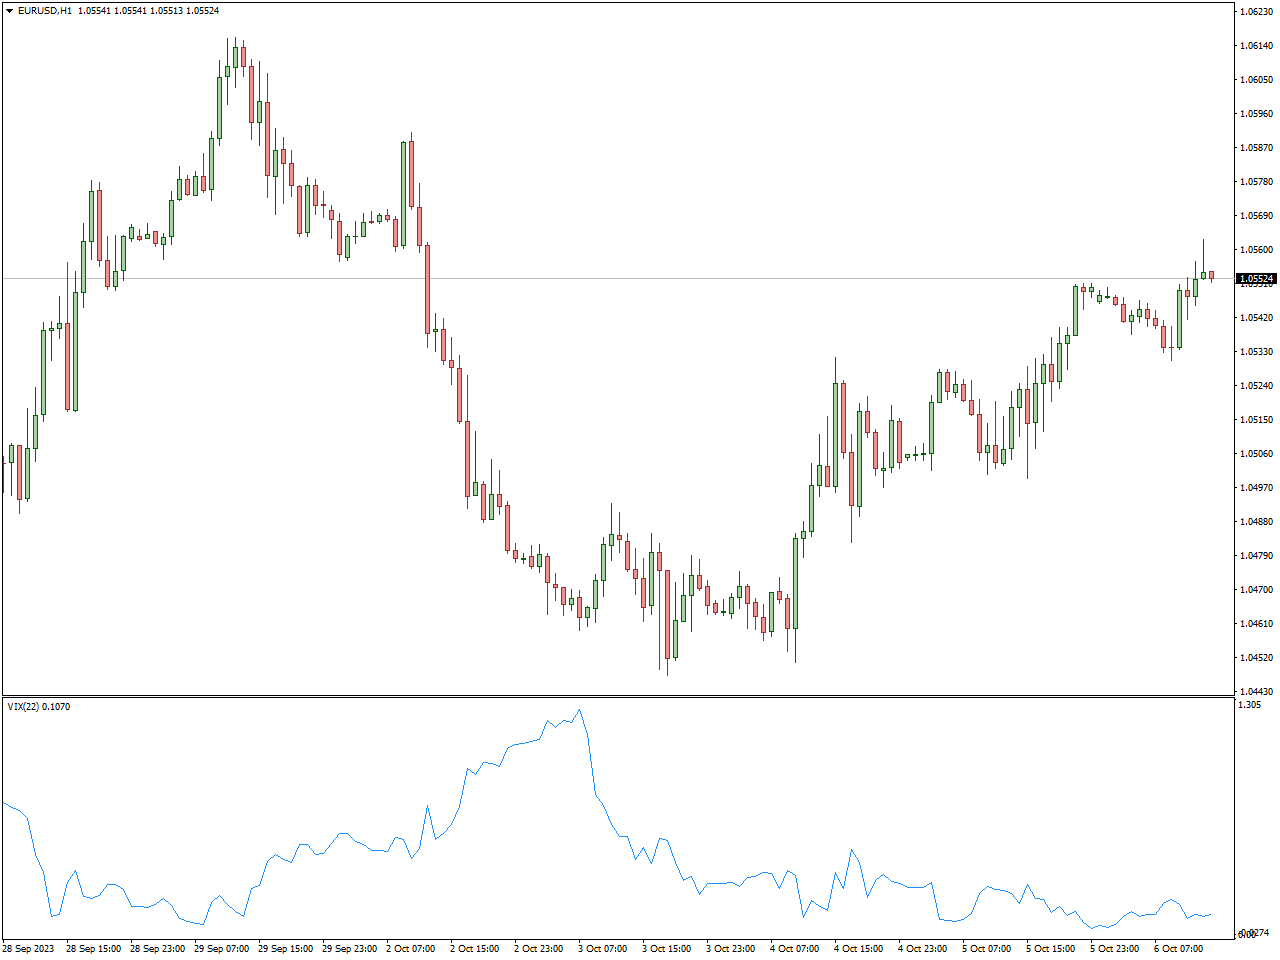
The Synthetic VIX Indicator holds significant importance in financial markets, particularly in the realm of technical analysis. This tool is designed to emulate the behavior of the VIX (Volatility Index), granting insights into market volatility and potential shifts in investor sentiment.
Diverging from the actual VIX, often dubbed the “fear gauge” for measuring market expectations regarding future volatility, the Synthetic VIX Indicator is tailored to replicate this behavior through the utilization of diverse market data and indicators. Serving as a proxy for assessing market sentiment and volatility, it provides traders with a valuable tool to evaluate potential risks and opportunities.
When implemented on a price chart, the Synthetic VIX Indicator generates values or signals that mirror fluctuations in market volatility. Traders commonly leverage these signals to make well-informed decisions concerning risk management, potential trend reversals, and the overall state of the market.
Smoothed RSI Indicator
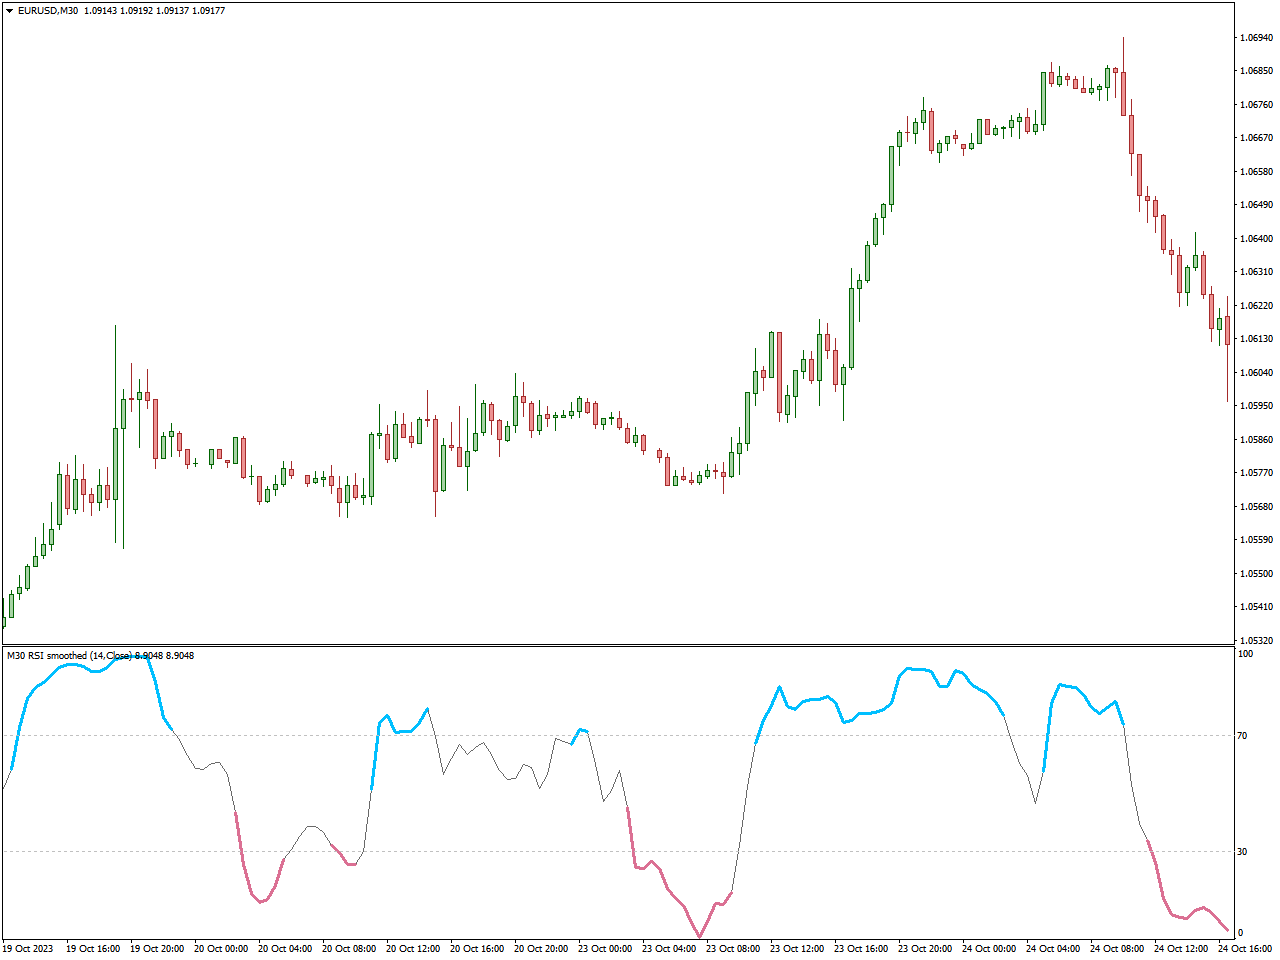
The Smoothed RSI Indicator stands out as a valuable instrument in financial markets, particularly within the realm of technical analysis. This indicator represents an enhanced version of the Relative Strength Index (RSI), meticulously crafted to offer a more nuanced portrayal of price trends.
In contrast to the conventional RSI, the Smoothed RSI integrates additional smoothing techniques, strategically employed to diminish market noise and present a clearer overview of prevailing trends. Through diverse mathematical calculations, the indicator endeavors to eliminate short-term fluctuations, accentuating the dominant trend direction.
Upon application to a price chart, the Smoothed RSI Indicator generates signals grounded in the relative strength of buying and selling pressures. Traders frequently leverage these signals to pinpoint potential overbought or oversold conditions, foresee trend reversals, and make judicious decisions regarding market entry or exit points. Whether you’re a novice or an adept trader, the Smoothed RSI Indicator proves invaluable for conducting precise technical analysis and refining trading strategies.
Money Flow Index Indicator (MFI)
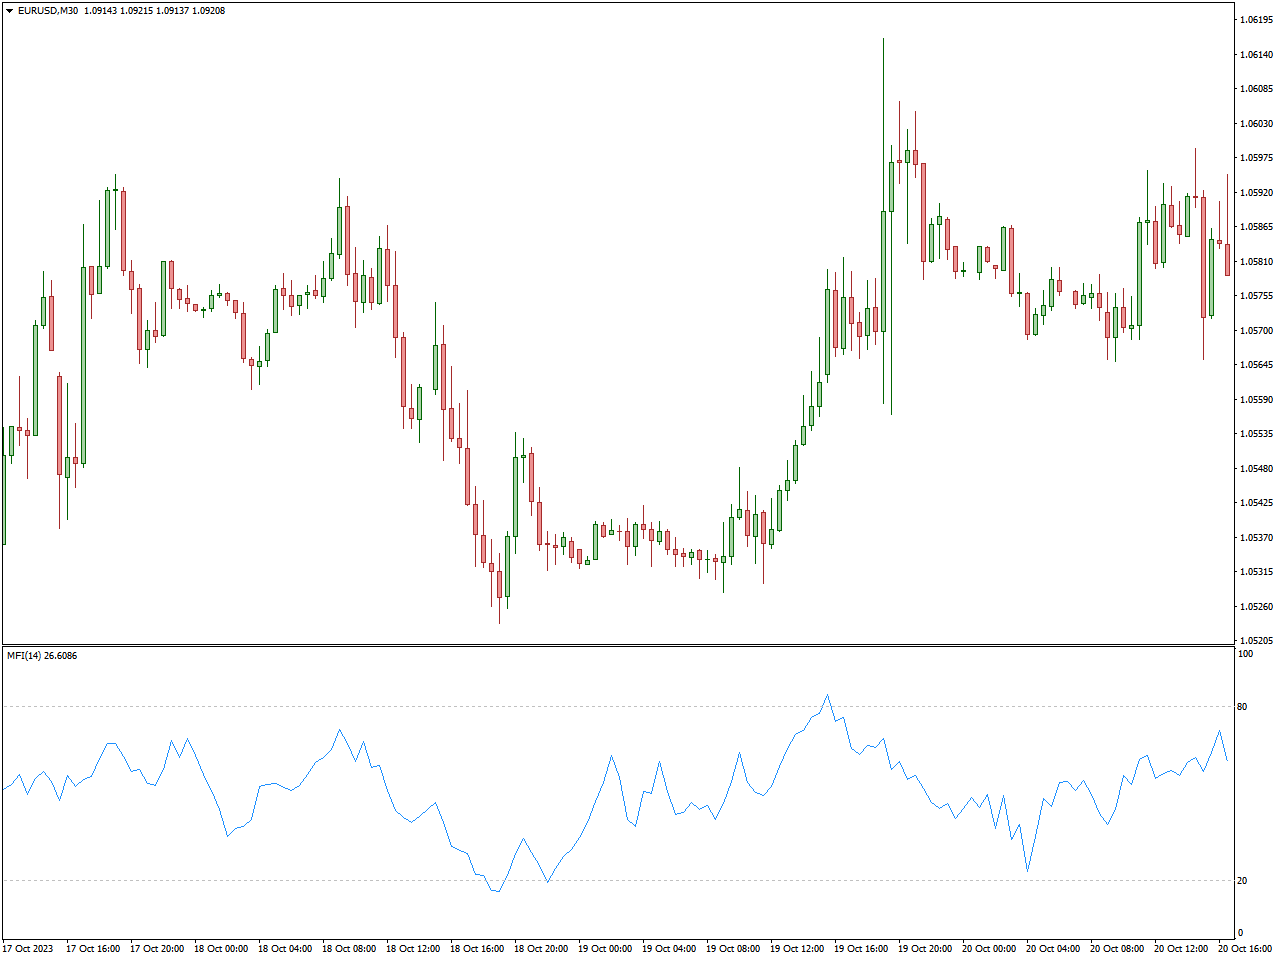
The Money Flow Index (MFI) Indicator holds significance in financial markets, especially within the realm of technical analysis. Its primary purpose is to evaluate the strength and direction of money flows in and out of a financial instrument, providing valuable insights into potential overbought or oversold conditions.
When applied to a price chart, the Money Flow Index computes a ratio of positive and negative money flows based on the instrument’s price and volume. This ratio is then normalized on a scale ranging from 0 to 100, where extreme values indicate potential shifts in market sentiment.
Traders commonly leverage the Money Flow Index Indicator to discern potential trend reversals, identify overbought or oversold conditions, and spot divergence between price and money flow. Its proficiency in assessing the strength of money flows renders it indispensable for traders aiming to make well-informed decisions regarding market entry, exit points, and overall market conditions. Whether you’re a novice or an experienced trader, the Money Flow Index Indicator enriches your technical analysis toolkit.
Awesome Oscillator Indicator
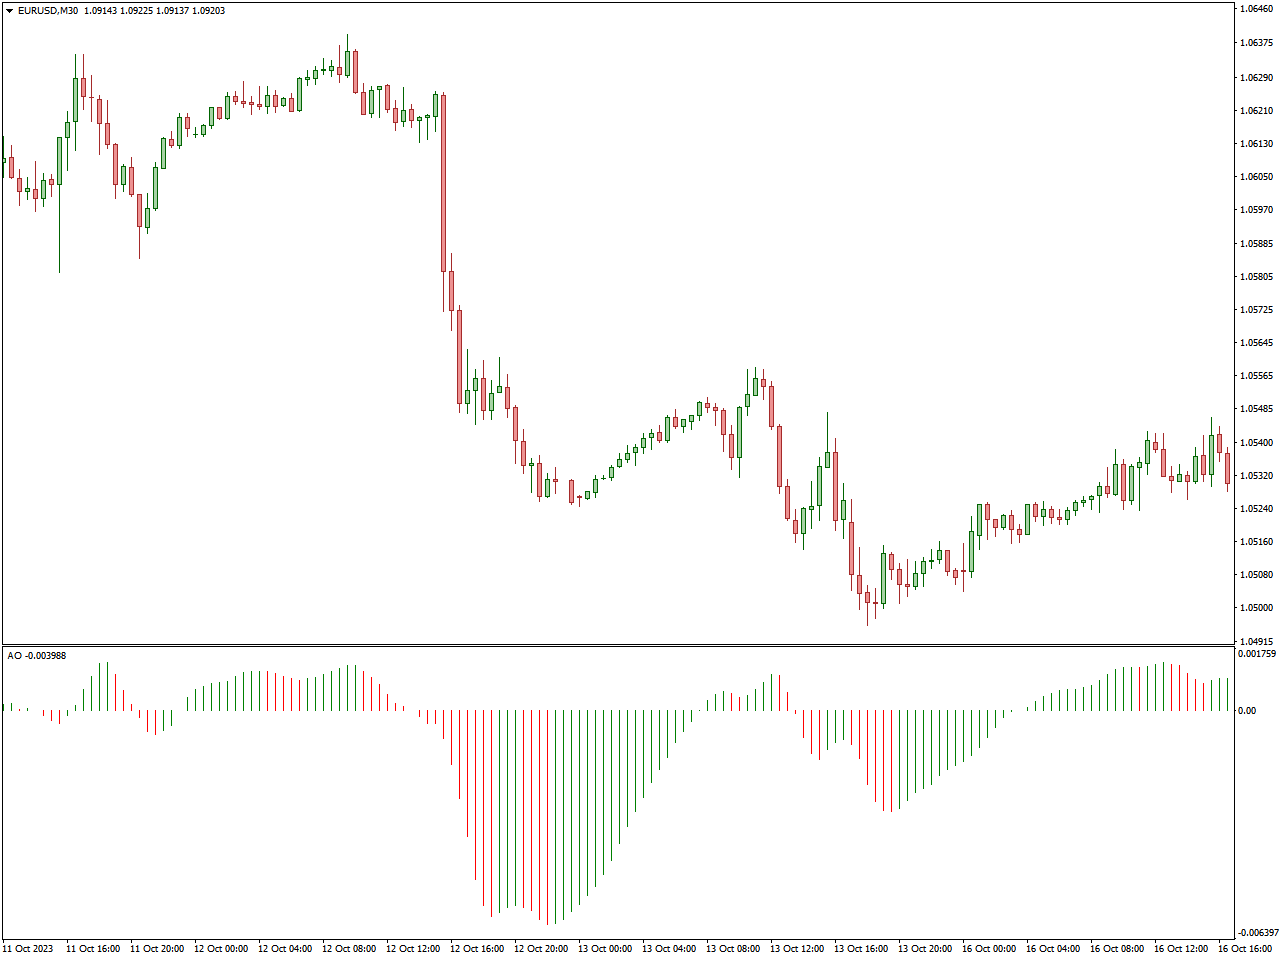
The Awesome Oscillator Indicator, developed by Bill Williams, is a crucial instrument in financial markets, especially within the field of technical analysis. It seeks to unveil the momentum of a financial instrument by examining the interplay between a 34-period and 5-period Simple Moving Average (SMA) of the median price.
When implemented on a price chart, the Awesome Oscillator manifests visual cues in the form of histogram bars. These bars encapsulate the disparity between the 5-period and 34-period SMAs. Traders frequently decipher alterations in the color of these histogram bars to discern potential shifts in market momentum.
Notably, the Awesome Oscillator excels in identifying the strength and frailty of an ongoing trend. Bullish momentum is indicated by green bars, denoting that the shorter-term SMA surpasses the longer-term SMA, whereas bearish momentum is illustrated by red bars, signaling the opposite scenario.
Conclusion
In the continually changing landscape of financial markets, achieving expertise in oscillator indicators becomes a pivotal element for trading success. Each of these tools, distinguished by its individual traits, equips traders to identify changes in momentum, assess market vigor, and anticipate possible reversals. Whether it’s the MACD offering insights into convergence and divergence or the RSI signaling overbought and oversold conditions, the top oscillator indicators form an extensive toolkit for traders. As you navigate the dynamic fluctuations of market trends, integrating these indicators into your strategy has the potential to enhance your technical analysis and contribute to the formulation of well-informed, strategic decisions.