

In the expansive realm of forex trading, the deliberate fusion of indicators emerges as a guiding light for traders in search of a competitive advantage. Navigating the complexities of currency markets demands a nuanced approach, and the harmonious integration of multiple indicators holds the potential to unlock lucrative opportunities. Within this in-depth guide, we delve into the intricacies of combining forex indicators, illuminating potent combinations that can elevate your trading strategy and offer a more lucid perspective on market dynamics.
TOP 7 Indicator Combinations
- Moving Average Convergence Divergence (MACD) and Relative Strength Index (RSI) Indicators
- Bollinger Bands and Stochastic Oscillator Indicators
- Order book(FXSSI) and Moving Averages
- Fibonacci Retracement and Support/Resistance Levels
- Parabolic SAR and Average True Range (ATR)
- Volume Profile and MACD
- Triple Exponential Moving Average (TEMA) and RSI
Moving Average Convergence Divergence (MACD) and Relative Strength Index (RSI) Indicators

The combination of the Moving Average Convergence Divergence (MACD) and Relative Strength Index (RSI) proves to be a robust strategy within the realm of technical analysis. MACD, functioning as a trend-following momentum indicator, and RSI, serving as a momentum oscillator gauging the speed and change of price movements, synergize to present a comprehensive overview of market dynamics.
MACD’s proficiency in discerning the strength and direction of a trend is complemented by RSI’s aptitude for assessing overbought or oversold conditions. The collaborative use of these indicators empowers traders with insights into potential trend reversals, shifts in momentum, and an overall assessment of market health.
The MACD and RSI combination facilitates the following for traders:
- Confirm Trend Strength: Aligning MACD trend signals with RSI readings validates the strength of an existing trend.
- Identify Potential Reversals: Detection of divergence or convergence between MACD and RSI signals potential trend reversals, providing early indications of shifts in market sentiment.
- Spot Overbought and Oversold Conditions: RSI’s overbought and oversold levels, when considered in tandem with MACD signals, assist in identifying optimal entry or exit points.
- Enhance Timing of Trades: The amalgamation of MACD and RSI allows traders to fine-tune the timing of trade entries and exits, enhancing overall precision.
In conclusion, the collaborative prowess of MACD and RSI equips traders with a holistic perspective, facilitating the interpretation of market trends and the identification of potential turning points.
Bollinger Bands and Stochastic Oscillator Indicators
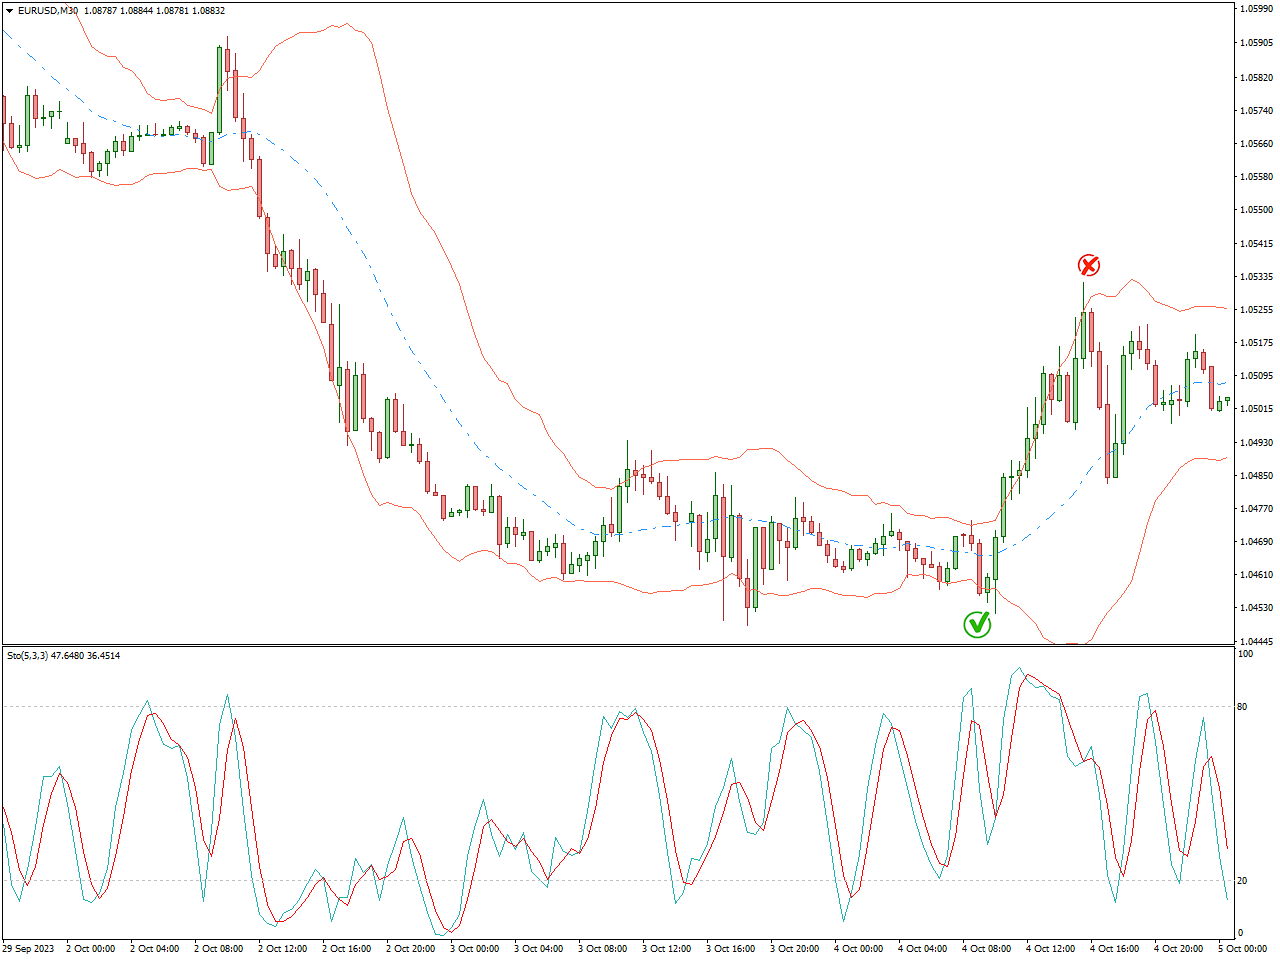
The amalgamation of Bollinger Bands and the Stochastic Oscillator proves to be an effective strategy in the field of technical analysis. Bollinger Bands, illustrating volatility and potential reversal points, and the Stochastic Oscillator, measuring the momentum of price movements, synergize to provide a nuanced understanding of market dynamics.
Here’s how the combination of Bollinger Bands and the Stochastic Oscillator benefits traders:
- Confluence of Volatility and Momentum: Bollinger Bands assist in identifying periods of high or low volatility, while the Stochastic Oscillator measures momentum. This combination enables traders to evaluate confluence points where volatility and momentum align.
- Confirmation of Overbought/Oversold Conditions: Bollinger Bands can validate overbought or oversold conditions identified by the Stochastic Oscillator. This confirmation adds strength to potential reversal signals.
- Indicators for Trend Reversals: The contraction or expansion of Bollinger Bands can indicate potential trend reversals, which can be supported by Stochastic Oscillator readings. This combination assists traders in pinpointing turning points in the market.
- Identification of Optimal Entry and Exit Points: By considering both volatility levels and momentum readings, the combination allows traders to determine optimal entry or exit points. This enhances precision in timing trades.
- Analysis of Divergence: Divergence between the Stochastic Oscillator and Bollinger Bands offers valuable insights into potential shifts in market direction. This aids traders in anticipating changes in the trend.
In summary, the strategic collaboration between Bollinger Bands and the Stochastic Oscillator empowers traders with a holistic approach, providing insights into volatility, momentum, and potential trend reversals.
Order book(FXSSI) and Moving Averages

The combination of the FXSSI Order Book and Moving Averages Indicator presents a comprehensive approach in the realm of technical analysis. The FXSSI Order Book provides insights into market sentiment and potential price reversals, while Moving Averages offer a smoothed representation of price trends. Together, they create a powerful synergy for traders seeking a deeper understanding of market dynamics.
Here’s how the combination of the FXSSI Order Book and Moving Averages Indicator benefits traders:
- Sentiment and Trend Alignment: The FXSSI Order Book reveals the sentiment of market participants, helping traders understand whether buyers or sellers dominate. When aligned with Moving Averages, which showcase trend direction, traders gain a clearer picture of how sentiment aligns with prevailing trends.
- Confirmation of Trend Strength: Moving Averages, by smoothing price data, offer a clear depiction of trend direction. When the Order Book sentiment aligns with Moving Average trends, it confirms the strength of the ongoing trend.
- Reversal Signals: Discrepancies between the FXSSI Order Book sentiment and Moving Averages can signal potential reversals. For instance, if the Order Book indicates a sentiment shift while Moving Averages show signs of trend exhaustion, it may suggest an upcoming reversal.
- Optimal Entry and Exit Points: By considering both the Order Book sentiment and Moving Averages, traders can identify optimal entry or exit points. This combination enhances precision in timing trades, especially when sentiment aligns with the prevailing trend.
- Risk Management: The combination aids in risk management by providing a more holistic view. Traders can use the Order Book to assess market sentiment, and Moving Averages to gauge trend strength, assisting in making informed decisions about position sizes and stop-loss levels.
In summary, the strategic collaboration between the FXSSI Order Book and Moving Averages Indicator empowers traders with a well-rounded approach, offering insights into sentiment, trend direction, and potential reversal signals. This combination proves valuable for traders seeking a comprehensive analysis of market conditions.
Fibonacci Retracement and Support/Resistance Levels
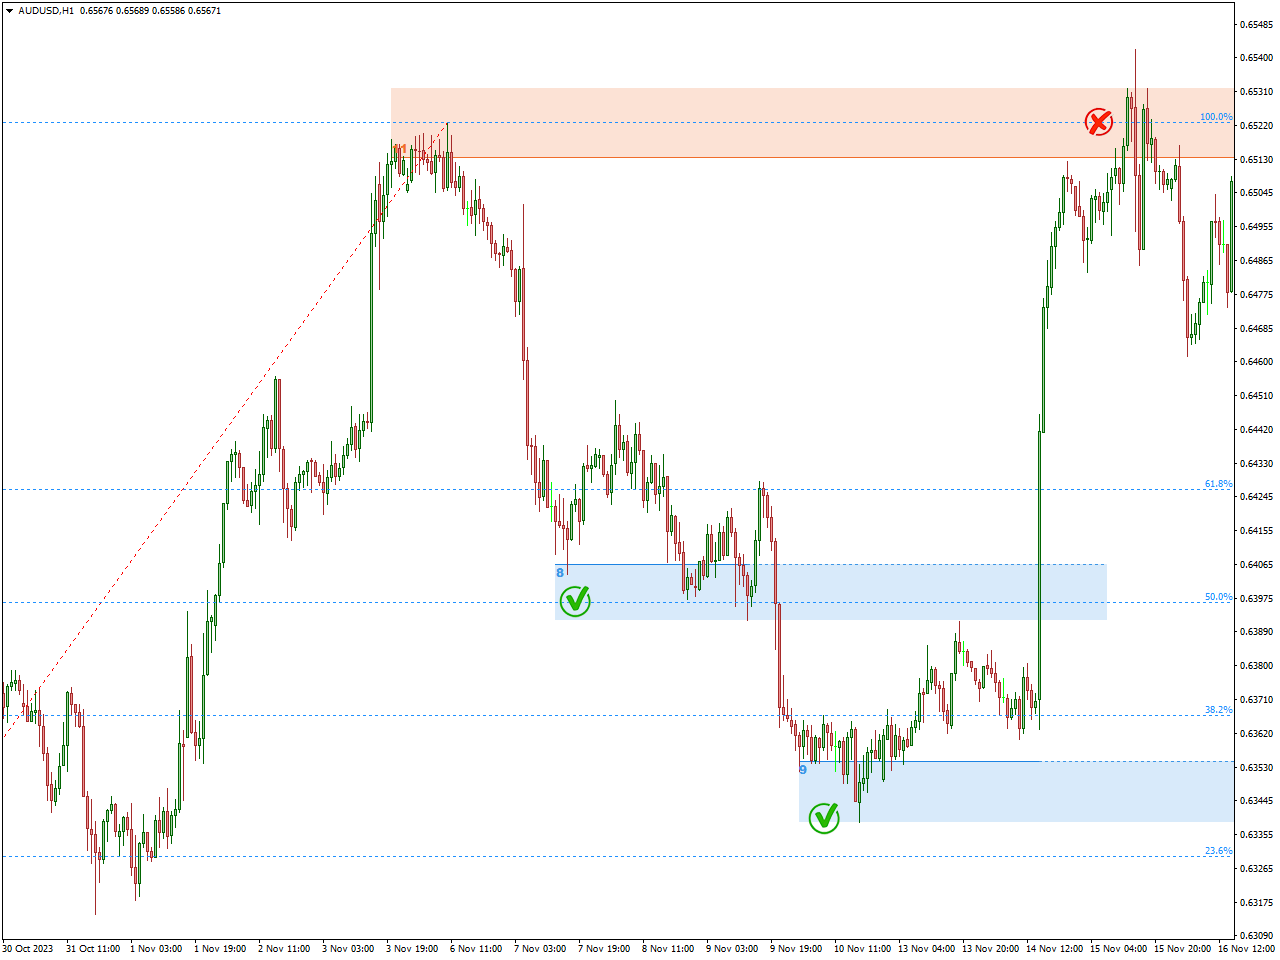
Merging Fibonacci retracement levels with Support and Resistance levels is a commonly employed technique in technical analysis. Both tools play a crucial role in pinpointing potential instances of price reversal or continuation within a financial market. Below is a guide on how to seamlessly incorporate Fibonacci retracement and support/resistance levels into your analytical approach:
Fibonacci Retracement :
Recognize the Trend:
- Initiate the process by identifying the prevailing trend in the market. Fibonacci retracement is frequently applied following a noteworthy price movement.
Chart Fibonacci Levels:
- After identifying a trend, sketch Fibonacci retracement levels from the low point to the high point in an uptrend or from the high point to the low point in a downtrend.
- Common retracement levels include 23.6%, 38.2%, 50%, 61.8%, and 78.6%.
Zones for Potential Reversal:
- View Fibonacci retracement levels as potential reversal zones. Traders often observe price reactions at these designated levels.
Support/Resistance Levels:
Identify Significant Levels:
- Discern historical support and resistance levels on the price chart. These are areas where price has historically experienced reversals.
Mark with Horizontal Lines:
- Utilize horizontal lines to demarcate these support and resistance levels on the chart. These levels may be derived from prior swing highs and lows or other significant price points.
Integration with Fibonacci Levels:
- Seek confluence between Fibonacci retracement levels and existing support/resistance levels. The convergence of both tools on a particular level enhances its significance.
Confirmation Signals:
- Avoid relying solely on indicators. Wait for additional confirmation signals such as candlestick patterns, trendline breaks, or other tools within technical analysis.
Tips for Effective Utilization:
Utilize Multiple Timeframes:
- Assess various timeframes to affirm the strength of support/resistance and Fibonacci levels.
Focus on Price Action:
- Observe price action at these levels. Look for bullish or bearish candlestick patterns to validate potential reversals.
Implement Robust Risk Management:
- Enforce sound risk management strategies. Place stop-loss orders to mitigate potential losses if the price does not conform to expectations.
Employ Confluence:
- Combine Fibonacci retracement and support/resistance levels with other technical indicators to bolster the overall robustness of your analysis.
It is crucial to bear in mind that no individual indicator or tool guarantees accuracy, and a comprehensive analysis should involve a mix of tools while considering broader market dynamics such as sentiment, economic indicators, and news events. Always practice prudent risk management and stay attuned to the broader market context.
Parabolic SAR and Average True Range (ATR)
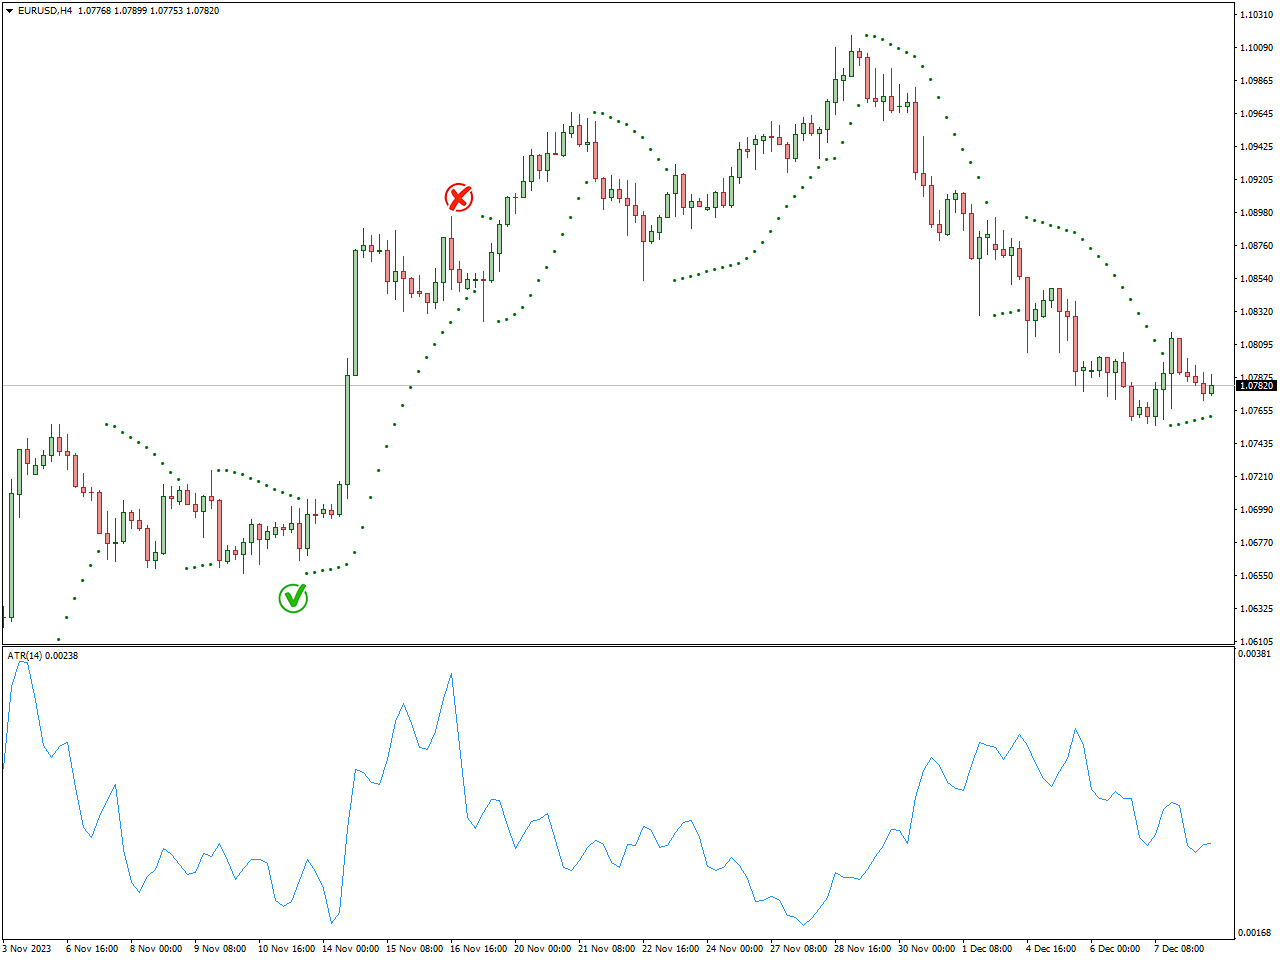
Combining the Parabolic SAR and Average True Range (ATR) indicators offers traders a comprehensive method for evaluating potential trends, volatility, and entry/exit points in financial markets. Here’s a guide on integrating these indicators:
Combination Strategy:
Confirming Trends:
- Utilize the Parabolic SAR to validate the trend direction. Presence of SAR dots below the price suggests an uptrend, while dots above indicate a downtrend.
Volatility Confirmation:
- Confirm the market’s volatility by employing ATR. Higher ATR values indicate broader price swings, whereas lower ATR values suggest more tranquil market conditions.
Entry and Exit Points:
- Merge Parabolic SAR and ATR to ascertain optimal entry and exit points. For instance, consider entering a trade when SAR signals a trend and ATR signifies sufficient volatility.
Adjusting Stop-Loss:
- Employ ATR to dynamically fine-tune stop-loss levels. In periods of heightened volatility, set wider stops to accommodate larger price fluctuations.
Avoiding Choppy Markets:
- Exercise caution when entering trades during low volatility periods (low ATR), as price movements may become more unpredictable.
Trend Reversal Confirmation:
- If Parabolic SAR suggests a potential trend reversal, cross-verify with ATR to confirm whether the reversal is associated with increased volatility.
Risk Management:
- Integrate both indicators into your risk management strategy. Ensure that the risk per trade aligns with prevailing market conditions and volatility.
Backtesting:
- Validate the efficacy of this combined approach through backtesting on historical data to gauge its performance across diverse market scenarios.
Keep in mind that no single strategy or amalgamation of indicators assures success in trading. It’s imperative to adapt and refine your strategy based on evolving market conditions, employ sound risk management practices, and consider combining these indicators with other tools or strategies for a more comprehensive analysis.
Volume Profile and MACD
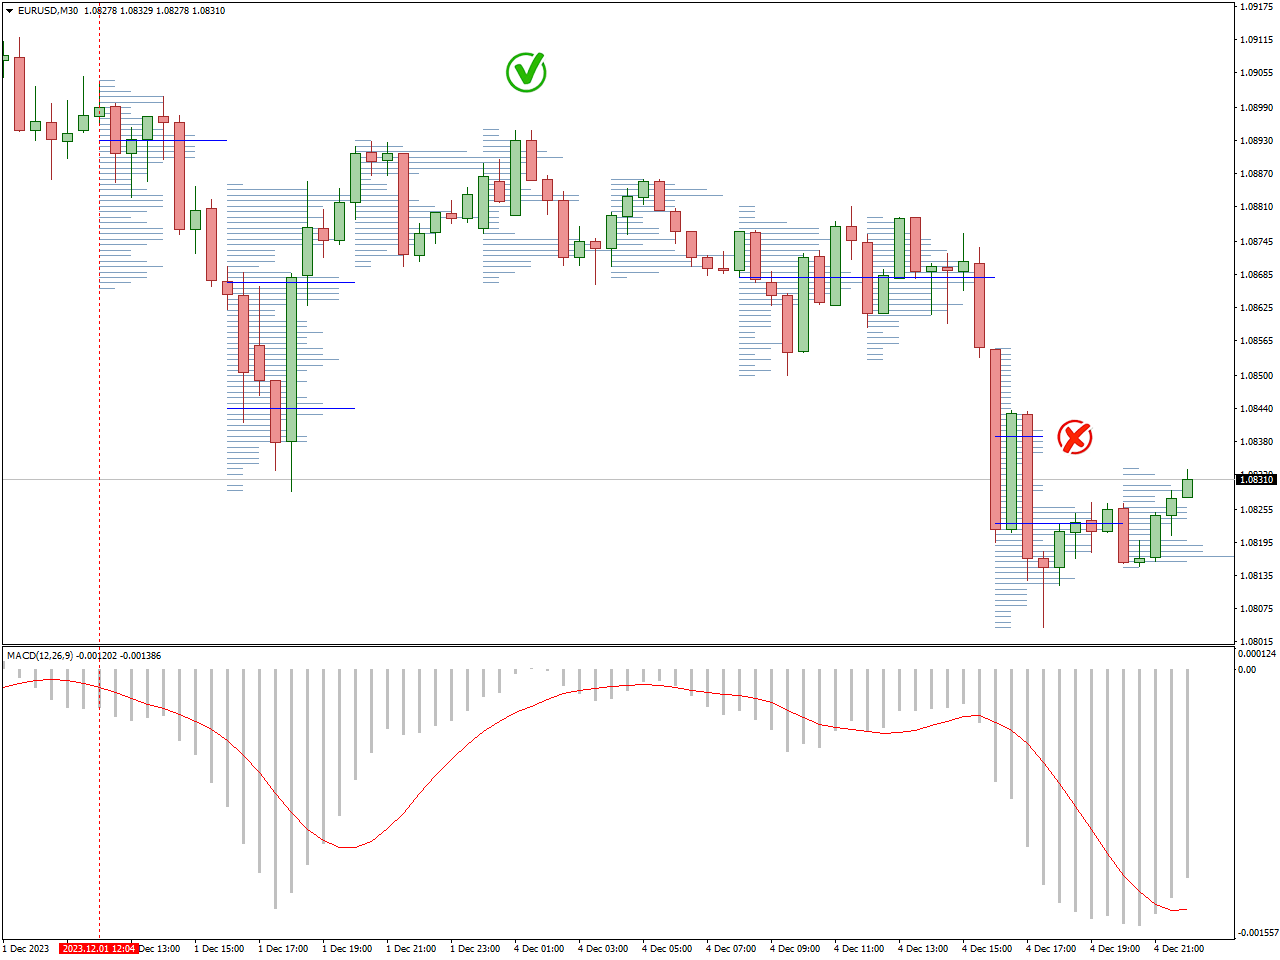
Combining the Volume Profile with the Moving Average Convergence Divergence (MACD) indicator offers traders valuable insights into significant price levels that attract substantial trading activity and potential shifts in trends. Here’s a guide on integrating these two indicators:
Volume Profile:
Identify Noteworthy Price Levels:
- The Volume Profile visually represents the volume traded at various price levels. Pinpoint peaks and valleys in the profile to identify significant price levels where substantial trading activity has occurred.
Determine the Value Area:
- The value area signifies the range where the majority of trading volume occurred. Concentrate on this area as it may function as support or resistance.
MACD Indicator:
Identify Trends:
- MACD aids in recognizing trends and potential changes in trends. A positive MACD indicates a bullish trend, whereas a negative MACD suggests a bearish trend.
Analyze Signal Line Crossovers:
- Monitor crossovers between the MACD line and the signal line. A bullish crossover (MACD crossing above the signal line) may imply a potential upward trend, while a bearish crossover (MACD crossing below the signal line) may indicate a potential downward trend.
Evaluate Histogram Changes:
- Scrutinize the MACD histogram to assess the strength of the prevailing trend. Increasing histogram bars indicate growing momentum, while decreasing bars may suggest a potential weakening trend.
Integration Strategy:
Confirm Trends:
- Utilize MACD to validate the existing trend. If MACD indicates a bullish trend, identify potential entry points near high-volume nodes in the Volume Profile. Conversely, in a bearish trend, look for areas of significant trading activity as potential resistance levels.
Volume Confirmation:
- Verify trend signals from MACD by cross-referencing with volume data from the Volume Profile. Robust trends supported by substantial trading volumes are generally more reliable.
Divergence Analysis:
- Look for divergences between price movements and MACD signals. Confirm such divergences with Volume Profile analysis to assess if they align with significant trading activity at potential reversal points.
Key Levels for Entry/Exit:
- Utilize the Volume Profile to identify crucial levels for entry and exit points. When a stock hovers near a high-volume node and MACD indicates a trend change, it could signal a strong potential reversal.
Always bear in mind that while these indicators provide valuable insights, no strategy ensures success in trading. It’s crucial to adapt your strategy based on evolving market conditions, implement sound risk management practices, and consider combining these indicators with other tools or strategies for a more comprehensive analysis.
Triple Exponential Moving Average (TEMA) and RSI
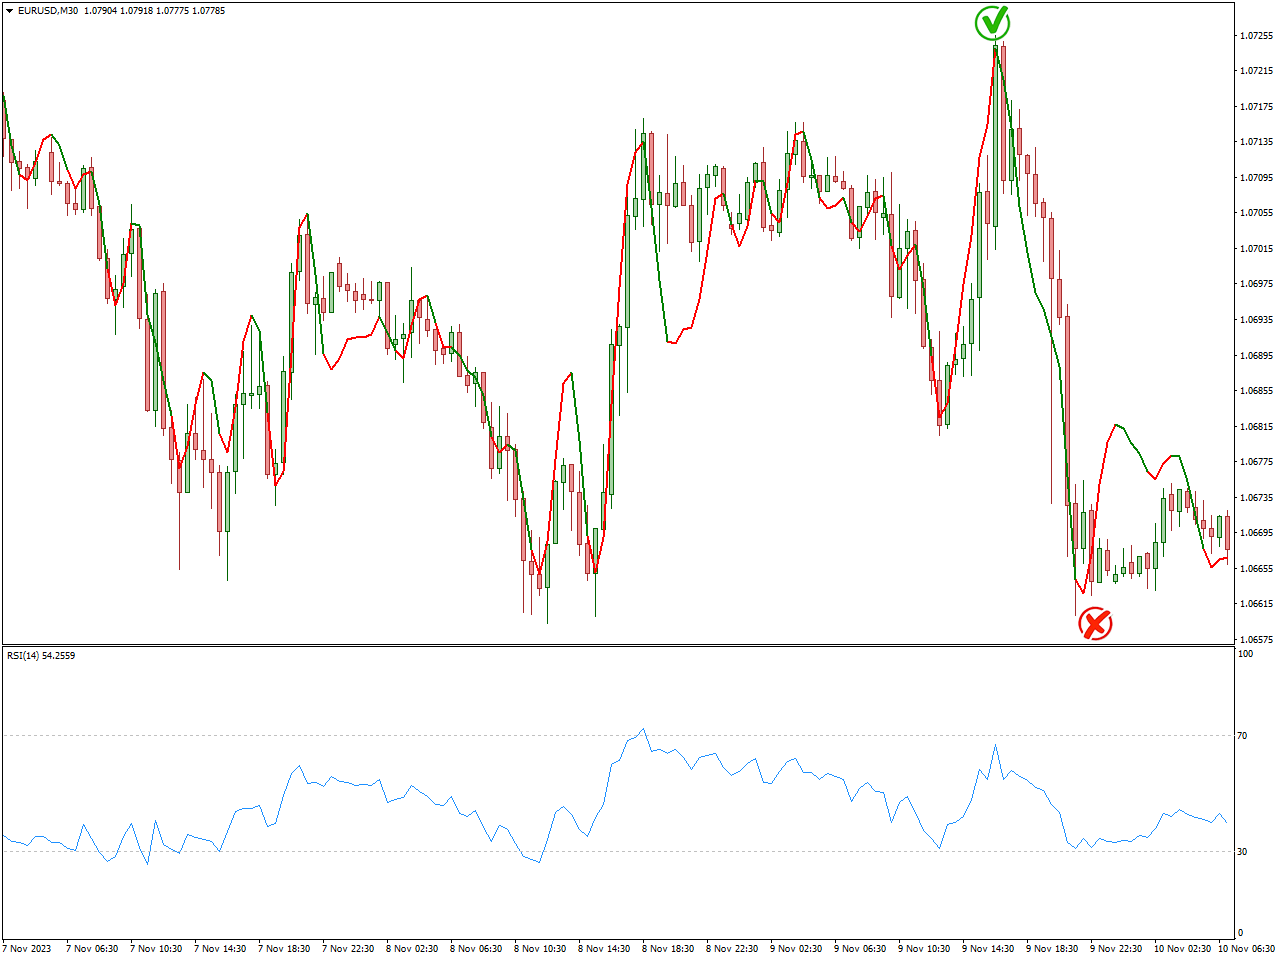
Combining the Triple Exponential Moving Average (TEMA) with the Relative Strength Index (RSI) indicator provides traders with a holistic approach to analyzing trends and pinpointing potential reversal points. Here’s how you can integrate these two indicators:
Triple Exponential Moving Average (TEMA):
Smoothed Trend Identification:
TEMA is renowned for offering a more polished depiction of trends in contrast to traditional moving averages. Identify the prevailing trend’s direction using TEMA.
Confirmation of Trend Strength:
The slope and the distance between TEMA lines serve as indicators of trend strength. A widening separation signifies a robust trend, while a narrowing gap may indicate a weakening trend.
Relative Strength Index (RSI):
Overbought and Oversold Conditions:
RSI aids in recognizing overbought and oversold conditions. Readings above 70 suggest overbought conditions, potentially indicating a reversal, while readings below 30 indicate oversold conditions, suggesting a possible rebound.
Confirmation of Trend Momentum:
RSI serves to confirm the momentum supporting a trend. Rising RSI values during an uptrend and falling values during a downtrend suggest strong momentum in the respective direction.
Combination Strategy:
Trend Confirmation:
Utilize TEMA to validate the existing trend. If TEMA indicates an uptrend, explore potential buy signals; if it signals a downtrend, focus on potential sell signals.
RSI Confirmation:
Verify the strength of the trend using RSI. In an uptrend confirmed by TEMA, ensure that RSI is not in overbought territory; for a downtrend, confirm that RSI is not oversold.
Divergence Analysis:
Search for divergences between TEMA and RSI, as they may indicate potential trend reversals. For instance, if TEMA is forming higher highs but RSI is forming lower highs, it could suggest weakening bullish momentum.
Entry and Exit Points:
Leverage both indicators to identify optimal entry and exit points. For example, consider entering a long position when TEMA indicates an uptrend, RSI is not overbought, and there is no bearish divergence.
Conclusion
As we wrap up our exploration of forex indicator combinations, it becomes clear that trading success often hinges on the harmonious interplay of multiple tools. Formulating a strategy that effortlessly blends complementary indicators can furnish a more holistic grasp of market trends, optimal entry and exit points, and potential reversals. It’s crucial to note that there’s no universal solution, and the most effective combinations may differ based on your unique trading style and goals. Keep refining your approach, experiment with various combinations, and stay vigilant in adapting to the dynamic shifts within the forex market landscape.