

In the dynamic arena of financial markets, the skill to predict trend reversals distinguishes successful traders. Divergence indicators prove to be indispensable instruments in this endeavor, providing a nuanced comprehension of price shifts and market dynamics. This article explores the realm of trading precision, revealing the foremost divergence indicators capable of elevating your strategy to unprecedented levels. Whether you are an experienced trader or a novice, come along on a journey to uncover the intricacies of these indicators and amplify your capacity to make well-informed decisions within the intricate landscape of finance.
TOP 15 Best Divergence Indicators
- All In One Divergence Indicator
- AO Divergence Indicator
- CCI Divergence Indicator
- FX5 MACD Divergence Indicator
- FXSSI.ProfitRatio
- OBV Divergence Indicator
- RSI Divergence Indicator
- Stochastic Divergence Indicator
- MACD Divergence Indicator
- FXSSI.Ratios
- TDI RT Alerts Divergence Indicator
- Histogram Divergence Indicator
- Volume Divergence Indicator
- TMA MACD Indicator
- RSIMA Baseline Divergence Indicator
All In One Divergence Indicator
The “All-In-One Divergence Indicator” stands out as a revolutionary tool, offering traders a comprehensive and efficient approach to market analysis. In this evaluation, we will explore the distinctive features that distinguish this indicator from others in the field.
One of the key strengths of the All-In-One Divergence Indicator is its ability to seamlessly integrate multiple divergence signals into a unified platform. This not only saves traders valuable time but also provides a holistic view of market dynamics, empowering them to make well-informed decisions.
The user-friendly interface of this tool addresses the often daunting complexity of market indicators. Its intuitive design makes it accessible to both experienced traders and those new to the intricacies of divergence analysis, easing the learning curve and fostering a more inclusive trading environment.
Moreover, by amalgamating various divergence indicators, the tool enhances analytical insights, allowing traders to delve into a broader spectrum of signals. This comprehensive approach enables a nuanced understanding of potential trend reversals and market shifts, contributing to more effective decision-making. The streamlined analysis process of the All-In-One Divergence Indicator not only saves time but also enables users to adapt quickly to the fast-paced nature of financial markets. Additionally, its versatility across trading styles—from day trading to swing trading and investing—makes it a versatile and adaptable tool for traders employing diverse strategies.
AO Divergence Indicator
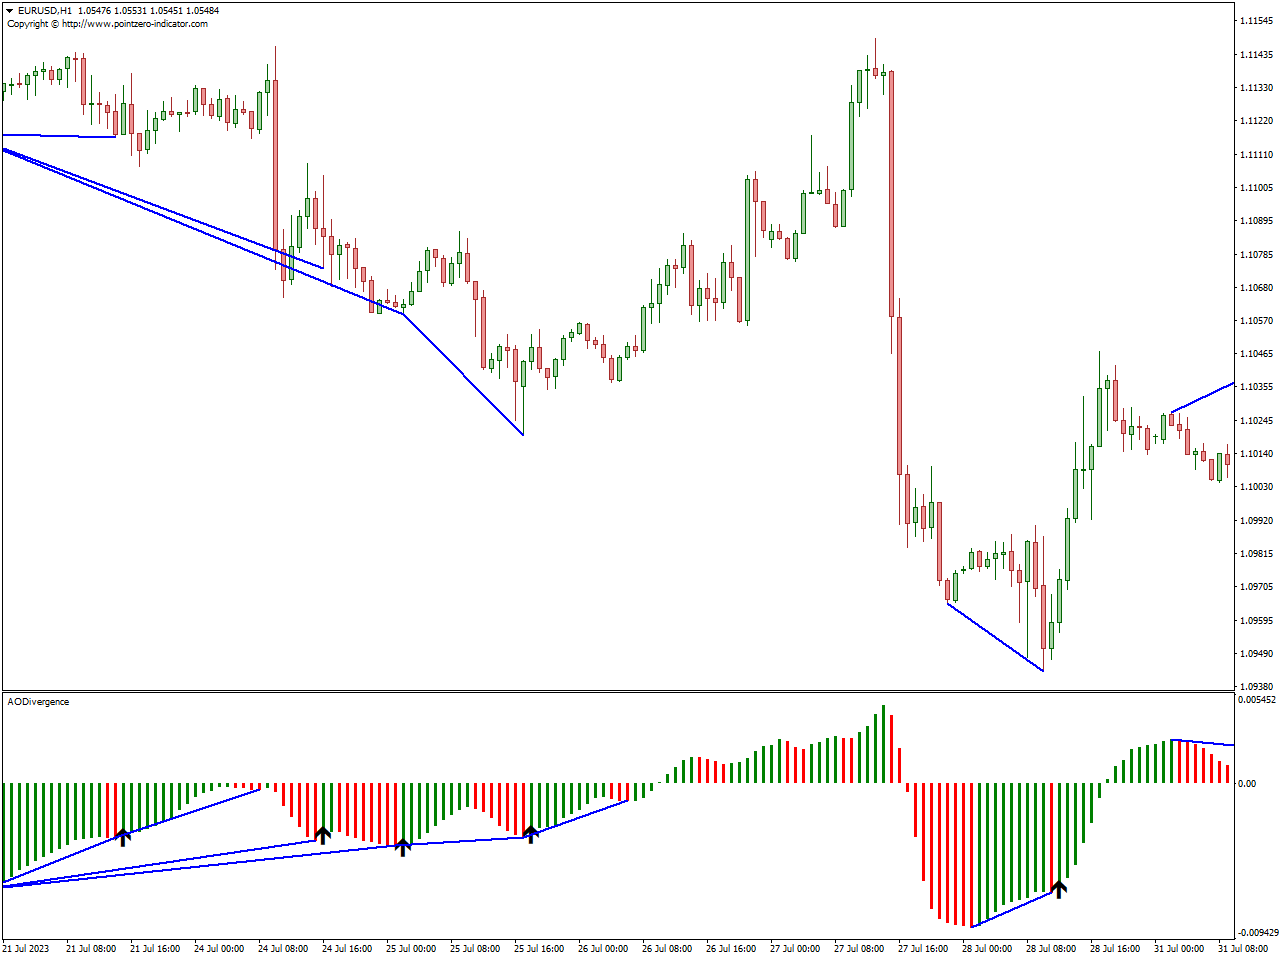
The “AO Divergence Indicator” is a meticulously crafted tool designed to detect and highlight divergences within the Awesome Oscillator (AO), offering insights into potential shifts in market momentum and indicators of upcoming trend reversals. Among its distinctive features, the indicator excels in accurate divergence recognition, precisely identifying disparities within the Awesome Oscillator to provide early signals of potential market reversals.
The user-friendly interface of the AO Divergence Indicator makes divergence analysis more accessible to both newcomers and seasoned traders, contributing to a smoother trading experience. Additionally, the indicator is tailored to concentrate on the Awesome Oscillator, providing improved signals for identifying trend reversals. Traders can leverage these signals to make well-informed decisions and optimize entry and exit points within their trading strategy.
Furthermore, the AO Divergence Indicator operates in real-time, ensuring traders receive up-to-the-minute insights into divergence patterns. This real-time functionality is crucial for those seeking timely information to make swift decisions in the dynamic conditions of the market. The indicator’s customizable parameters cater to diverse trading preferences, allowing traders to adjust settings based on their individual styles and preferences, enhancing the adaptability of the tool. The seamless integration with various trading strategies positions the AO Divergence Indicator as a valuable addition to the toolkit of traders employing different methods.
CCI Divergence Indicator
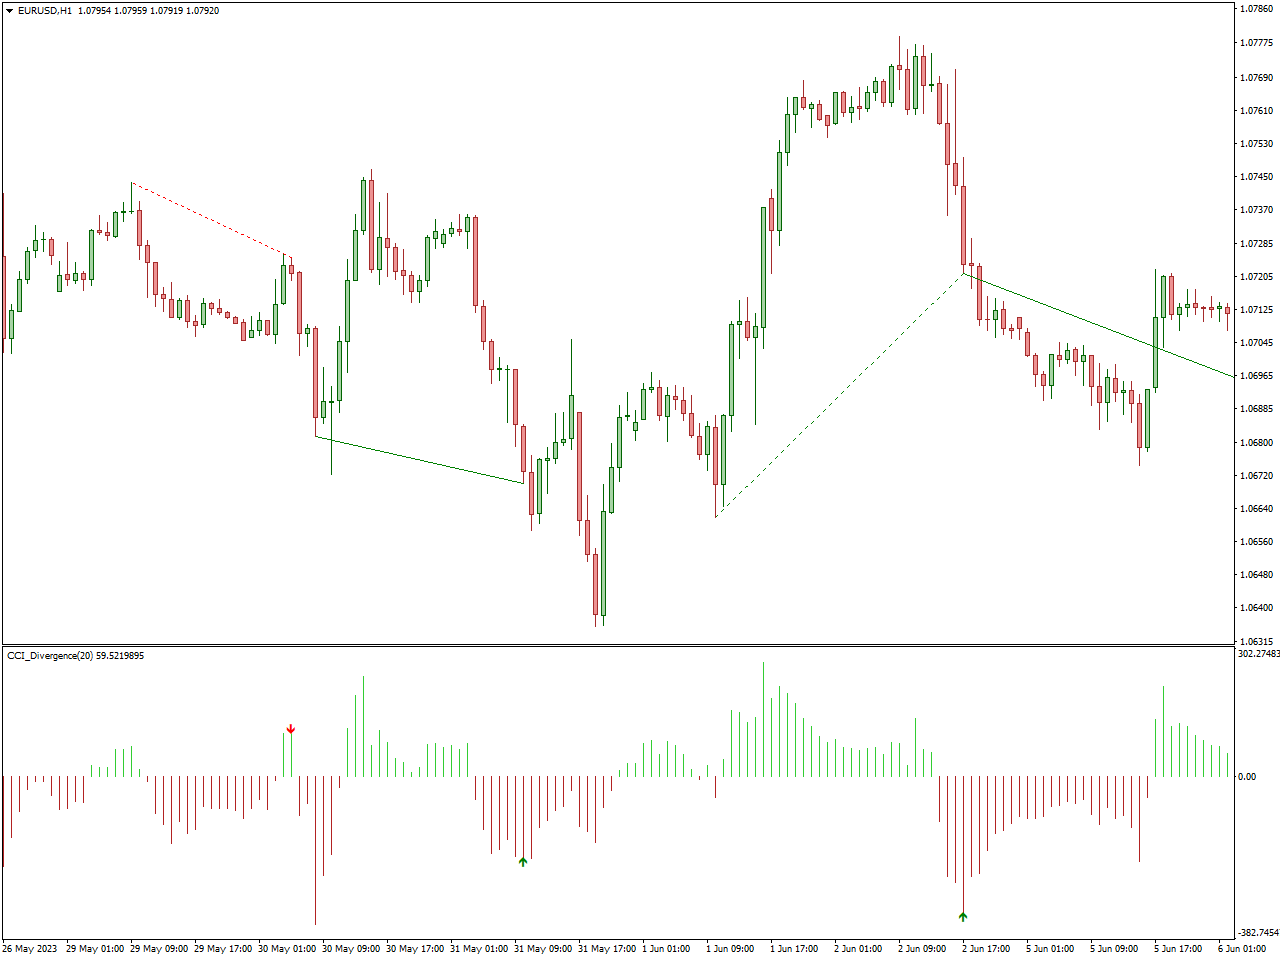
The “CCI Divergence Indicator” is a robust instrument crafted to identify and emphasize divergences within the Commodity Channel Index (CCI), providing valuable insights into potential shifts in market momentum and indications of impending trend reversals. One of its key strengths lies in precision, as the indicator is meticulously calibrated to accurately pinpoint divergences within the CCI. This precision enables traders to recognize differences between price action and the CCI, receiving early signals of potential market reversals.
Tailored to focus on the Commodity Channel Index, the CCI Divergence Indicator offers optimized signals for identifying trend reversals. Traders can leverage these signals to make well-informed decisions, optimizing entry and exit points within their trading strategy. The indicator’s adaptability is further enhanced by customizable parameters, allowing traders to adjust settings based on their individual trading styles and preferences.
The seamless integration of the CCI Divergence Indicator with various trading strategies positions it as a valuable addition to traders’ toolkits. This adaptability allows traders to effortlessly incorporate divergence signals into their existing approaches, contributing to a more comprehensive and effective trading strategy. In conclusion, the CCI Divergence Indicator is a specialized and invaluable resource that equips traders with precise insights into divergence patterns within the Commodity Channel Index, aiding them in navigating and capitalizing on changing market dynamics.
FX5 MACD Divergence Indicator
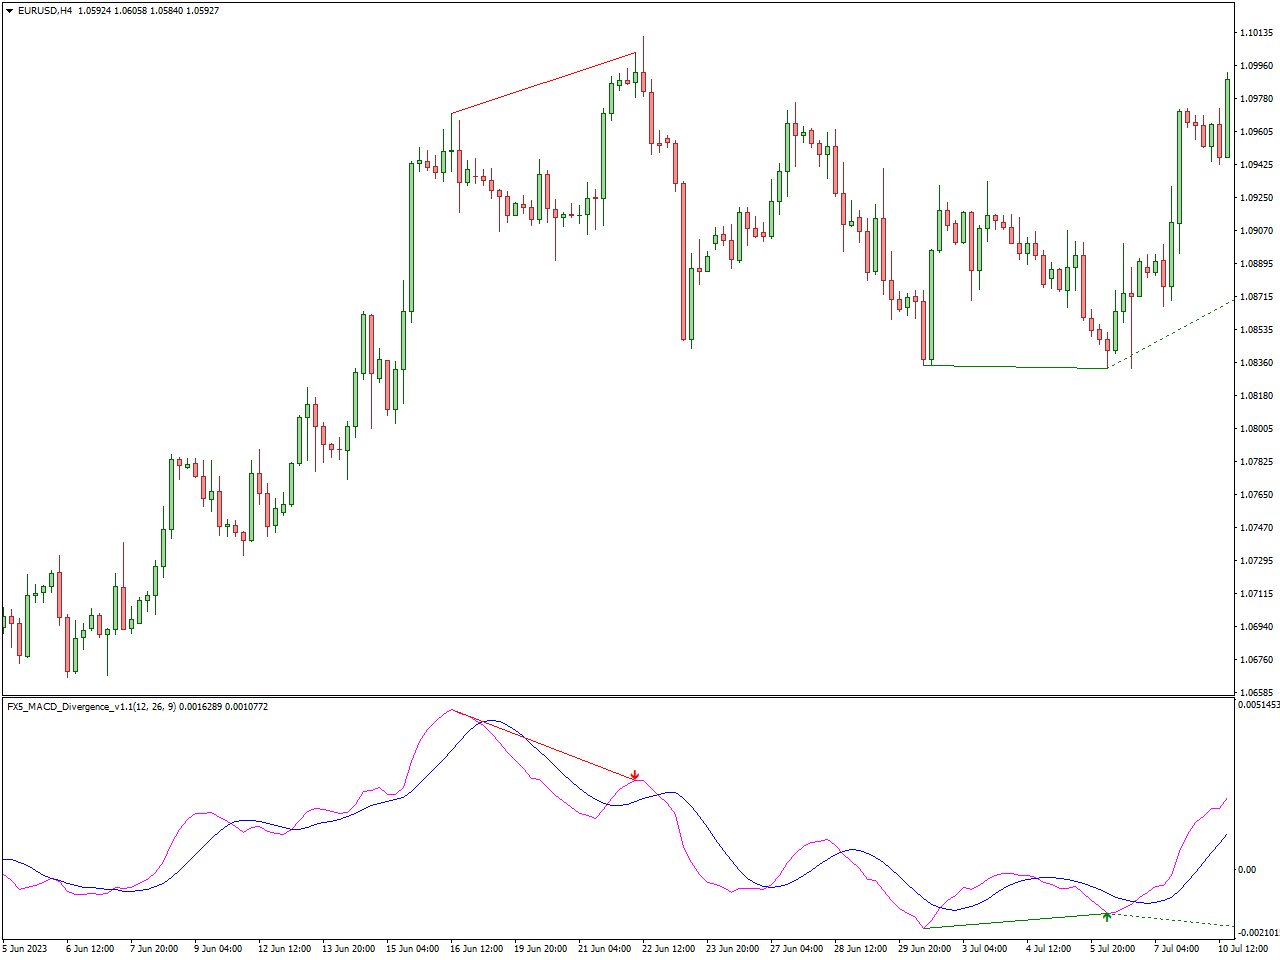
The “FX5 MACD Divergence Indicator” distinguishes itself as a meticulously designed tool tailored to identify and highlight divergences within the Moving Average Convergence Divergence (MACD) indicator. Uniquely crafted for the foreign exchange (FX) market, this indicator takes a detailed approach to identify disparities that offer crucial insights into potential shifts in market momentum and early indicators of trend reversals.
Engineered with precision, the FX5 MACD Divergence Indicator excels in precisely identifying divergences within the MACD. This precision empowers traders to differentiate between price action and the MACD, providing early signals that hint at potential market reversals. Its specialization for the forex market ensures alignment with the distinctive characteristics of FX trading, enhancing its relevance and effectiveness in the dynamic currency markets.
The indicator’s focus on the MACD enables it to provide optimized signals for identifying trend reversals, allowing traders to make well-informed decisions and strategically optimize entry and exit points within their FX trading strategy. In conclusion, the FX5 MACD Divergence Indicator stands as a specialized and invaluable resource, perfectly suited to the nuances of the foreign exchange market, offering precision, a customized design, user-friendly interface, and real-time analysis capabilities for FX traders navigating and capitalizing on evolving market dynamics, particularly focusing on MACD divergences.
FXSSI.ProfitRatio
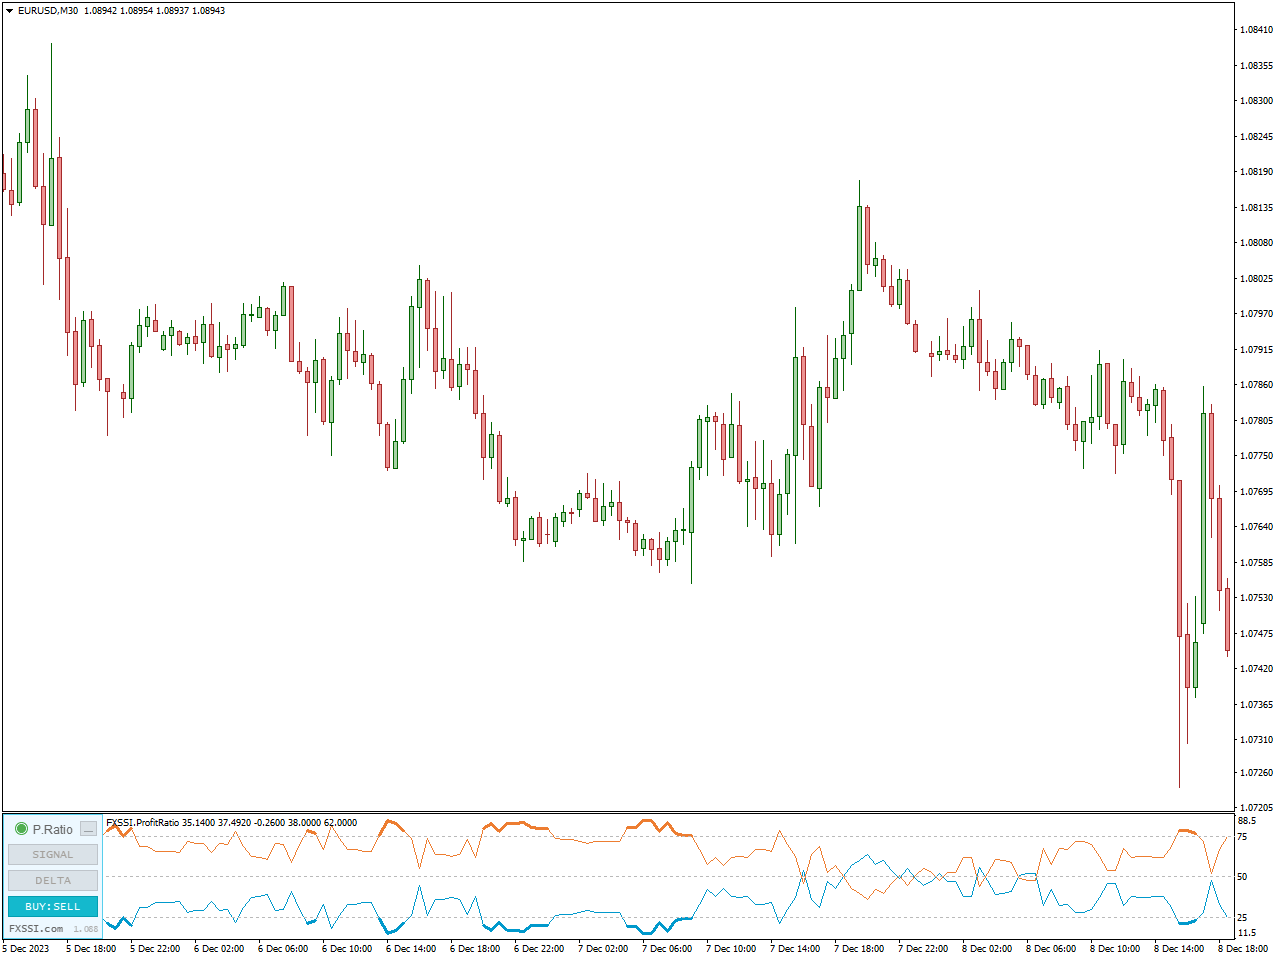
Accurately identifying trend reversal points is a significant challenge in the realm of Forex trading, as these points hold particular interest for traders seeking to capitalize on the onset of price movements. The highlighted indicator excels in pinpointing price reversals and serves a dual purpose: initiating new trades during price reversals and closing trades based on anticipated market bottoms.
The indicator’s utility extends to identifying points of price reversal, recognizing short- and medium-term trends, providing signal indications, and distinguishing between genuine and false market movements. Categorizing successful traders into buyers and sellers offers a valuable tool for trend identification, where only buyers can emerge victorious in an uptrend, and success in a downtrend is exclusive to sellers due to the absence of an opposing market side in both scenarios.
Switching to the “BUY:SELL” mode in the Profit Ratio indicator reveals that buyers exceeding the 75% mark, indicated by a thickened blue line, signify an ongoing upward trend. On the other hand, sellers surpassing the 75% mark, denoted by a thickened orange line, indicate a prevailing downward trend. This mode serves as a practical guide for traders to interpret market dynamics and make informed decisions based on the prevailing trend identified by the indicator.
OBV Divergence Indicator
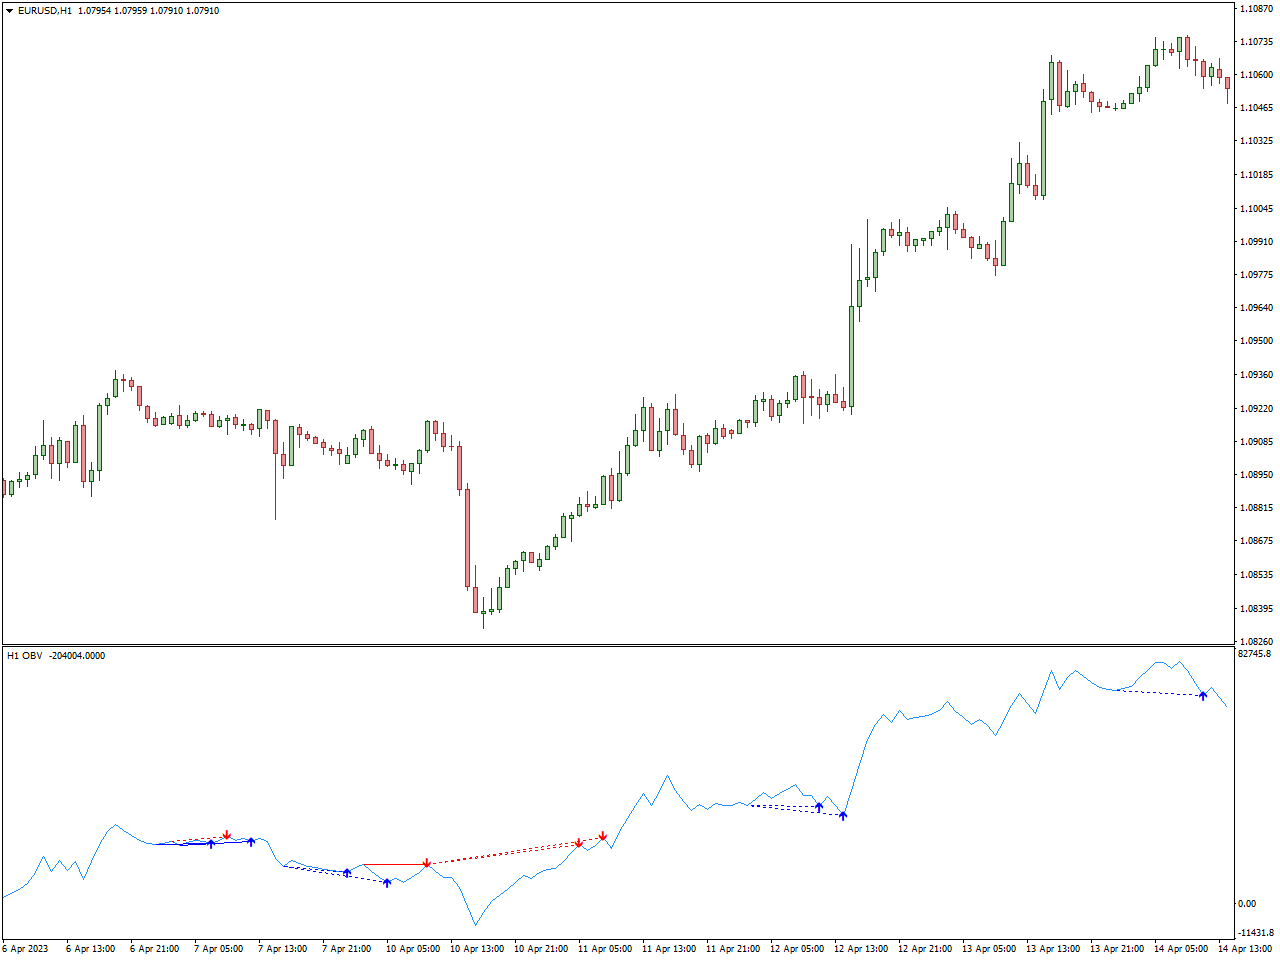
The “OBV Divergence Indicator” serves as a specialized tool crafted to identify and highlight divergences within the On-Balance Volume (OBV) indicator. Divergences detected by the OBV hold significance for traders, providing valuable insights into potential shifts in market momentum and early indications of impending trend reversals. Let’s explore the distinctive features and advantages of the OBV Divergence Indicator:
Precision in Divergence Recognition:
The OBV Divergence Indicator is intricately calibrated to precisely identify divergences within the On-Balance Volume indicator. This high level of precision empowers traders to discern differences between price action and OBV, presenting early signals indicative of potential market reversals.
Optimized Signals for Trend Reversals:
Centered on the On-Balance Volume, this indicator is purpose-built to offer optimized signals for identifying trend reversals. Traders can leverage these signals to make well-informed decisions, strategically optimizing entry and exit points within their trading strategy.
Finally, the OBV Divergence Indicator emerges as a specialized tool tailored for traders seeking to harness the power of On-Balance Volume divergences for heightened decision-making. Its precision, user-friendly interface, real-time analysis capabilities, and seamless integration with various trading strategies position it as a valuable asset in identifying and capitalizing on the dynamic changes within market dynamics.
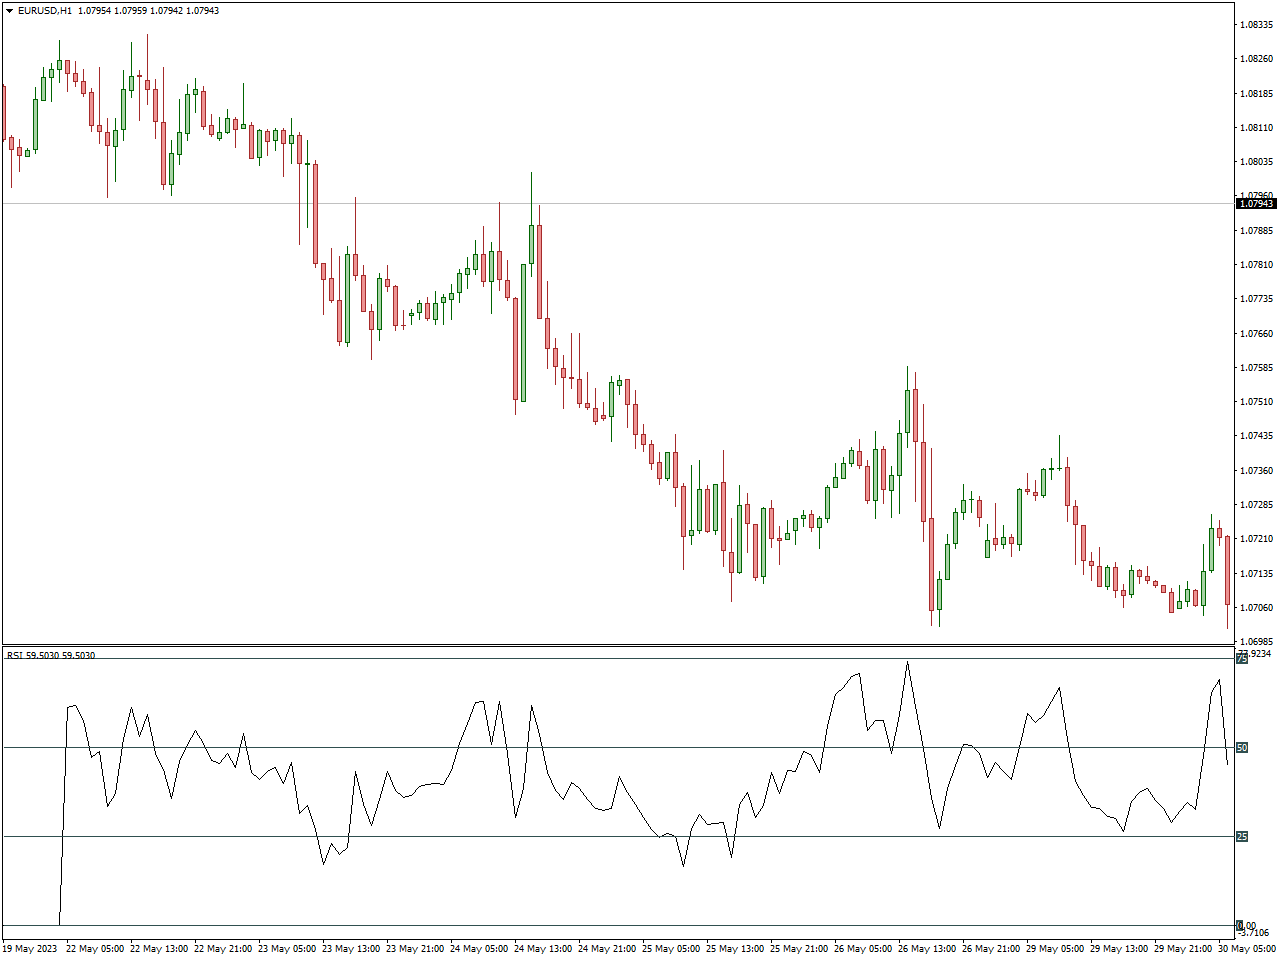
RSI Divergence Indicator
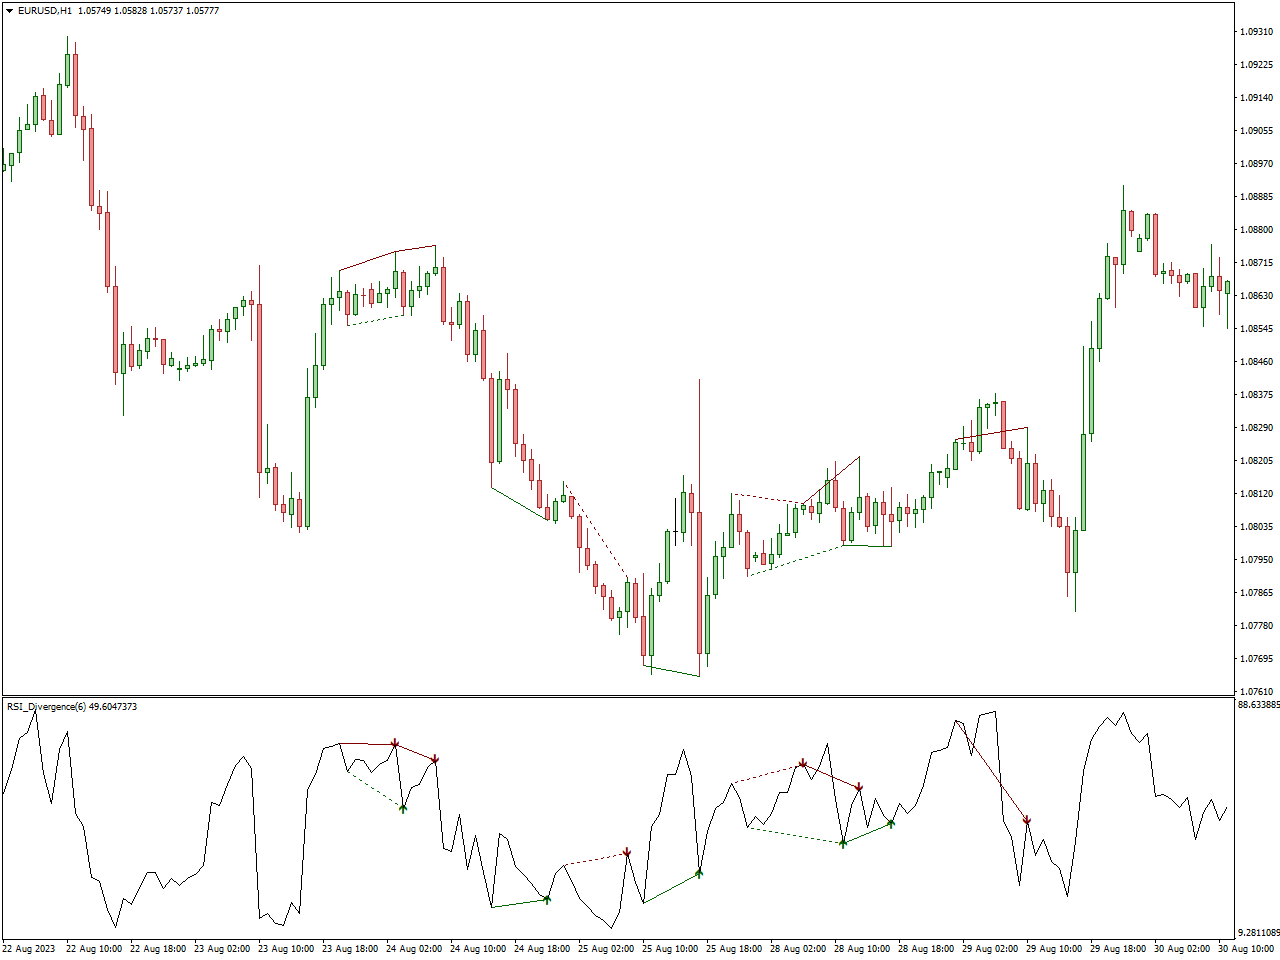
The “RSI Divergence Indicator” is a specialized tool meticulously designed to identify and highlight divergences within the Relative Strength Index (RSI). The divergences detected in the RSI provide traders with crucial insights into potential shifts in market momentum and early indicators of trend reversals. Key features and benefits of the RSI Divergence Indicator include its precision in accurately identifying divergences within the RSI, empowering traders with early signals indicative of potential market reversals.
With a specific focus on the RSI, this indicator is purpose-built to provide enhanced signals for identifying trend reversals. Traders can leverage these signals to make well-informed decisions, strategically optimizing entry and exit points within their trading strategy. Additionally, the RSI Divergence Indicator is designed to cater to diverse trading preferences, often incorporating customizable parameters that allow traders to adjust settings based on their individual styles and preferences, enhancing the indicator’s adaptability to different market conditions.
The indicator seamlessly integrates with various trading strategies, allowing traders to incorporate divergence signals into their existing approaches. This adaptability positions the RSI Divergence Indicator as a valuable addition to the toolkit of traders employing different methods. In conclusion, the RSI Divergence Indicator serves as a specialized and invaluable resource for traders seeking to capitalize on Relative Strength Index divergences, offering precision, user-friendly interface, real-time analysis capabilities, and seamless integration with diverse trading strategies for more informed decision-making in dynamic market conditions.
Stochastic Divergence Indicator
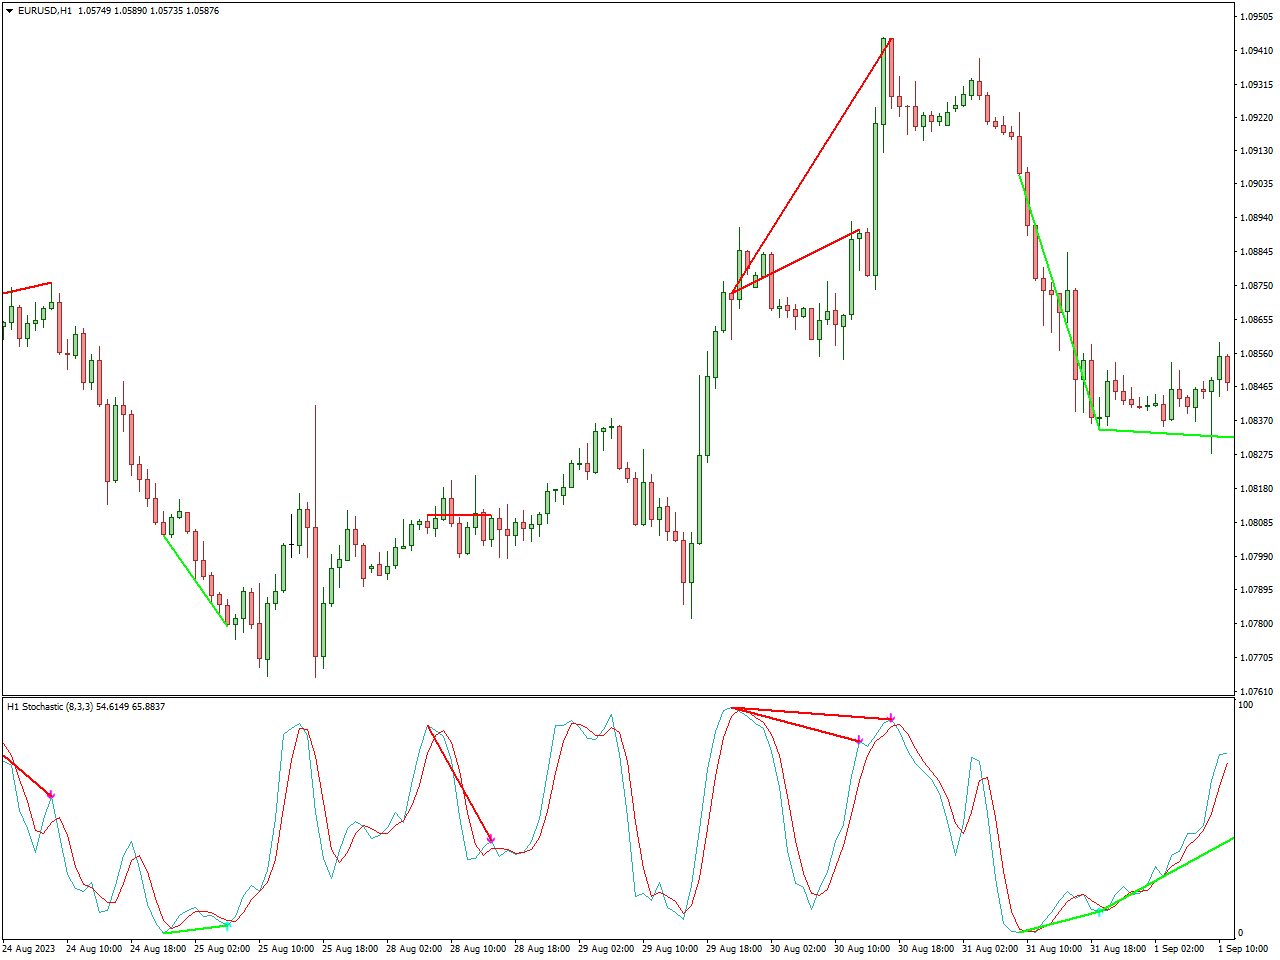
The Stochastic Oscillator, a widely employed momentum indicator in technical analysis, serves to pinpoint overbought or oversold conditions in a market. Comprising two lines, %K and %D, it operates on the principle that, during an uptrend, prices tend to close near the high of the trading range, while in a downtrend, they gravitate towards the low.
The %K line acts as the primary indicator, reflecting the current market price relative to the range over a specific period. Concurrently, the %D line functions as a moving average of %K, commonly employed to generate trading signals.
Divergence: Divergence manifests when the price of an asset moves counter to the direction indicated by a technical indicator. It is frequently viewed as a potential signal of a weakening trend and an impending reversal. Two divergent types exist: bullish (positive) and bearish (negative).
Bullish Divergence materializes when the price establishes a new low, but the indicator fails to confirm the low, hinting at a potential upward reversal. Conversely, Bearish Divergence arises when the price achieves a new high, yet the indicator does not validate the high, suggesting a potential downward reversal.
MACD Divergence Indicator
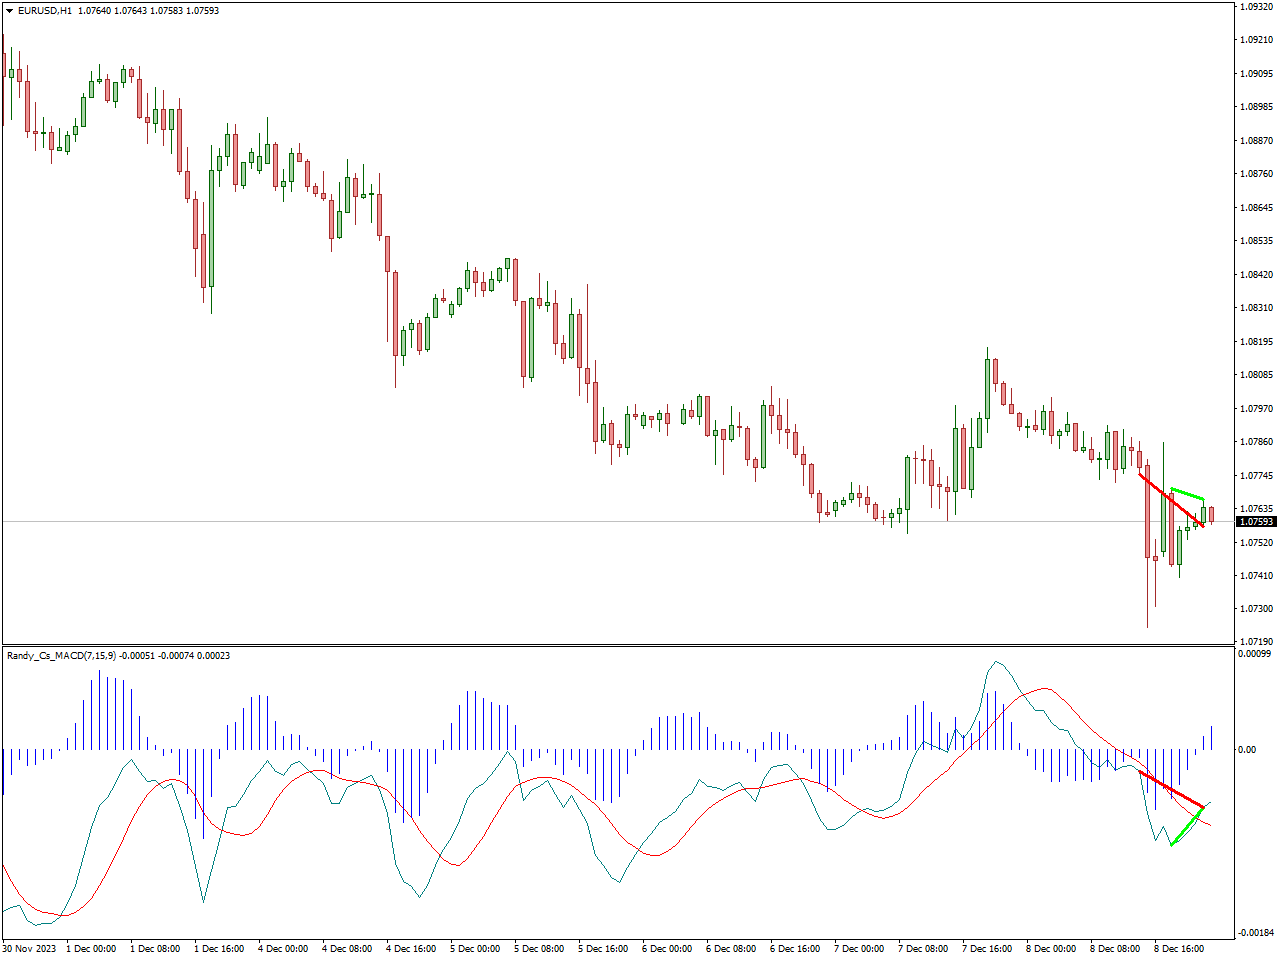
The MACD Divergence Indicator plays a pivotal role in technical analysis by scrutinizing disparities between the Moving Average Convergence Divergence (MACD) indicator and the price of an asset. The MACD, renowned for tracking trends, exposes the relationship between the 12-period and 26-period Exponential Moving Averages (EMAs) of the asset’s price. A 9-period Signal Line, an EMA of the MACD, overlays the MACD line to generate trading signals. Divergence in the MACD context occurs when its direction conflicts with the price movement, serving as a potential signal for trend reversals or momentum decrease.
Bullish Divergence arises when the price establishes a new low, but the MACD fails to confirm it, hinting at a potential upward reversal. On the other hand, Bearish Divergence occurs when the price reaches a new high, yet the MACD does not confirm it, suggesting a potential downward reversal. The MACD Divergence Indicator, integrated into the traditional MACD, visually represents these divergences, providing traders with a tool to identify turning points and make informed decisions about trade entry or exit.
While Bullish and Bearish Divergence can offer valuable insights, it’s crucial to recognize that divergence is not foolproof. Traders often combine it with other technical analysis tools for confirmation, acknowledging that the effectiveness of any indicator can vary based on market conditions. Considering multiple factors remains essential in making well-informed trading decisions.
FXSSI.Ratios
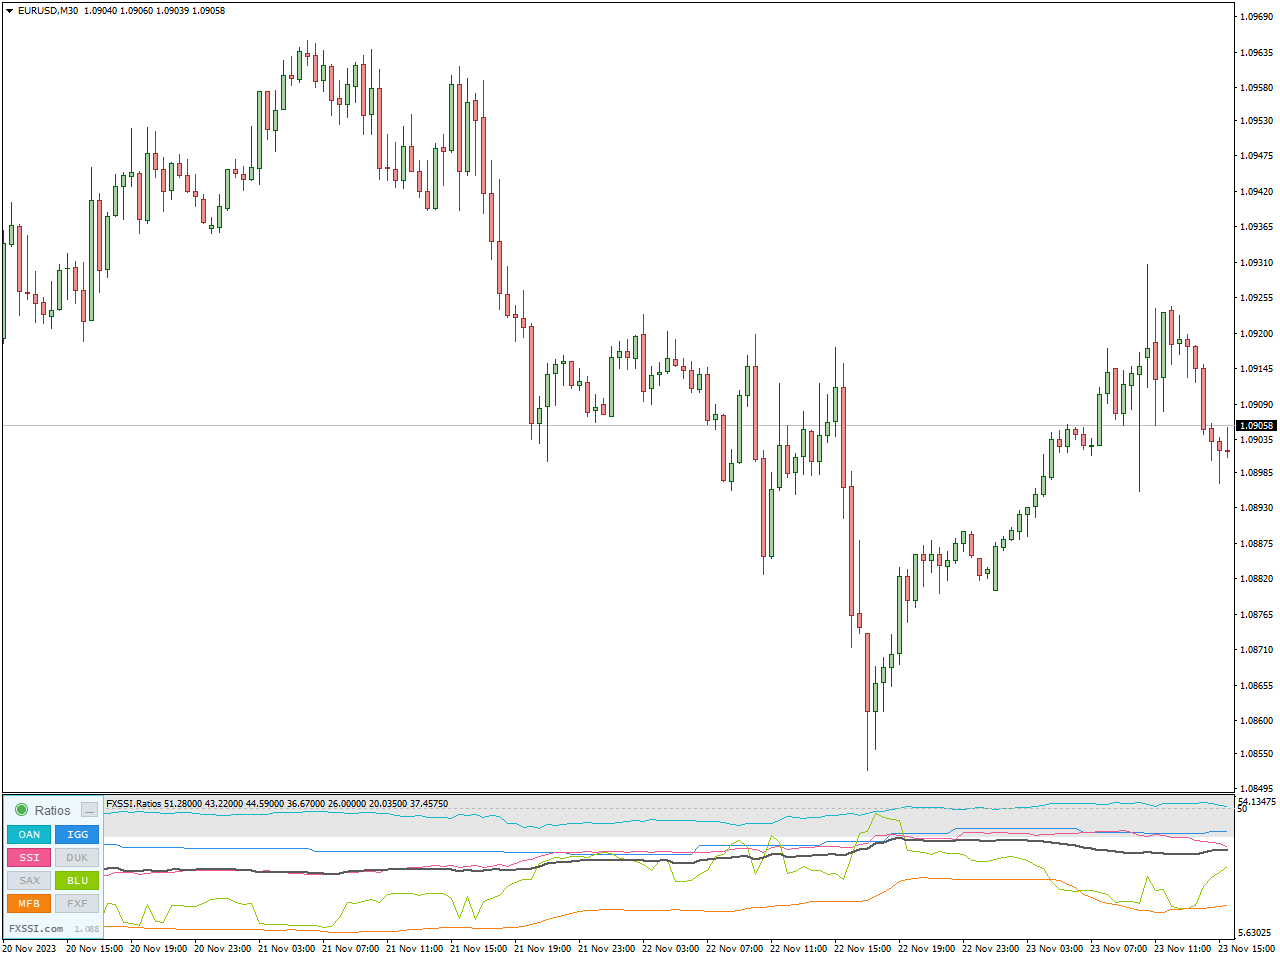
Monitor changes in market sentiment using the Ratios indicator, which relies on historical data depicting the ratio of buyers to sellers. This tool facilitates a more intricate examination of critical points on the chart, supplying valuable insights into potential future price movements.
Crafted to illustrate the proportion of buyers’ and sellers’ positions in a chart format, the Ratios Indicator derives its ratio data from major brokerage firms and services such as Oanda. Noteworthy is the indicator’s exclusive consideration of presently open trades, disregarding closed ones in its calculations. Drawing data from 10 sources across 12 Forex pairs, selected for their relevance, the indicator provides insights into open positions.
The fundamental principle guiding the indicator is to steer clear of initiating trades in alignment with the majority of market participants. Adhering to this principle heightens the likelihood of executing successful trades, particularly when trading against the prevailing market sentiment. Going against the market majority often aligns with the prevailing trend, given that most trades are typically positioned counter to the prevailing trend.
The Ratios indicator incorporates diverse analysis algorithms, furnishing traders with multiple options to enhance their decision-making processes.
TDI RT Alerts Divergence Indicator
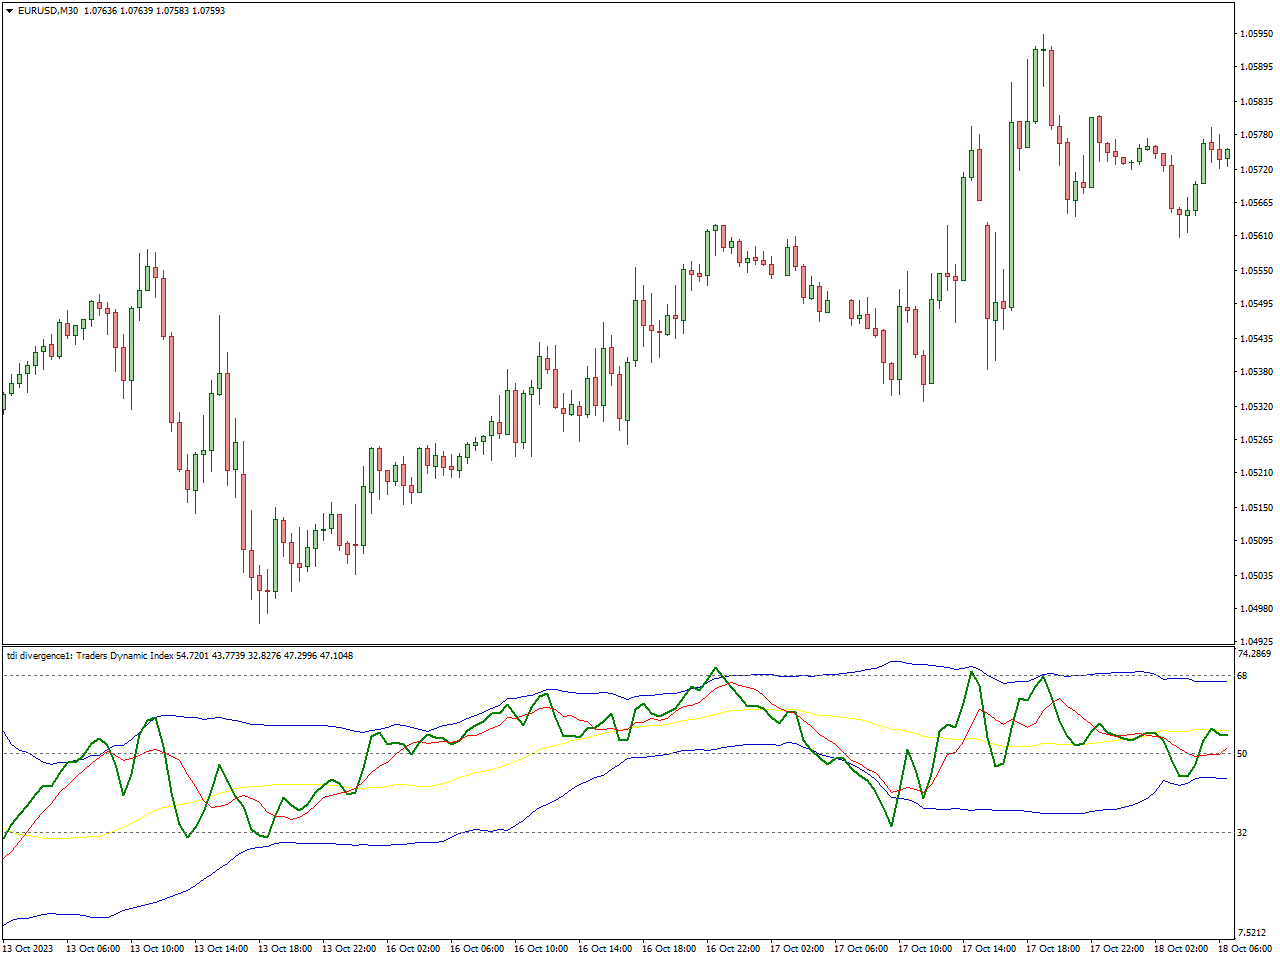
The Traders Dynamic Index (TDI) indicator amalgamates various indicators, offering traders a multifaceted perspective on market conditions through the TDI RT Alerts Divergence. This tool aids in gauging both the direction and strength of a trend, as well as market volatility.
The TDI relies on the fundamental Relative Strength Index (RSI) indicator to assess the strength of the ongoing trend or the extent of price changes. Employing the moving average method smoothens the lines, while Bollinger bands measure the intensity of fluctuations. Due to its integrative approach, the TDI RT Alerts Divergence indicator can serve as a self-sufficient and comprehensive trading system.
This trading tool simultaneously presents the current trend’s direction and velocity, empowering traders to pinpoint optimal entry points. Despite its intricate nature, the indicator’s functionality is straightforward to comprehend.
The TDI RT Alerts Divergence indicator proves to be a valuable tool for delineating market trends and volatility, particularly recommended for use on assets characterized by stable volatility, such as major forex pairs.
Histogram Divergence Indicator
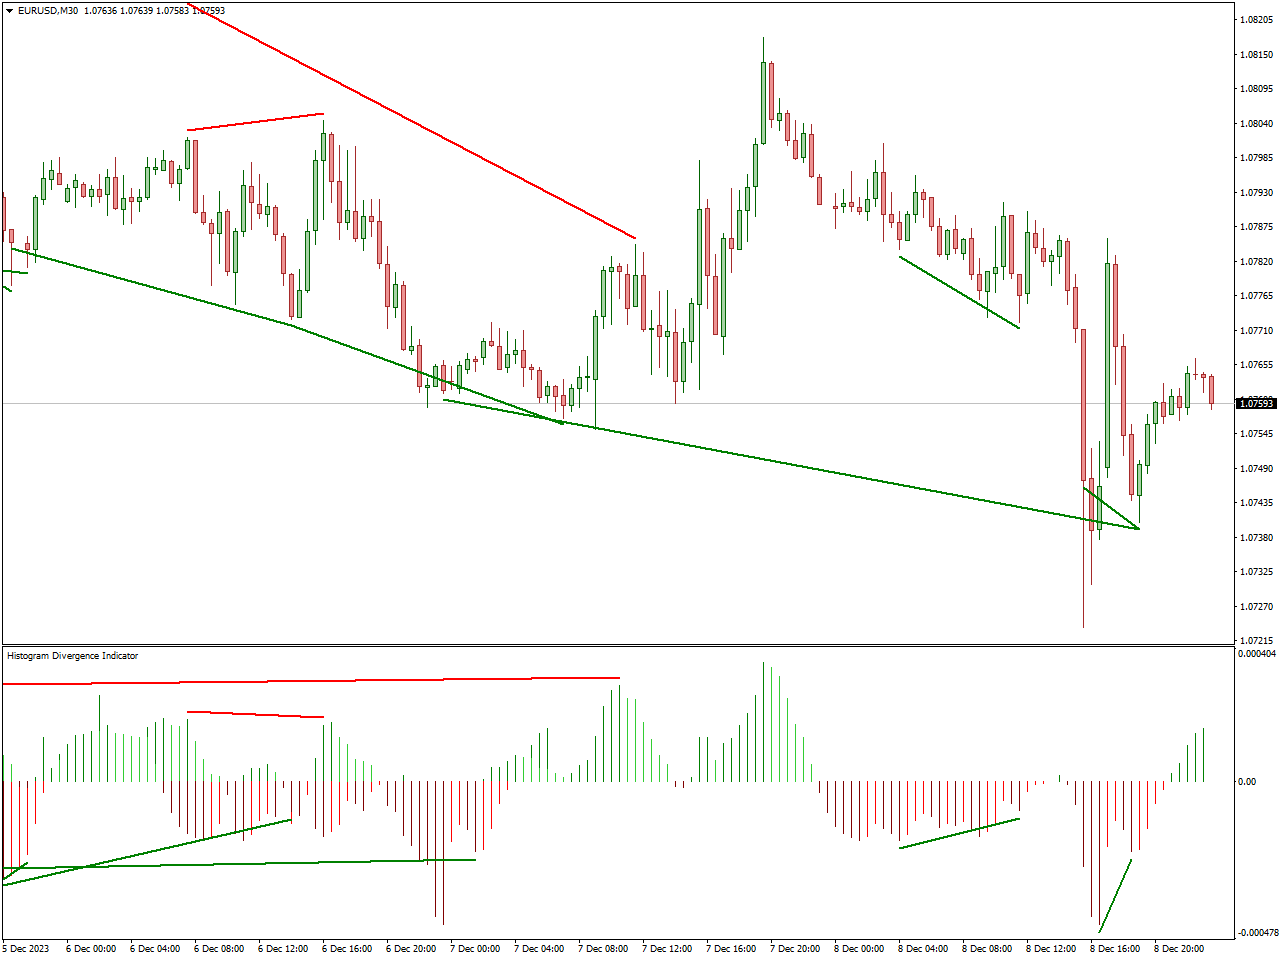
The MT4 Histogram Divergence indicator autonomously recognizes and charts divergence lines. Leveraging the classic MACD (Moving Average Convergence and Divergence) indicator, this tool identifies discrepancies between the price and MACD. Additionally, it plots both bullish and bearish divergence lines on both the price chart and the indicator window. This empowers forex traders to easily pinpoint optimal entry points and make informed Buy and Sell decisions.
This indicator is versatile, functioning effectively on various intraday charts as well as long-term charts such as daily, weekly, and monthly price charts. Both novice and seasoned forex traders can utilize this tool for trading divergence.
Divergence trading revolves around pinpointing potential points of trend reversal. A valid divergence is recognized when the price and indicator values indicate opposite directions. Consequently, the indicator generates trend lines on both the price chart and the indicator once a divergence is identified.
When the indicator plots the line below the price, it signals a potential bullish reversal. Traders can then enter a buy position with a stop loss positioned below the preceding swing low. Although the indicator does not furnish a profit target, traders are advised to secure profits with a favorable risk-reward ratio.
Conversely, if the divergence appears above the price, it indicates a potential bearish reversal. Traders should initiate a Sell trade, entering the market with a stop loss above the prior swing high.
It’s crucial to acknowledge that all types of price reversals carry a risk of failure and may generate multiple false entry signals. This is due to the indicator potentially detecting divergence early, while market participants aligned with the existing trend may still influence further movement before an actual price reversal occurs.
Volume Divergence Indicator
Volume divergence indicates an impending reversal in price dynamics triggered by a surge or decline in trading volume. This phenomenon occurs when the price undergoes movements that are not mirrored by corresponding changes in volume. To illustrate, a bearish volume divergence materializes when the price forms lower highs accompanied by increased bearish volume. Conversely, a bullish volume divergence takes place when the price establishes higher highs amidst diminishing trading volumes.
Various indicators, such as MACD and RSI, are commonly employed to detect price divergence. However, the most effective tool for divergence trading is the Volume Divergence indicator, given the pivotal role of volume in trading.
Moreover, the Volume Divergence indicator caters to diverse trading styles, including scalping, day trading, intraday trading, and swing trading. It is equally beneficial for traders at all skill levels, ranging from novices to intermediate and advanced forex practitioners.
For generating BUY signals, the initial step involves identifying a bullish volume divergence. Subsequently, traders can initiate a BUY/LONG position in alignment with concurrent price action, such as a bullish engulfing pattern or a pin bar. This same principle applies to executing SELL signals, where a bearish volume divergence serves as the precursor to entering a SELL position, aligning with relevant price action signals.
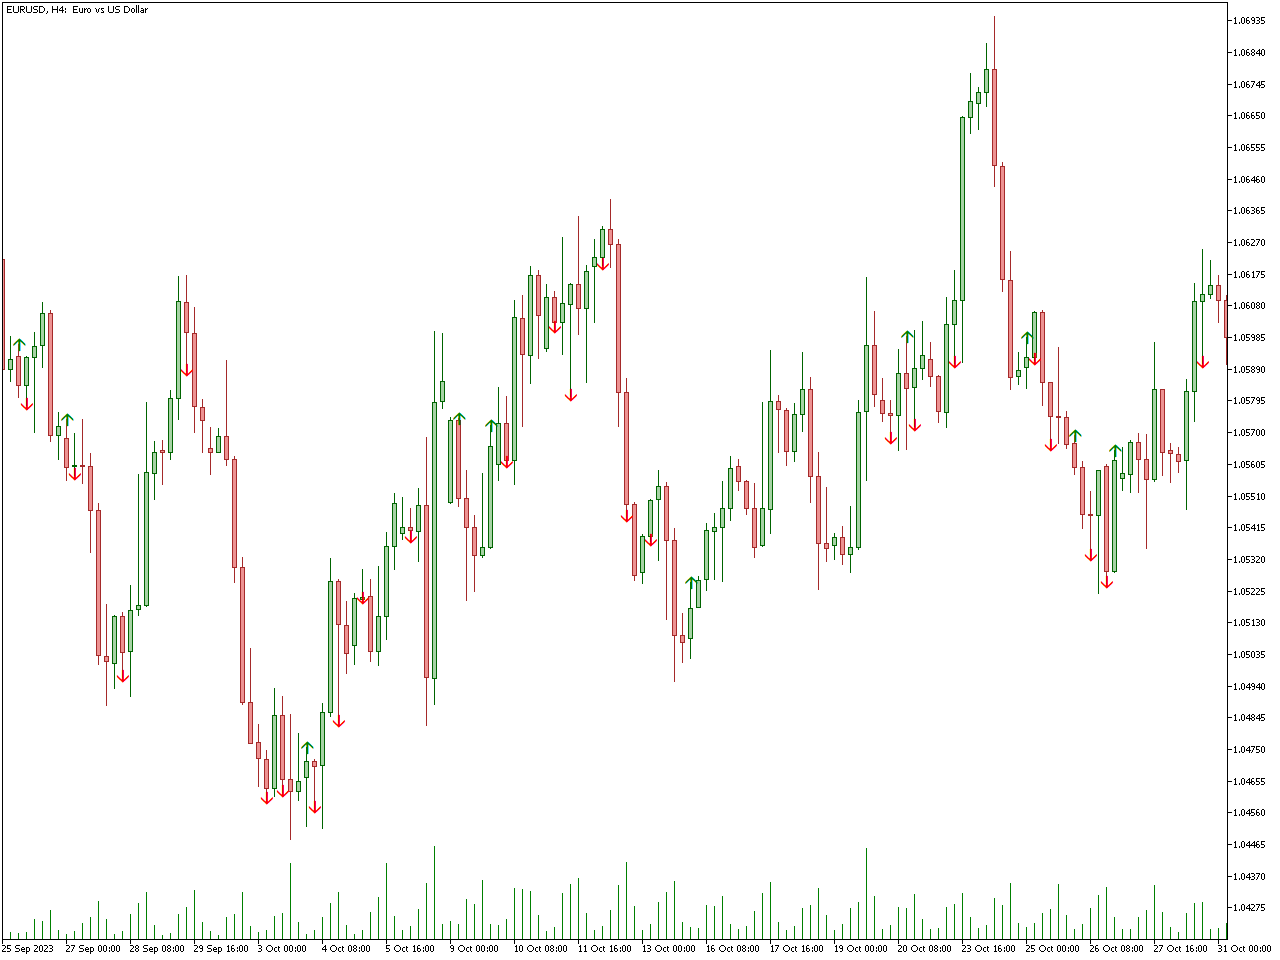
TMA MACD Indicator
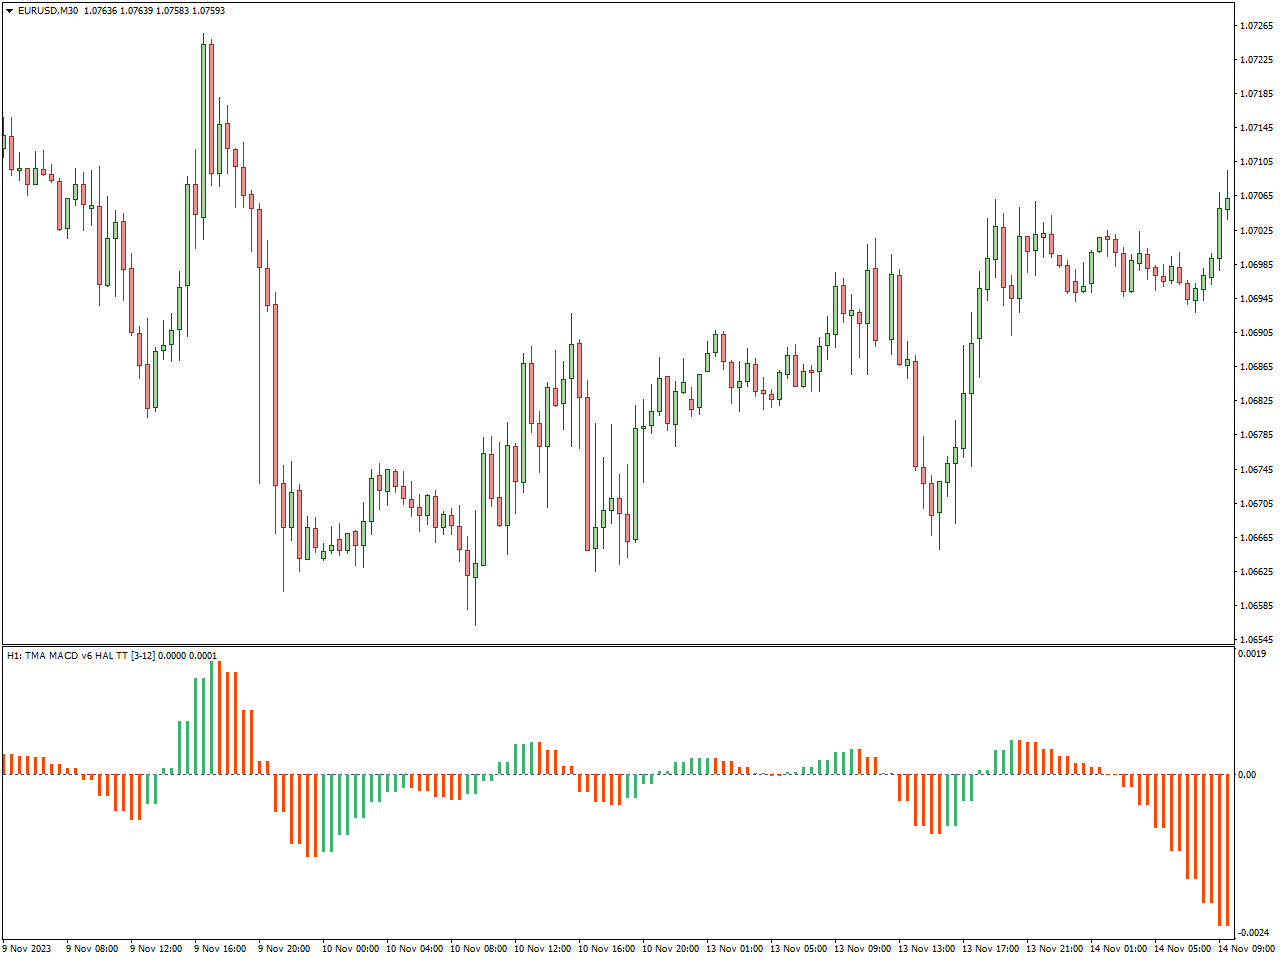
The indicator computes MACD values utilizing the time frame one level higher than the current chart’s time frame. Consequently, it furnishes trading signals grounded in the trend of the next higher time frame. Adhering to the trend direction of a higher time frame empowers traders to capitalize on fluctuations within the current chart’s time frame.
Buy and sell signals are triggered when the MACD histogram undergoes a color change. This color-coded MACD indicator distinctly highlights trend shifts, making it easily discernible for both novice and experienced traders. Trading in alignment with higher time frames tends to yield more lucrative outcomes than lower time frames.
Instead of the conventional MACD Zero line crossover, the indicator can generate signals based on MACD values crossing above a predetermined Hot level. These predefined Hot levels aid technical traders in filtering out noise and avoiding trading signals arising from minor fluctuations. However, these levels are contingent on time frames and currency pairs, as well as their respective volatility. Hence, traders should conduct testing and determine Hot levels judiciously for successful trading.
Market conditions are deemed bullish when above the MACD Hot level and bearish when below these levels. Buy and Sell signals are indicated by arrows on the charts during bullish and bearish crossovers.
RSIMA Baseline Divergence Indicator
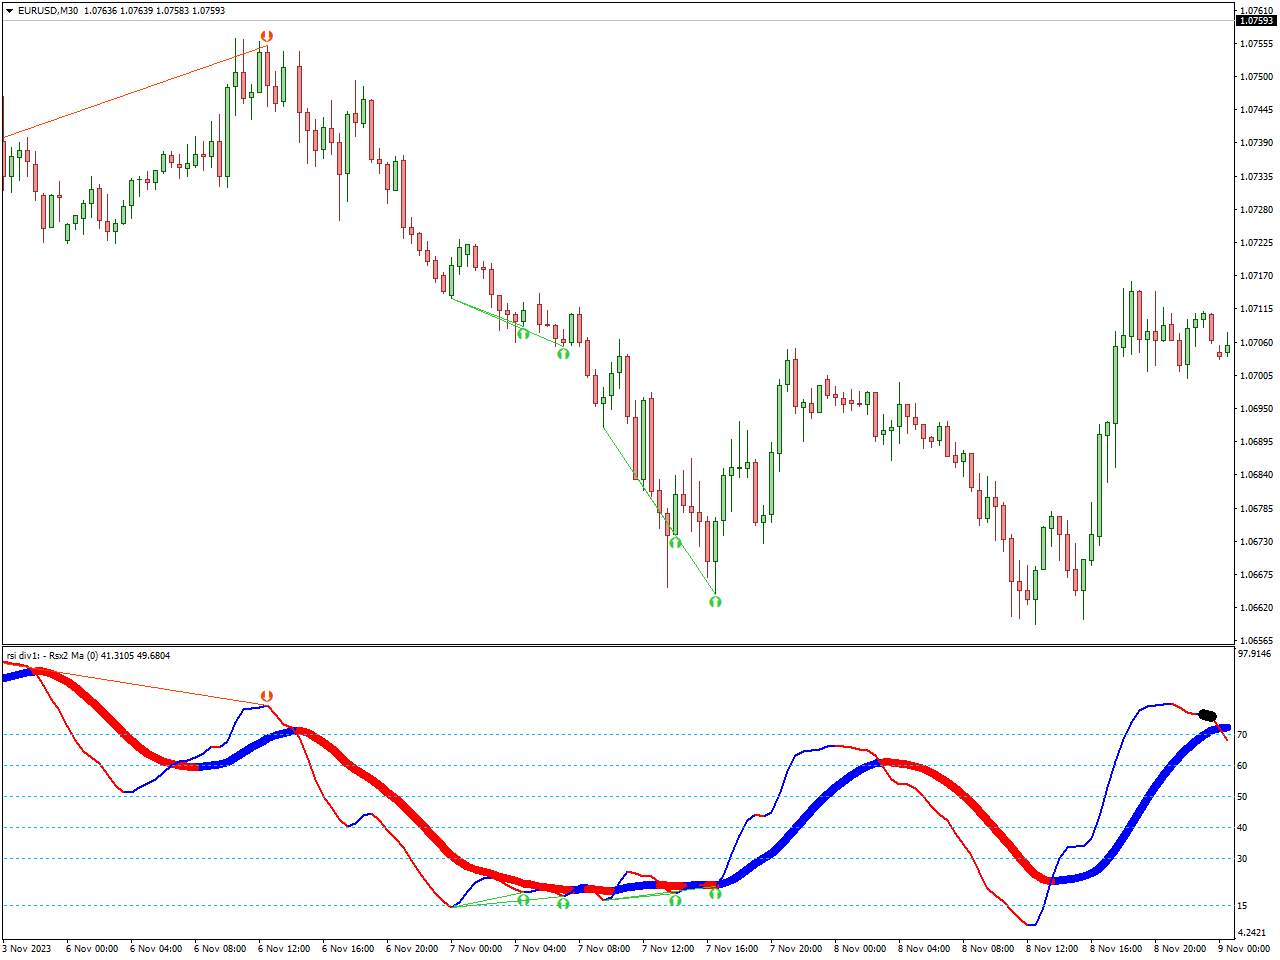
The RSIMA Baseline Divergence is a distinctive MT4 indicator renowned for precisely sifting through robust divergence signals. Its primary function involves evaluating potential shifts in trends through the intersection of the relative strength index and baseline moving average.
In addition to identifying divergences, this indicator also generates signals for overbought and oversold conditions, providing an extra layer of confirmation for your trading decisions. Whether you’re a beginner or an expert, comprehending and following signals from the RSIMA Baseline Divergence is accessible to all.
Notably, this indicator introduces a baseline moving average to the mix, facilitating the plotting of crossover signals with RSI and refining the identification of divergence signals. During a bullish crossover, both indicator levels adopt a blue hue, while they transition to red to signify a bearish crossover.
A buy signal is triggered during a bullish divergence when the RSI is below 30 (indicating oversold conditions). Conversely, in the case of bearish divergences, selling signals are favored when the RSI enters the overbought zone (above 70).
Conclusion
In the constantly evolving terrain of financial markets, the importance of dependable indicators cannot be emphasized enough. As we wrap up our exploration into the realm of divergence indicators, one fact becomes evident – the potency of well-informed decision-making. These indicators, equipped with the ability to unveil subtle shifts in market sentiment, offer traders a distinctive edge. Whether it’s discerning trend reversals or affirming existing trends, the finest divergence indicators evolve into indispensable allies in the quest for trading success. Empowered by this knowledge, traders can confidently navigate the uncertainties of the market, executing strategic maneuvers that harmonize with the ever-shifting currents of finance. As you integrate these influential tools into your trading toolkit, may your endeavors be characterized by precision, profitability, and a profound grasp of market dynamics.