

In the dynamic landscape of financial markets, identifying trend reversals is a skill that sets successful traders apart. Trend reversal indicators play a crucial role in empowering traders with insights into potential shifts in market momentum. From MACD Divergence to RSI signals, these indicators are instrumental in providing early warnings and optimizing entry and exit points in trading strategies. This comprehensive guide delves into the functionality and significance of various trend reversal indicators, equipping traders with the knowledge to navigate changing market dynamics.
TOP 15 Trend Reversal Indicators
- Trend Reversal Indicator
- 1-2-3 Pattern Indicator
- 3 Bars High Low Indicator
- FXSSI.OrderBook
- Advanced Trendlines Indicator
- Lucky Reversal Indicator
- FXSSI.ProfitRatio
- Auto Channel Indicator
- AutoFib TradeZones Indicator
- Reversal Bar Indicator
- Best Agimat Reversal Indicator
- Momentum Reversal Detector Indicator
- Brilliant Reversal Indicator
- MA Rainbow Indicator
- PZ Reversals Fractals Indicator
Trend Reversal Indicator
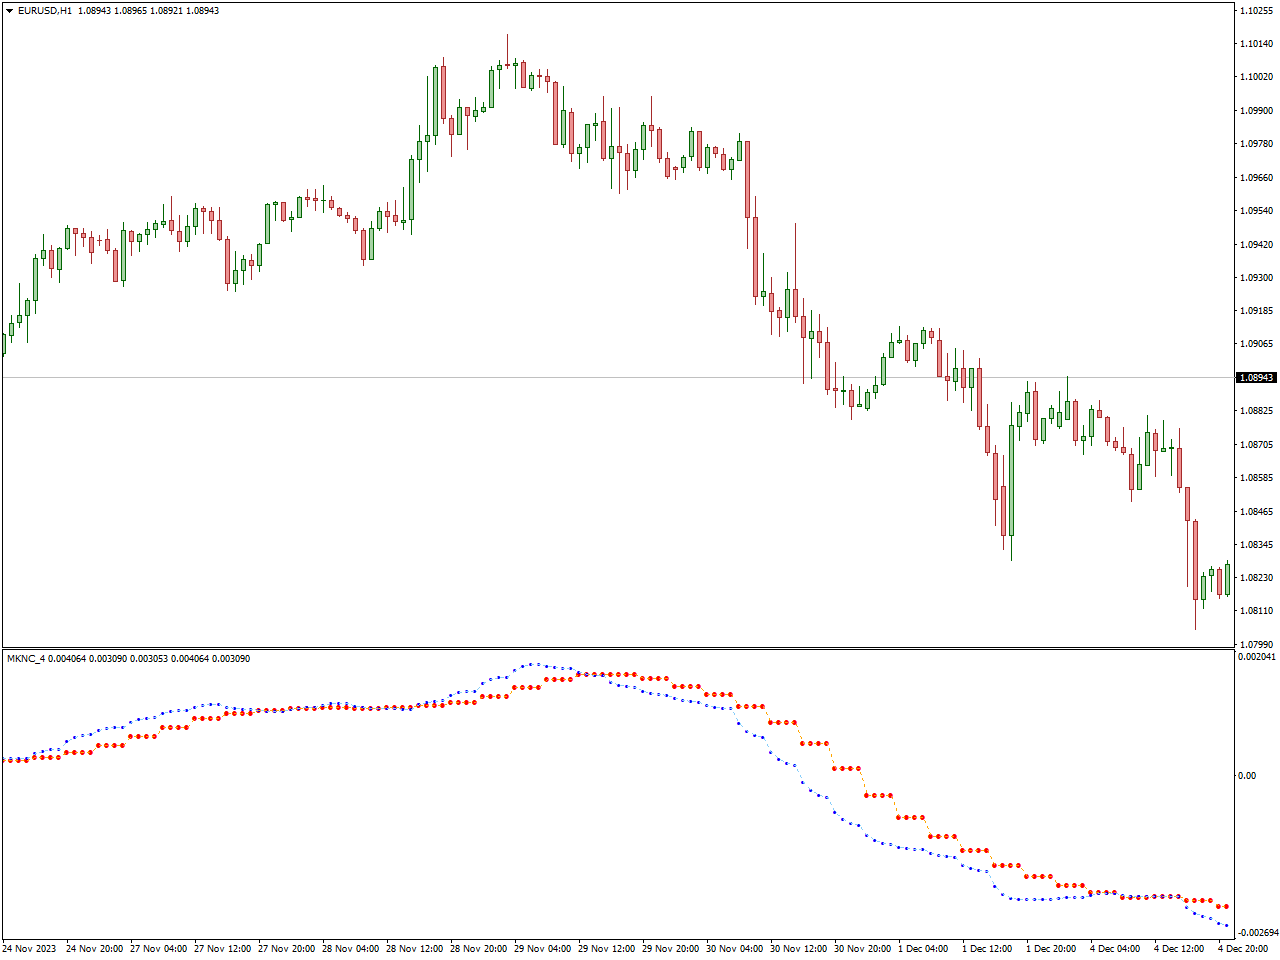
The trend reversal indicator functions as an oscillator utilizing two exponential moving averages. It appears in a distinct window below the price chart. Buy and sell signals are initiated upon the intersection of the slow and fast-moving exponential moving averages. This indicator proves to be highly effective in pinpointing trend reversals.
Tailored for day trading and scalping, the MT4/MT5 trend reversal indicator can be applied across various time frames, spanning from 1 minute to 1 month. However, its optimal performance occurs on higher time frames, such as the four-hour (H4) chart. Utilizing lower time frames may lead to numerous fluctuations, potentially resulting in minor losses that could impact your portfolio significantly.
A noteworthy aspect is the user-friendly nature of interpreting the indicator. Traders, regardless of their experience level or trading style, whether they are long-term investors or scalpers, can derive benefits from this indicator. Moreover, it provides flexibility by allowing users to adjust the exponential moving average periods on the input tab to align with their specific trading strategies.
Initiate a buy signal when the fast EMA intersects above the slow EMA, indicated by the blue dotted line crossing the red line. Preferably, enter the long position at the opening price of the subsequent candlestick. When considering closure of the long position, adhere to a predetermined risk-to-reward ratio. Alternatively, exit the trade if a sell signal emerges, negating the bullish price movement. For a bearish trade entry, observe the red line intersecting above the blue line, signaling the commencement of a downtrend. Consequently, initiate short positions, entering the trade at the opening of the ensuing candlestick. Exit the trade based on the predetermined loss or reward parameters. Alternatively, await a bullish signal from the indicator before exiting the trade.
1-2-3 Pattern Indicator
The 1-2-3 pattern indicator is a widely employed tool in the realm of technical analysis, serving the primary purpose of identifying potential reversals in market trends. At its core, this pattern hinges on the arrangement of three pivotal price points that collectively form a distinctive geometric shape on a price chart. The sequence involves an existing bullish or bearish trend (Step 1), a temporary reversal creating point 1 (Step 2), a resumption of the original trend surpassing the initial reversal point, forming point 2 (Step 3), and finally, another reversal leading to the formation of point 3, typically in proximity to point 1 (Step 4).
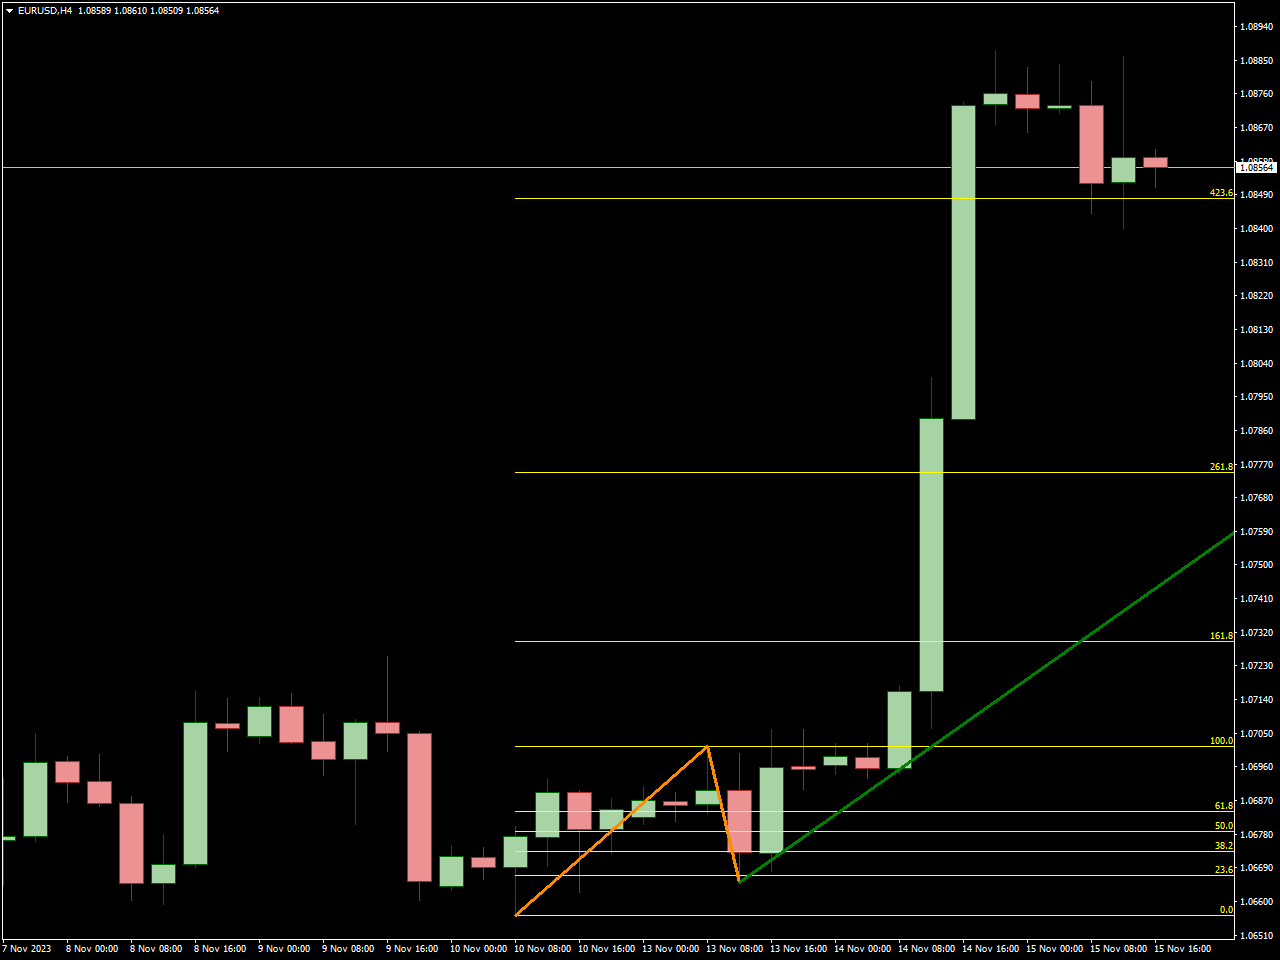
The 1-2-3 Pattern indicator precisely identifies price action signaling the conclusion of a trend. Utilizing non-repainting zig-zag lines and Fibonacci levels, this indicator delivers clear entry and exit signals.
In the context of an uptrend, the indicator displays a green line, indicating opportune buy signals. Conversely, during a downtrend, a blue line emerges, signaling a sell opportunity.
Five Fibonacci levels serve as significant support and resistance points. The lower Fibonacci level functions as support, while the higher one acts as resistance.
As the trend undergoes a reversal, the indicator dynamically changes its color from green to orange, or vice versa, signaling an exit point for the trade. Alternatively, exiting the trade is viable when the price action breaches or exceeds the line.
3 Bars High Low Indicator
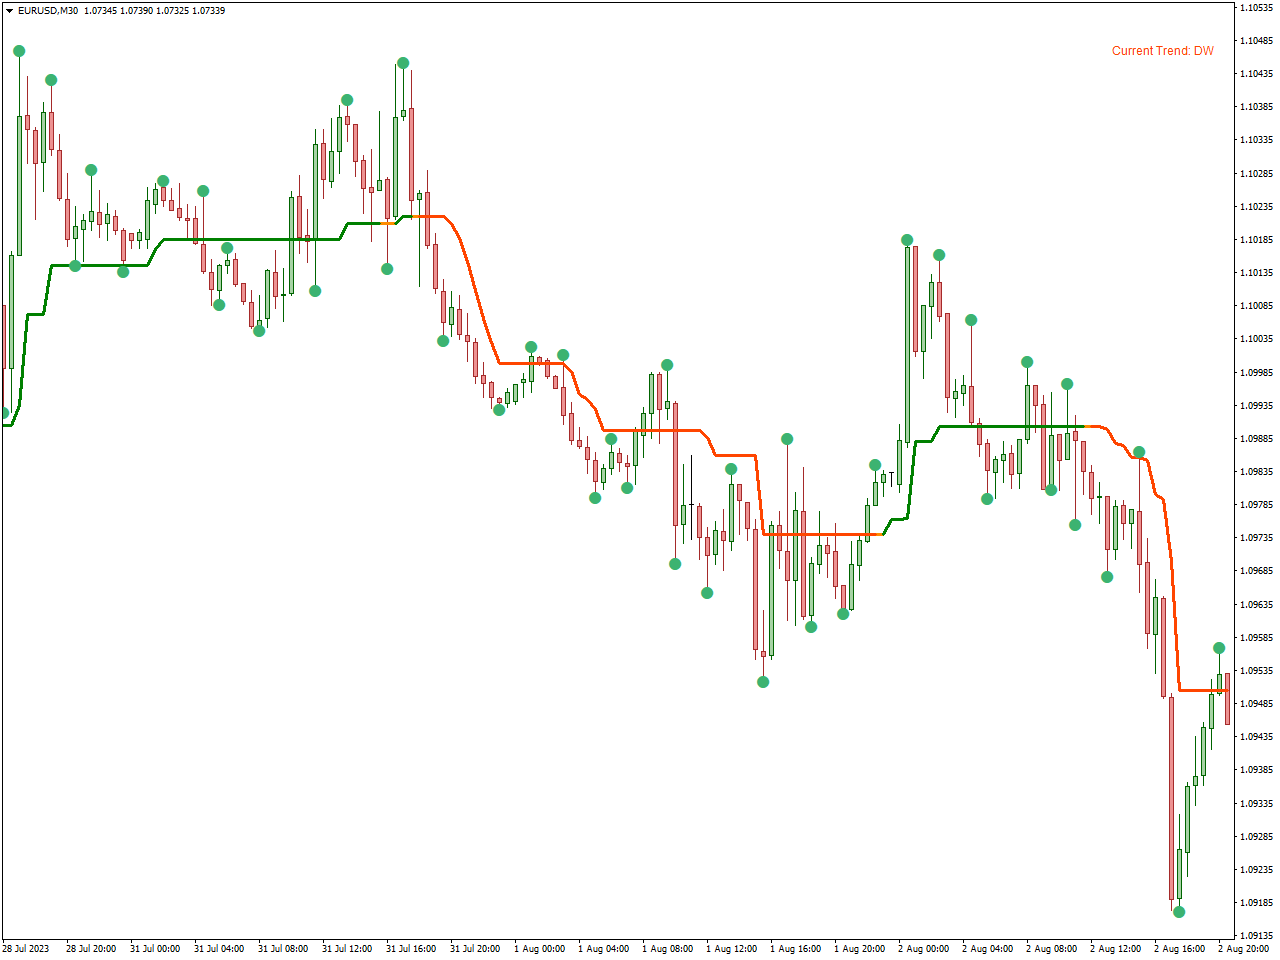
The “3 Bars High Low” indicator, employed in technical analysis, serves as a tool for recognizing specific price patterns determined by the highest and lowest points of the last three bars or candles on a price chart. With a focus on recent price dynamics, the indicator aims to offer valuable insights into potential shifts in market sentiment. Its functionality can be outlined through several key steps.
Firstly, the indicator engages in the identification of highs and lows by scrutinizing the peak and trough prices of the most recent trio of bars or candles. Subsequently, it delves into pattern recognition, searching for particular formations within this sequence. For example, it may seek patterns where the ongoing bar exhibits a higher high and higher low compared to the preceding two bars, signifying an upward trend, or conversely, a lower high and lower low, indicating a downward trend.
Traders in the forex market can initiate a BUY trade when the indicators transition to GREEN, indicating a bullish trend. For optimal outcomes, it is advisable to position the stop loss below the preceding low and set the take profit when the indicator shifts to ORANGE, signifying a flat trend. Furthermore, exiting the trade when the color changes to RED, denoting the emergence of a new trend, proves to be a successful strategy.
Conversely, traders can engage in a bearish trend by entering a SELL trade upon the indicator turning RED. Setting a stop-loss above the previous swing high and targeting the next opposite signal yields favorable results. The indicator’s capability to identify three distinct trend levels—BULLISH, BEARISH, and FLAT—provides valuable assistance to forex traders in strategically planning entry and exit points. Additionally, the incorporation of fractals adds an extra dimension and aids in confirming trade decisions.
FXSSI.OrderBook
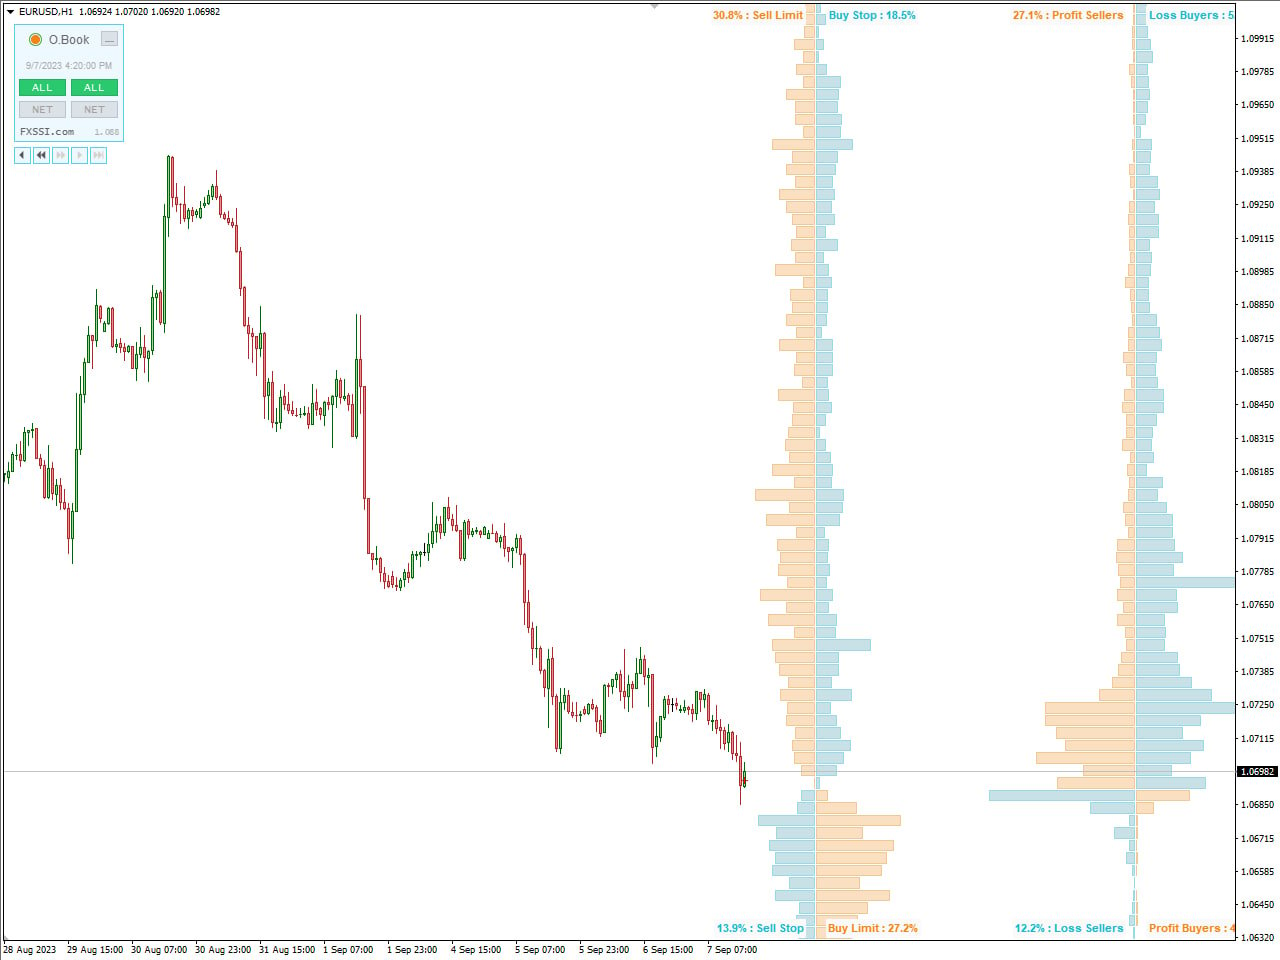
FXSSI.OrderBook stands out as a pivotal trading tool and service within the FXSSI (Forex Sentiment & Volume Analysis) platform. This platform is dedicated to furnishing an array of resources and data to aid traders in navigating the complexities of the foreign exchange (forex) market. Specifically, FXSSI.OrderBook zeroes in on delivering order book data and conducting sentiment analysis for major currency pairs, enriching the analytical toolkit available to forex traders.
The core functionality of the Order Book lies in its provision of insights into the volume and orders present at diverse price levels. This feature facilitates a thorough examination and assessment of historical market dynamics, unraveling the intricate interplay between supply and demand. Furthermore, it unveils the quantity of assets available at each price level, allowing traders to pinpoint areas characterized by significant buying or selling interest. For traders, this information becomes instrumental in crafting nuanced trading strategies, including approaches like scalping or momentum trading that heavily rely on short-term order flow dynamics.
For Buy trades, clusters of sellers’ Stop Losses attract the price, and dominant winning sellers exert an upward pull, while clusters of Buy Limit orders act as support, with dominant losing sellers contributing to pushing the price up. On the other hand, for Sell trades, clusters of buyers’ Stop Losses attract the price, and dominant winning buyers pull the price down, while clusters of Sell Limit orders serve as resistance, and dominant losing buyers push the price down. However, it’s essential to note that the mere presence of, for instance, a cluster of winning buyers doesn’t necessarily signal an immediate need to open a Sell trade. Successful interpretation of these signals requires practice to discern their quality and validity. Trading with the Order Book demands a more in-depth analysis of the market situation, necessitating an understanding of who is attempting to deceive and whom, providing insights to identify potential trading opportunities.
The thoughtful design of FXSSI.OrderBook is aimed at empowering forex traders with a more profound comprehension of market dynamics and trends. This empowerment is achieved by granting access to both real-time and historical order book data, coupled with a robust sentiment analysis component. As a result, traders gain a comprehensive tool that equips them with valuable insights, fostering a more informed approach to navigating the forex market and making strategic trading decisions.
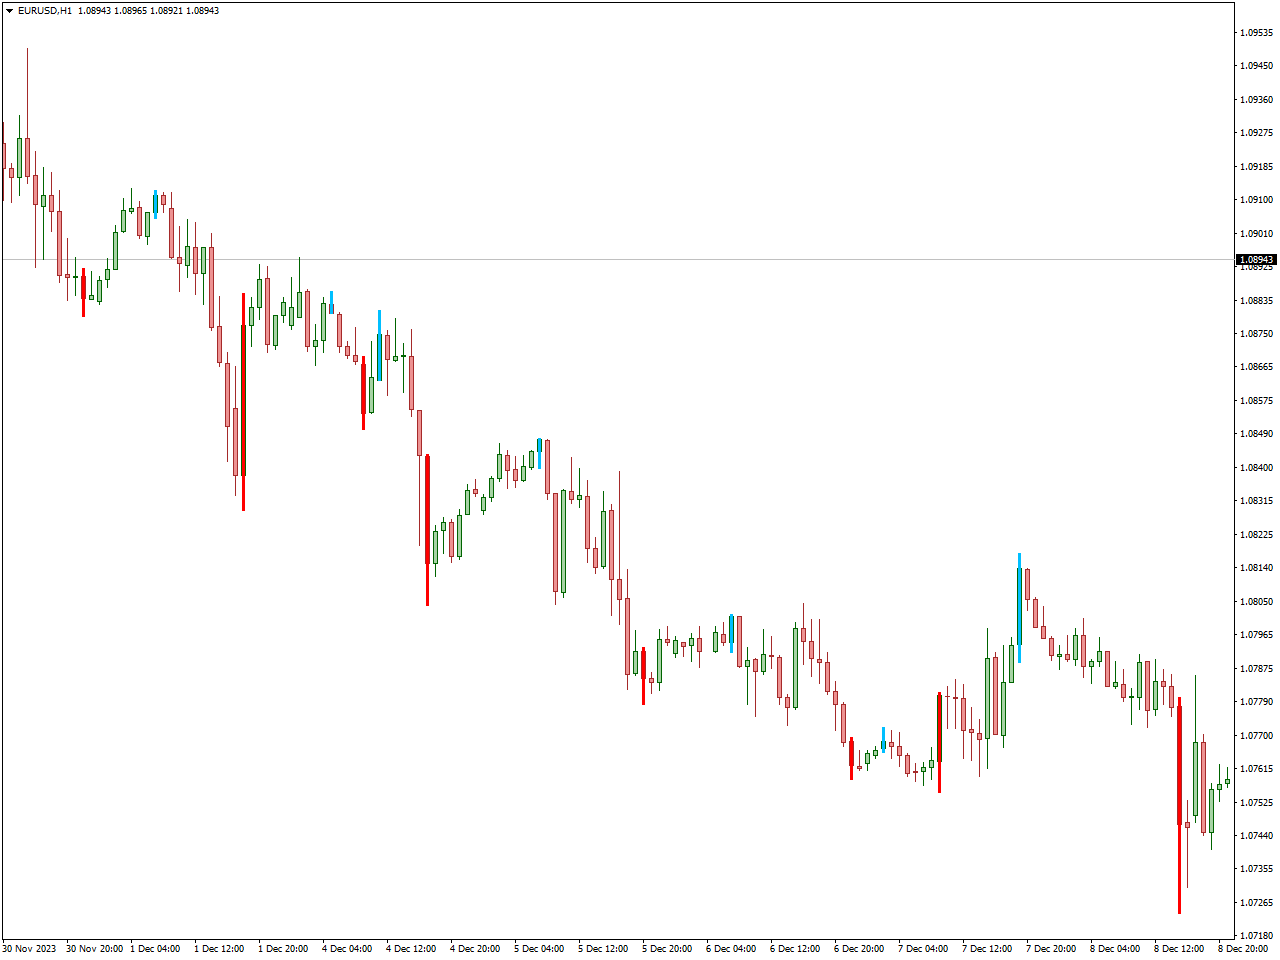
Advanced Trendlines Indicator
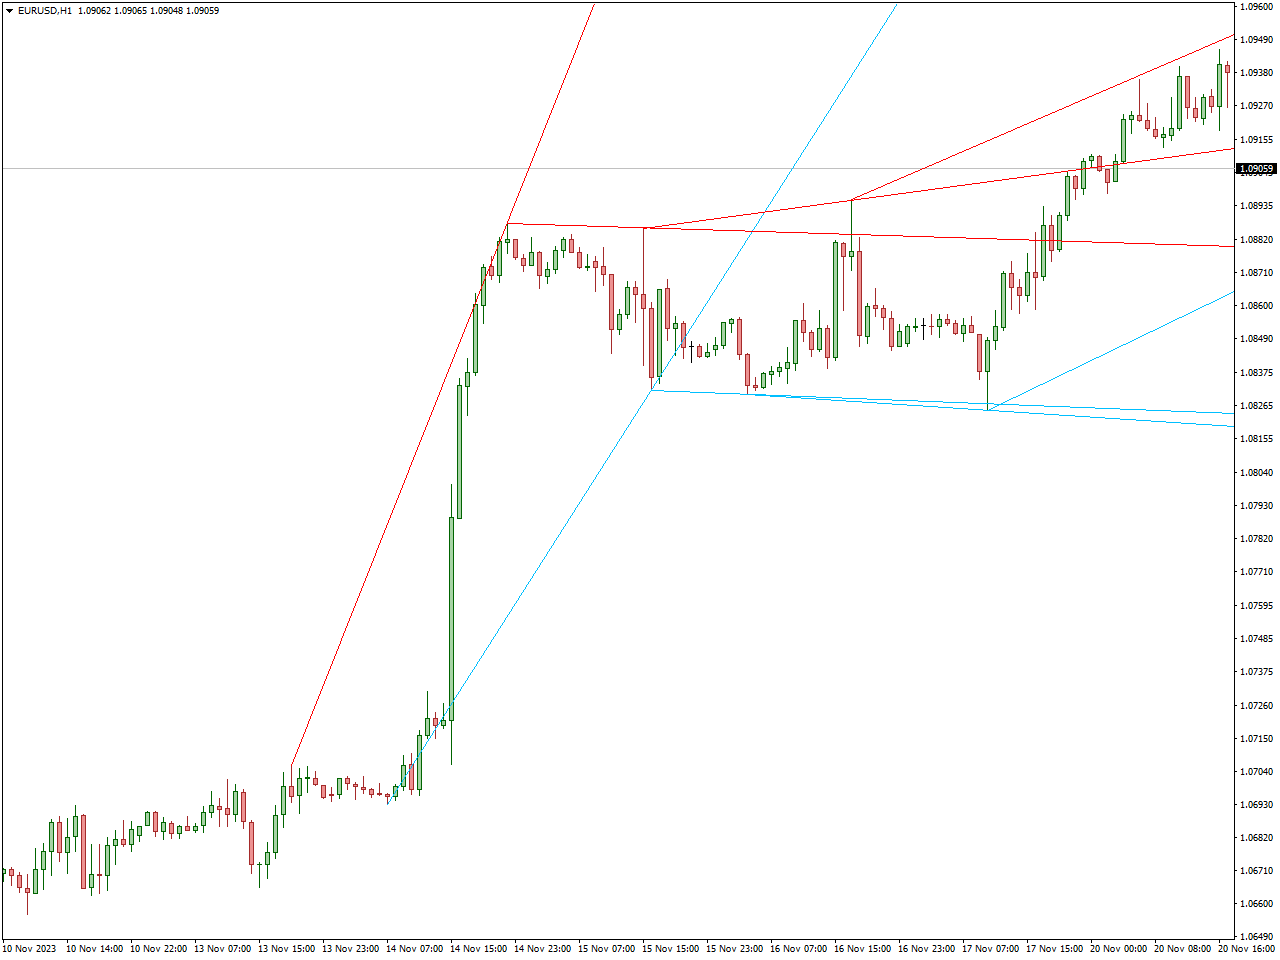
The Advanced Trendlines Indicator is a sophisticated tool in technical analysis, designed to enhance traditional trendline analysis. Geared towards aiding traders in navigating financial markets, this indicator excels in automatically identifying and drawing trendlines on price charts, offering a detailed analysis of market trends. Its advanced version often includes multi-timeframe analysis, allowing traders to assess trends across different time horizons for a more comprehensive perspective.
Adapting dynamically to market conditions, the indicator responds to changes in volatility and trend strength, ensuring accurate reflections of evolving market dynamics. Some versions may also incorporate pattern recognition capabilities, identifying chart patterns like triangles and channels, facilitating the identification of potential trend reversals or continuations. Additionally, the Advanced Trendlines Indicator may automatically identify support and resistance levels, assisting traders in pinpointing crucial price levels where increased buying or selling activity is likely.
The red lines within the Advanced Trendlines Indicator establish connections from a high to either new higher highs or a high to fresh lower highs. When this indicator links a high to a higher high, it indicates that the market is in an uptrend. Conversely, connecting a high to new lower highs signifies a downtrend in the market. In addition, the deep sky-blue lines connect a low to another higher low or a low to new lower lows. Establishing a connection from a low to new higher lows with this indicator signals an uptrend, whereas connecting a low to new lower lows indicates a downtrend. Beyond delineating forming trends on the chart, this indicator facilitates the identification of chart patterns such as rising and falling wedges, ascending and descending triangles, symmetrical triangles, pennants, and more. The Advanced Trendlines Indicator proves to be a valuable tool for both novice and experienced traders, serving as a guide for placing trendlines and executing well-informed trades.
Integration of risk management tools, such as setting stop-loss and take-profit levels directly on the chart, enhances the indicator’s functionality. A user-friendly interface with customization options accommodates individual trading preferences and strategies. Advanced trendline indicators may offer backtesting capabilities, enabling traders to assess historical performance and refine strategies. Real-time alerts keep traders informed of potential trading opportunities, making the Advanced Trendlines Indicator a powerful tool for those seeking a sophisticated approach to trend analysis and informed decision-making in financial markets.
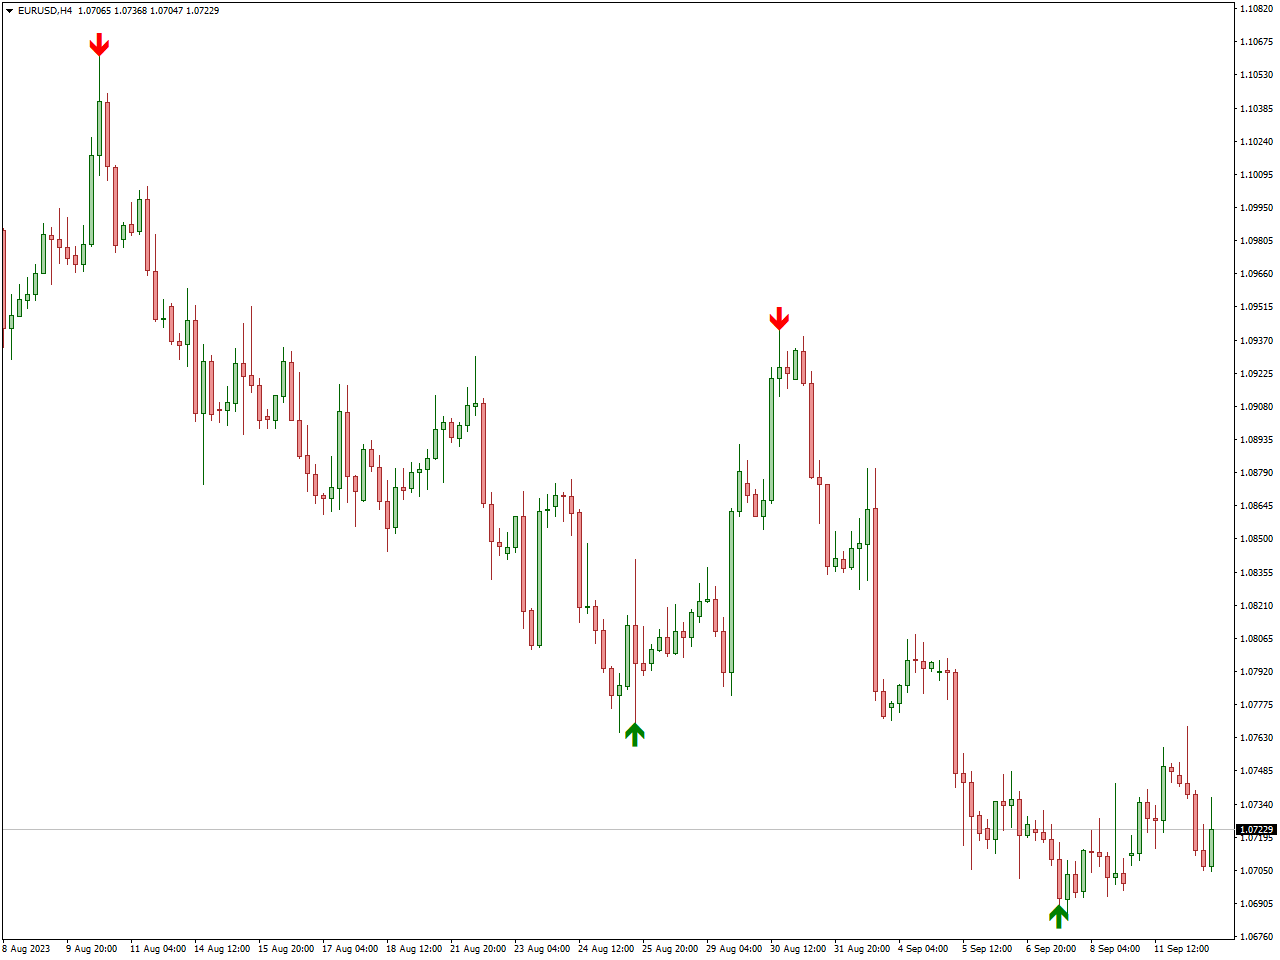
Lucky Reversal Indicator
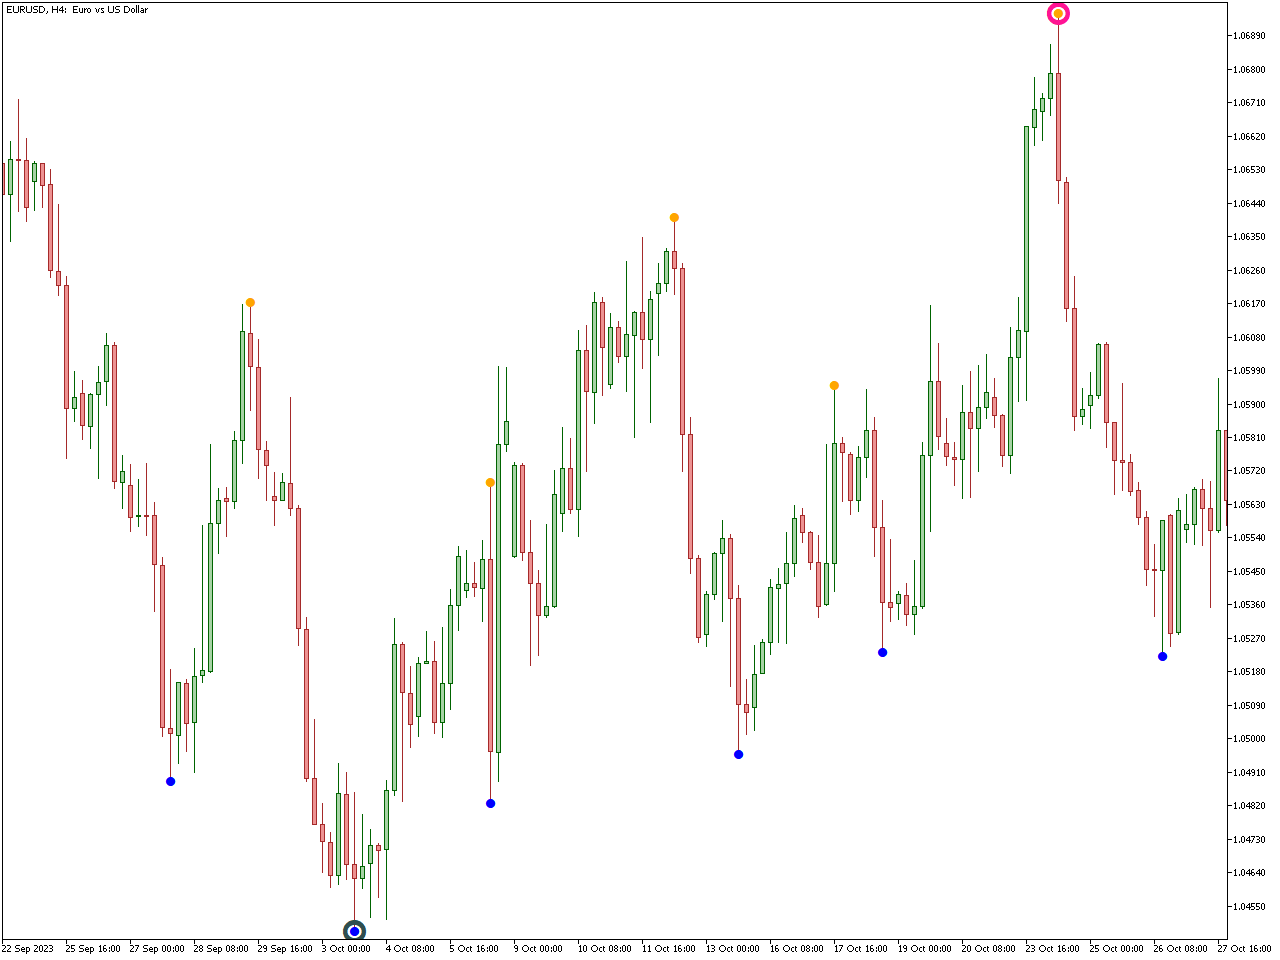
In the Forex market, trend reversals occur regularly, as long as trends persist. Numerous tools and strategies for trading trends and reversals are grounded in this fundamental concept. The key challenge for traders lies in employing the right tools to identify reversals and align their trades with prevailing trends. The Lucky Reversal Indicator is just one among various indicators designed for this purpose.
The primary drawback of the Lucky indicator is its delayed signal, making it challenging to capture reversals effectively. However, it can serve as a valuable tool for confirming trades within emerging trends. For instance, it can be employed to trade an uptrend that follows a market reversal from a downtrend to an uptrend.
The efficacy of the successful reversal indicator distinguishes it from various other trend reversal indicators. This distinction arises from its nature as a lagging indicator, making it challenging for traders to utilize it effectively in trading on reversal breakouts. Many traders have encountered frustration in attempting to employ this indicator for identifying the initiation of a reversal, and their attempts are understandable. Upon backtesting the indicator, it becomes evident that bullish and bearish signals align precisely with the lowest or highest points of major trend reversals. An illustrative example can be observed in the image below, where the price exhibits a reversal shortly after the arrow’s appearance.
FXSSI.ProfitRatio
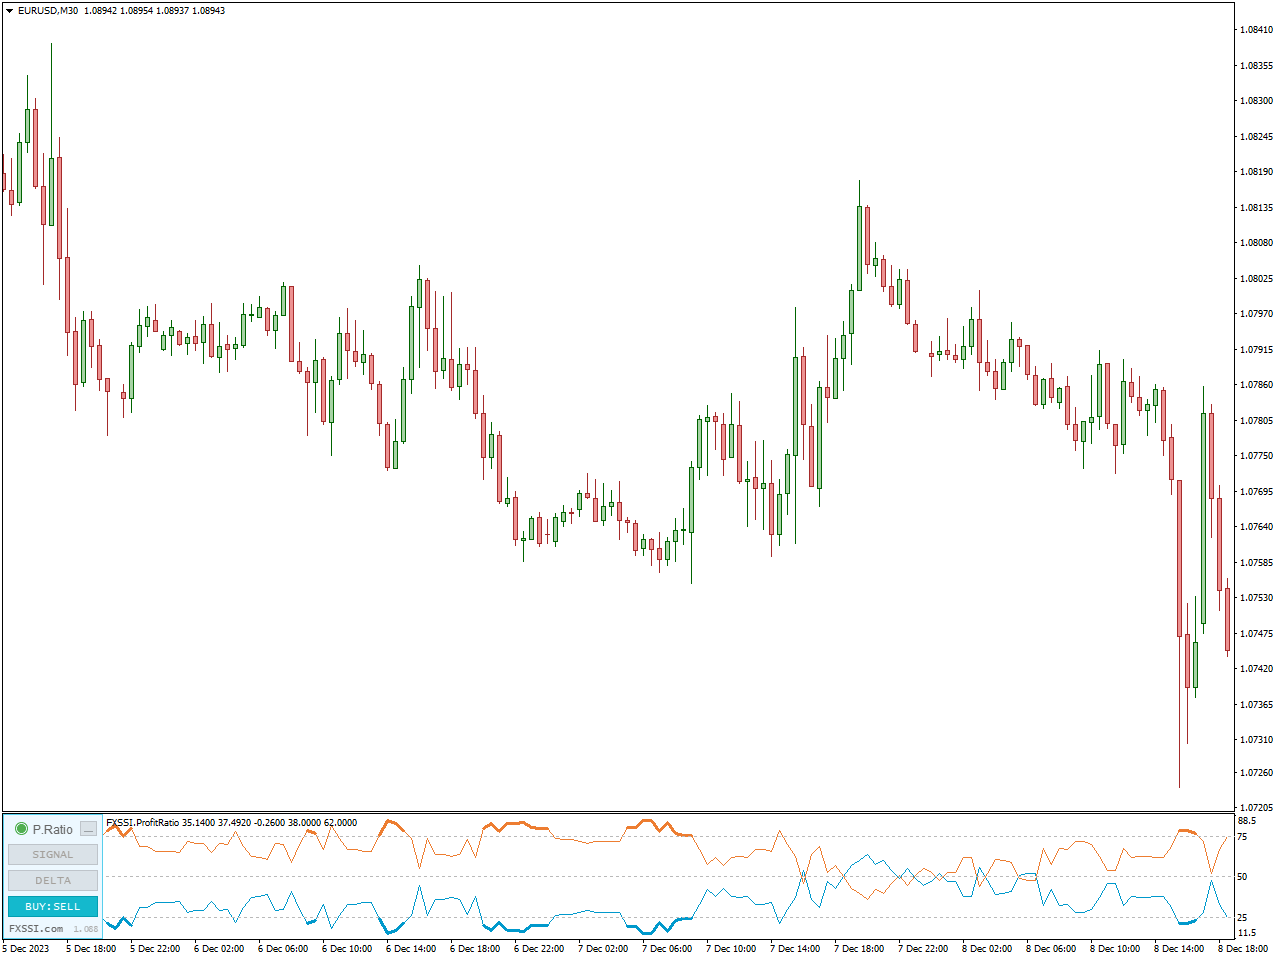
The Profit Ratio indicator provides insight into the ratio of successful trades versus unsuccessful ones within currently open positions. Its primary objective is to detect potential reversal levels before a shift in the opposite direction occurs. Upon careful examination of the price chart, it becomes evident that nearly all market troughs align with signals generated by the Profit Ratio indicator.
When a significant increase in the Profit Ratio is observed over the most recent candlesticks, it suggests that the prevailing movement is misleading, signaling an imminent price reversal.
This observation is in accordance with classical market theory. The underlying idea is that a substantial number of successful traders closing their positions exert pressure on the price, prompting it to move in the opposite direction.
In line with the speculative theory of market behavior, the reversal in price can be explained by the concept that, preceding a major price movement, a prominent market participant initiates a slight maneuver in the opposite direction.
Auto Channel Indicator
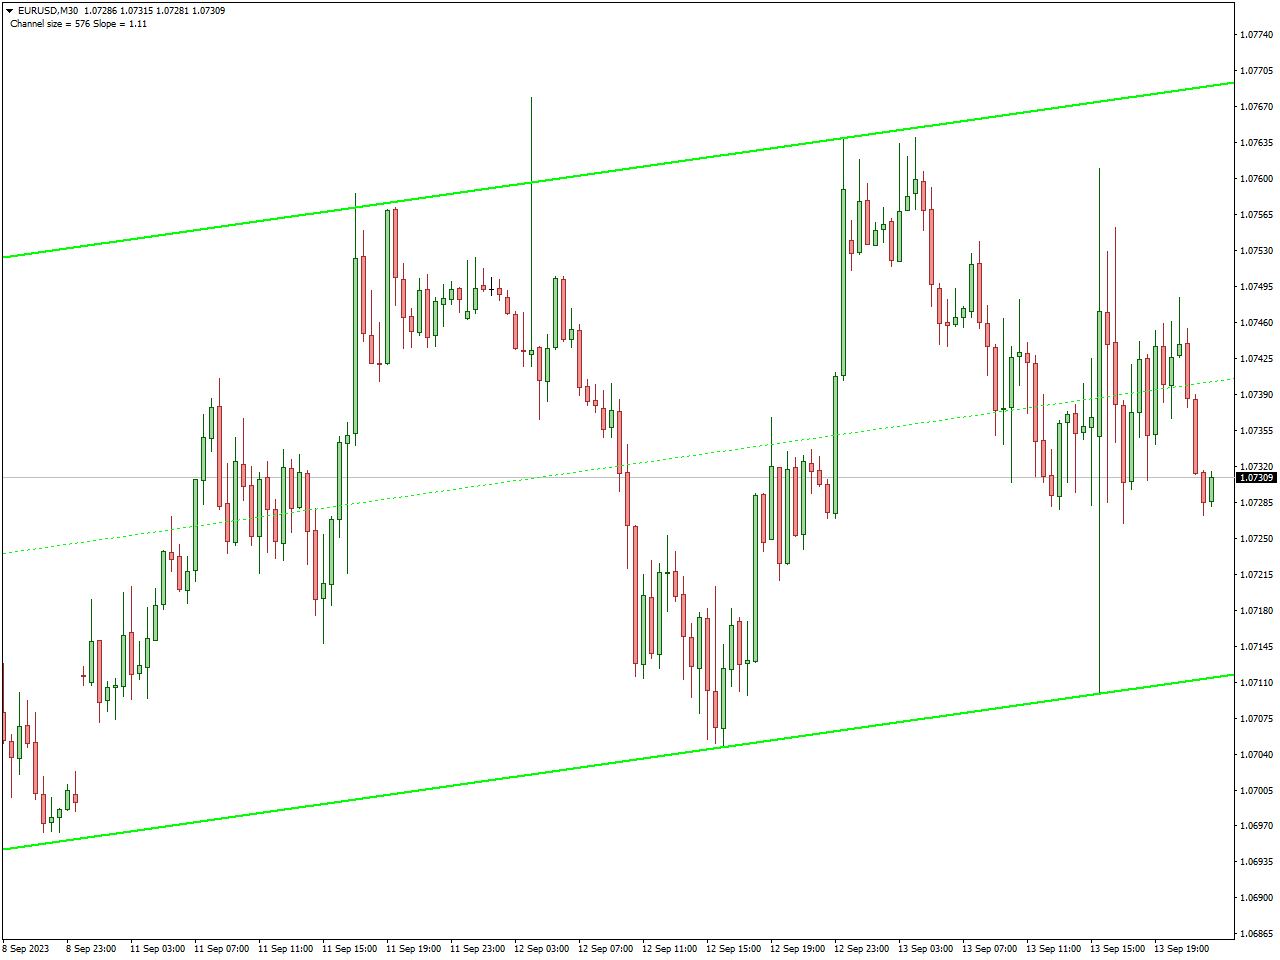
The Auto Channel Indicator functions as an efficient tool within the realm of technical analysis, streamlining the process of automatically identifying and drawing channels on a price chart. These channels, characterized by two parallel lines that encapsulate price movements, serve as indicators of trends or trading ranges. By employing predefined criteria or algorithms, the Auto Channel Indicator eliminates the manual drawing process, offering traders a swift and effective means of visualizing and interpreting market conditions.
A notable attribute of the Auto Channel Indicator is its adaptability to the dynamic nature of market conditions. As fresh price data becomes available, the indicator intelligently adjusts the channels, ensuring continuous relevance and accuracy. This adaptability extends to various channel types, encompassing trendlines, regression channels, and equidistant channels. Traders often have the flexibility to customize the indicator based on their preferences, adjusting parameters such as channel width and sensitivity to align with their specific needs.
In addition to its autonomous channel identification capabilities, the Auto Channel Indicator may incorporate supplementary features to enhance its functionality. This may include integrated alert functionalities, enabling traders to receive notifications when prices interact with or breach a channel. Moreover, the indicator’s compatibility with other technical tools allows traders to seamlessly integrate channel analysis into a broader analytical framework, fostering a more comprehensive understanding of market dynamics.
AutoFib TradeZones Indicator
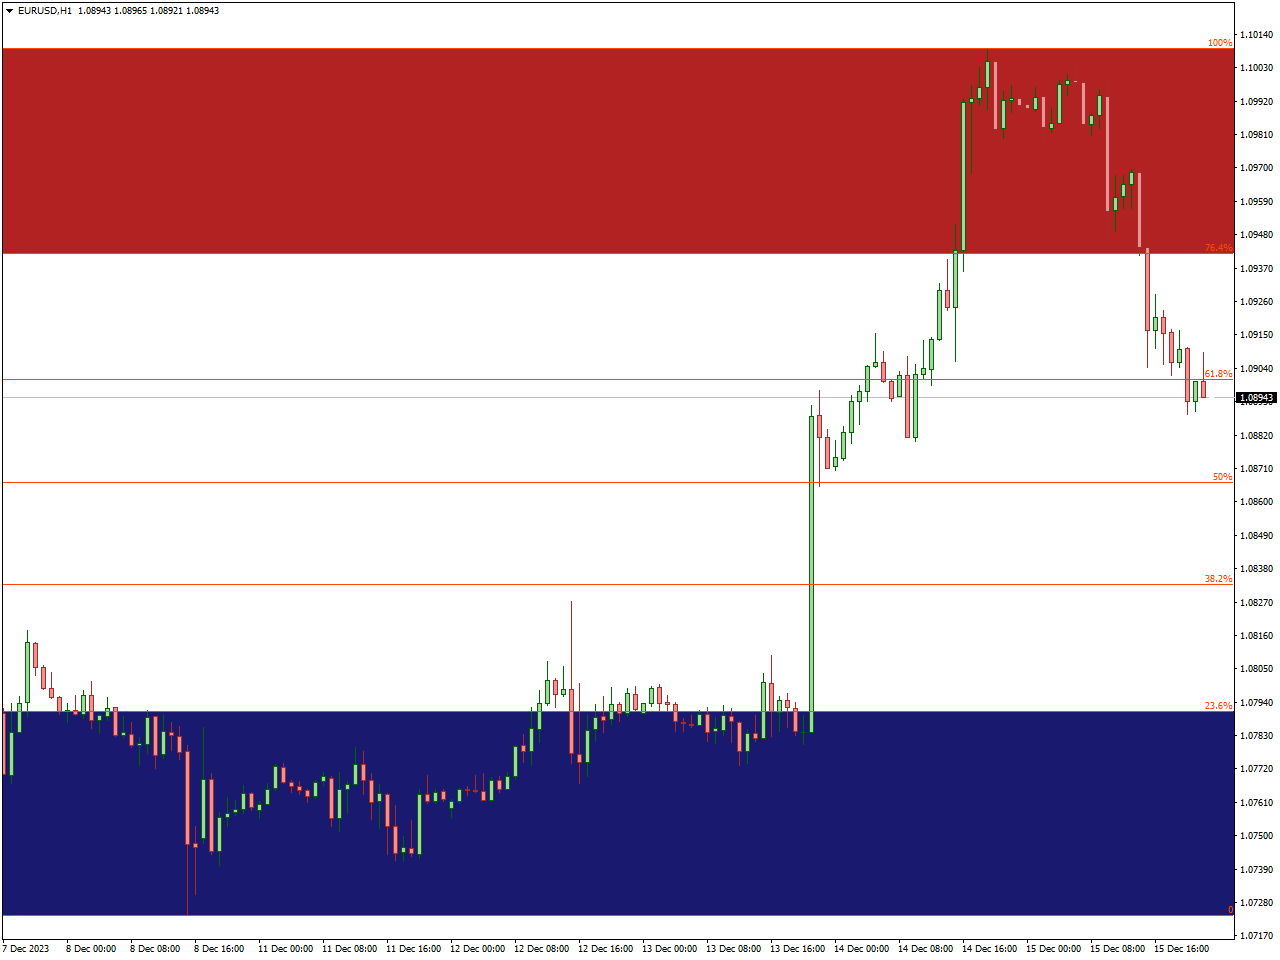
The “AutoFib TradeZones Indicator” seamlessly combines automatic Fibonacci retracement levels with the identification of significant trade zones on a price chart. This indicator, designed for technical analysis, automates the plotting of Fibonacci retracement levels, which are widely used to pinpoint potential support and resistance levels based on key Fibonacci ratios. Simultaneously, it goes beyond traditional Fibonacci tools by delineating specific trade zones on the chart, indicating areas deemed crucial for informed trading decisions.
In practical terms, the indicator offers a visual representation of these Fibonacci retracement levels and identified trade zones directly on the price chart. This visual aid serves as a valuable tool for traders, allowing them to swiftly assess and comprehend potential points of interest for entry, exit, or trade management. The integration of automatic Fibonacci levels with trade zones aims to enhance the precision and efficiency of technical analysis, providing traders with a comprehensive tool to navigate the intricacies of the financial markets.
Traders utilizing the “AutoFib TradeZones Indicator” likely benefit from customization options, enabling adjustments to parameters such as the sensitivity of Fibonacci retracement levels or criteria for defining trade zones. This adaptability empowers traders to tailor the indicator to align with their specific trading strategies and preferences. Additionally, the potential inclusion of alert functionalities allows traders to receive timely notifications when price action interacts with specific Fibonacci levels or enters predefined trade zones, facilitating responsive decision-making in dynamic market conditions.
Reversal Bar Indicator
The Reversal Bar Indicator is a frequently employed tool in technical analysis for recognizing potential shifts in market trends within financial markets. Its primary function lies in identifying a specific type of price bar pattern indicative of a potential reversal in market direction.
Typically, the indicator systematically scans price charts to pinpoint instances of reversal bars. These bars exhibit distinct features suggesting a possible shift in the prevailing trend, often characterized by long tails or wicks that signify rejection of certain price levels. Additionally, reversal bars may conclude in the opposite direction of the preceding trend.
Traders rely on the Reversal Bar Indicator to automate the identification of these significant price patterns. Upon detecting a reversal bar, the indicator may initiate a signal, notifying traders of the potential reversal and prompting them to consider adjustments to their trading strategies accordingly.
Especially beneficial for traders employing trend-following strategies, the Reversal Bar Indicator proves valuable in alerting them to potential turning points in the market. By automating the recognition of reversal bars, the indicator helps traders stay attentive to critical price actions indicating a shift in market sentiment. It’s customary for traders to complement the signals from the Reversal Bar Indicator with additional indicators or analytical techniques to validate signals before making well-informed trading decisions.
Best Agimat Reversal Indicator
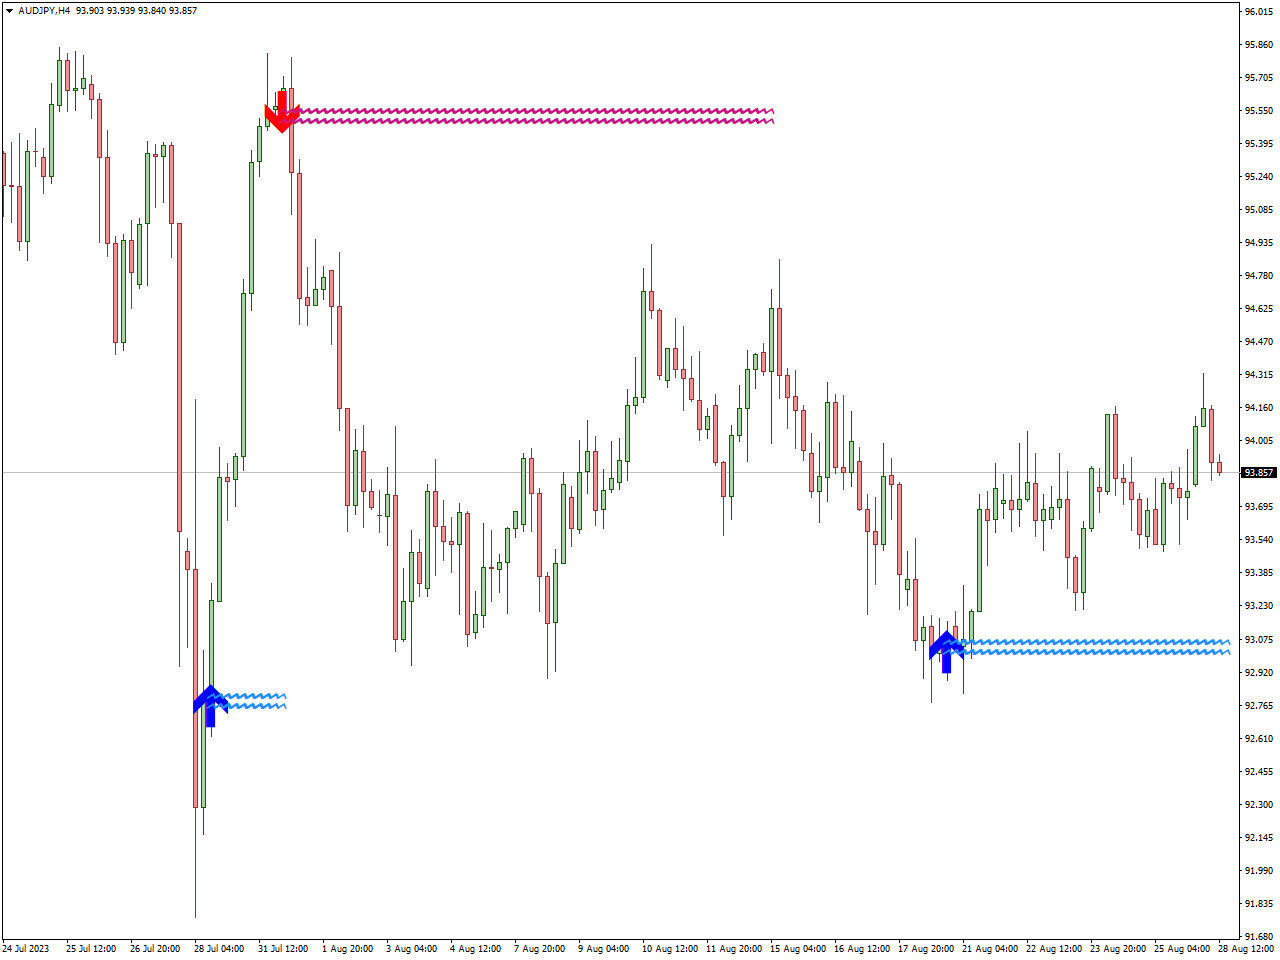
The A-Gimat Reversal Indicator on MT4 delivers highly effective forex trend trading signals through the use of arrow indicators. Its operational principle revolves around identifying zigzag reversal patterns, offering optimal entry and exit points for those engaged in swing trading.
Upon application to the charts, the indicator consistently analyzes bars for their highs and lows. If it detects a new high or low that aligns with the specified indicator parameters, it identifies a reversal point. Subsequently, a signal arrow is strategically placed on the candle or bar, indicating a shift in trend direction, whether from bullish to bearish or vice versa.
When the indicator signals an UP arrow, traders can initiate a BUY order, holding the position until a subsequent arrow indicates a trend reversal in the opposite direction. This approach allows traders to capture the entire trend, maximizing potential profits.
For risk management, placing a Stop Loss at the previous swing low is recommended, while the next reversal arrow serves as an opportune point for taking profits. Traders may exercise discretion in profit-taking based on a balanced risk and reward ratio.
Conversely, the process is reversed for a SELL signal. In essence, the A-Gimat reversal indicator emerges as a highly effective tool for identifying forex trend reversals on MT4, offering traders precise arrow-based signals tailored for trend trading. Its optimal performance is observed in higher time frame charts, making it particularly well-suited for swing trading strategies.
Momentum Reversal Detector Indicator
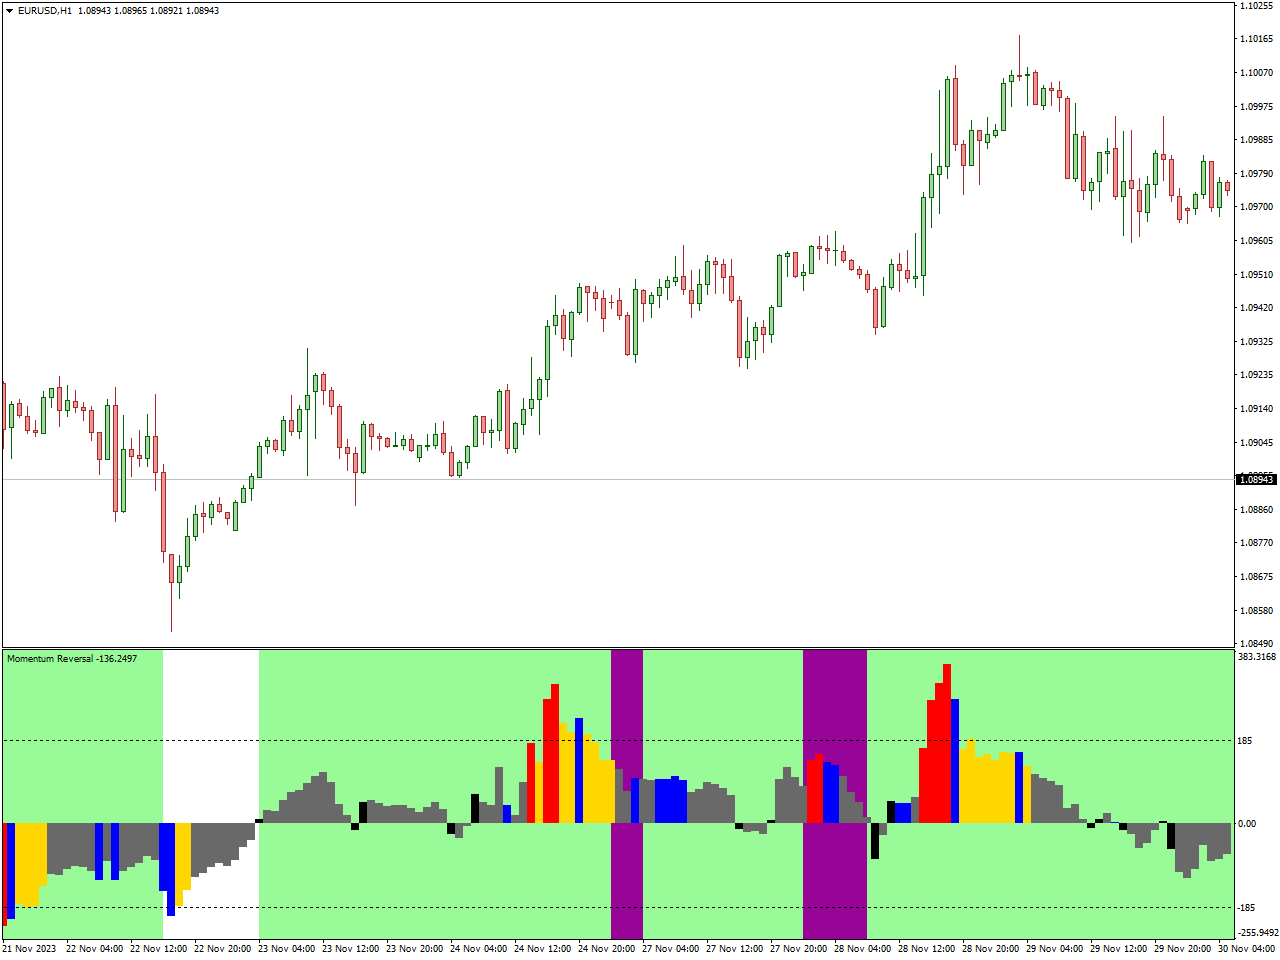
The Momentum Reversal Detector Indicator is a widely employed tool in technical analysis, designed to pinpoint potential alterations in the momentum of a financial asset. Its primary focus is on identifying shifts in the direction or strength of the prevailing market trend, providing traders with valuable insights into potential reversal points.
This indicator functions by scrutinizing the momentum of price movements across a specified timeframe. When a discernible change occurs in the pace of price increase or decrease, the Momentum Reversal Detector endeavors to recognize this shift and signal a potential reversal. Traders leverage this information to make well-informed decisions regarding trade entries or exits.
Upon application to a price chart, the Momentum Reversal Detector continuously observes the speed and intensity of price changes. Detecting a significant shift in momentum prompts the indicator to generate signals or alerts, notifying traders of a potential reversal in the ongoing trend. This timely information empowers traders to adapt their strategies and adjust their positions accordingly.
Traders often integrate the Momentum Reversal Detector Indicator with other technical analysis tools to refine their decision-making processes. Additionally, the availability of customization options allows traders to tailor the indicator’s parameters to align with their specific trading preferences and strategies.
In essence, the Momentum Reversal Detector Indicator stands as a valuable ally for traders seeking to identify momentum shifts indicative of potential trend reversals in the financial markets. By incorporating this indicator into their analytical toolkit, traders aim to anticipate market movements and execute timely and well-considered trading decisions.
Brilliant Reversal Indicator
The MetaTrader Brilliant Reversal indicator is a sophisticated forex technical trading tool designed to scrutinize historical price data and pinpoint potential trend reversal zones for an asset. Through advanced algorithms, the indicator continuously assesses prevailing market conditions against past price data, strategically identifying optimal turning points.
This indicator proves highly effective in anticipating potential trend reversals for an asset, demonstrating a commendable degree of accuracy. It incorporates a user-friendly feature – a green/red signal dot indicating a potential bullish/bearish trend reversal, respectively. Notably, the brilliance of this indicator lies in its non-repainting nature, ensuring that the signals provided remain consistent over time.
User accessibility is a key strength of the Brilliant Reversal Indicator, catering to both novice and intermediate forex traders. Its simplicity facilitates easy identification of potential trend reversal zones. Additionally, advanced traders benefit from the indicator’s ability to streamline technical analysis, offering a hassle-free experience.
Specifically designed for MetaTrader 5, this non-repaint trend reversal indicator excels in highlighting potential reversal zones in price movements. Its versatility extends to various trading styles, including scalping, day/intraday, and swing trading. A notable advantage is that the Brilliant Reversal Indicator for MT5 is available for free download, enhancing its accessibility to a wide range of traders.
MA Rainbow Indicator
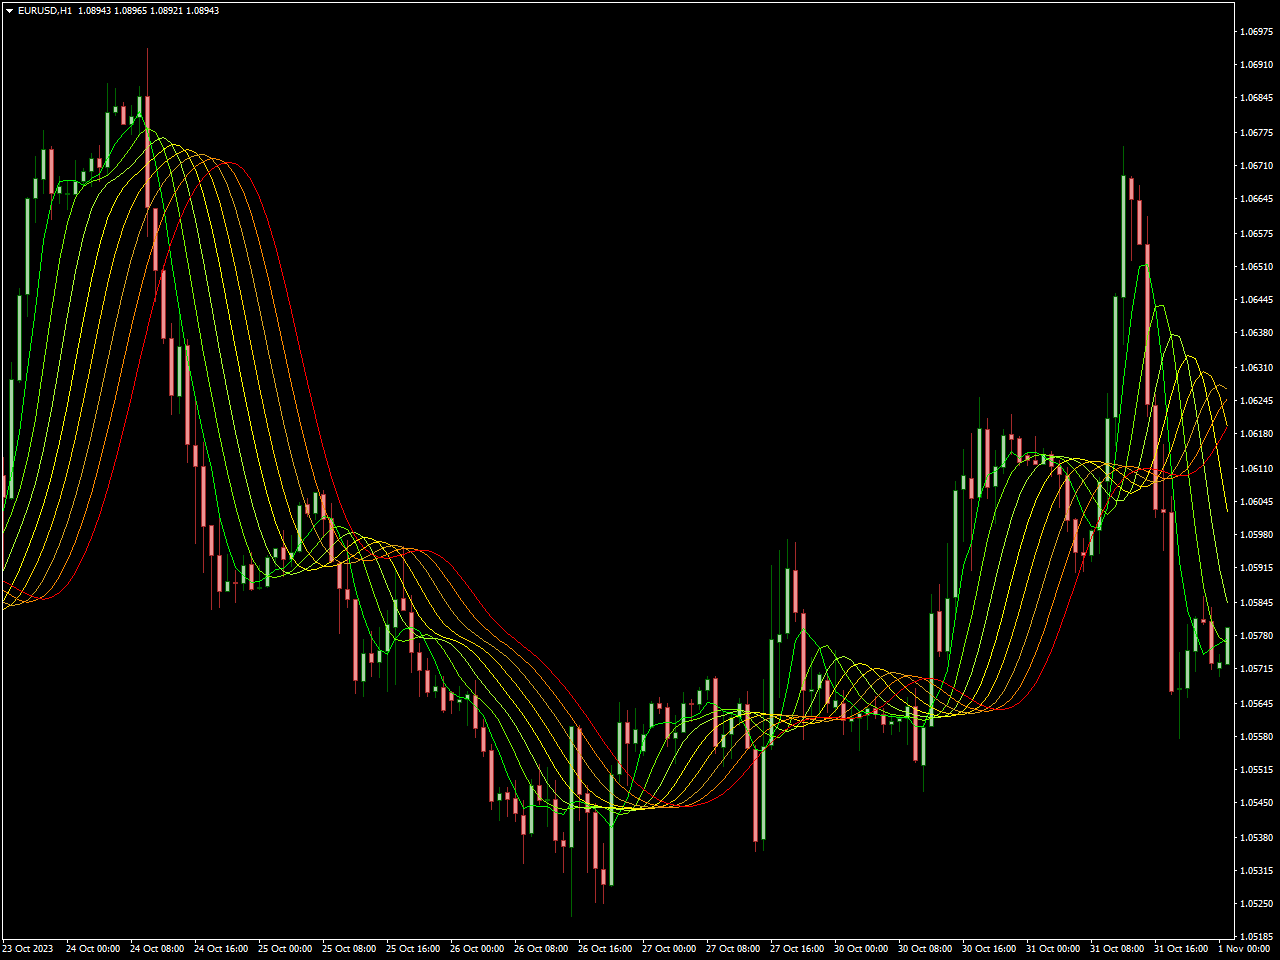
The MT4 MA Rainbow indicator is a compilation of Moving Averages, serving as a valuable tool for forex traders to discern both Bullish and Bearish price trends, along with identifying potential trend reversals. Traders can leverage the signals generated by this indicator for executing BUY and SELL orders. Additionally, it aids trend traders in navigating market movements, allowing them to ride the trend and strategically exit positions at opposing signals. The Moving Averages forming the rainbow configuration effectively act as dynamic support and resistance levels.
When the price concludes a session above the upper Green moving average of the rainbow, it signals the onset of a Bullish trend. Forex technical traders can capitalize on this signal by initiating a BUY trade. Optimal risk management is achieved by placing the stop loss just below the preceding swing low. Trend traders can then follow the trajectory of the trade and exit profitably when presented with a contrasting trading signal.
Conversely, if the price concludes a session below the lower RED moving average of the rainbow, it signifies the commencement of a Bearish market trend. Forex traders can respond by entering a SELL position, setting a stop loss just above the previous high. The most advantageous take-profit point lies at the occurrence of the opposite trading signal.
This indicator’s versatility extends to various timeframes, accommodating intraday charts, as well as daily, weekly, and monthly charts. Forex technical traders can adopt multi-timeframe (MTF) strategies, leveraging the prolonged trends in higher timeframes to make informed decisions for precise entries in lower timeframes.
PZ Reversals Fractals Indicator
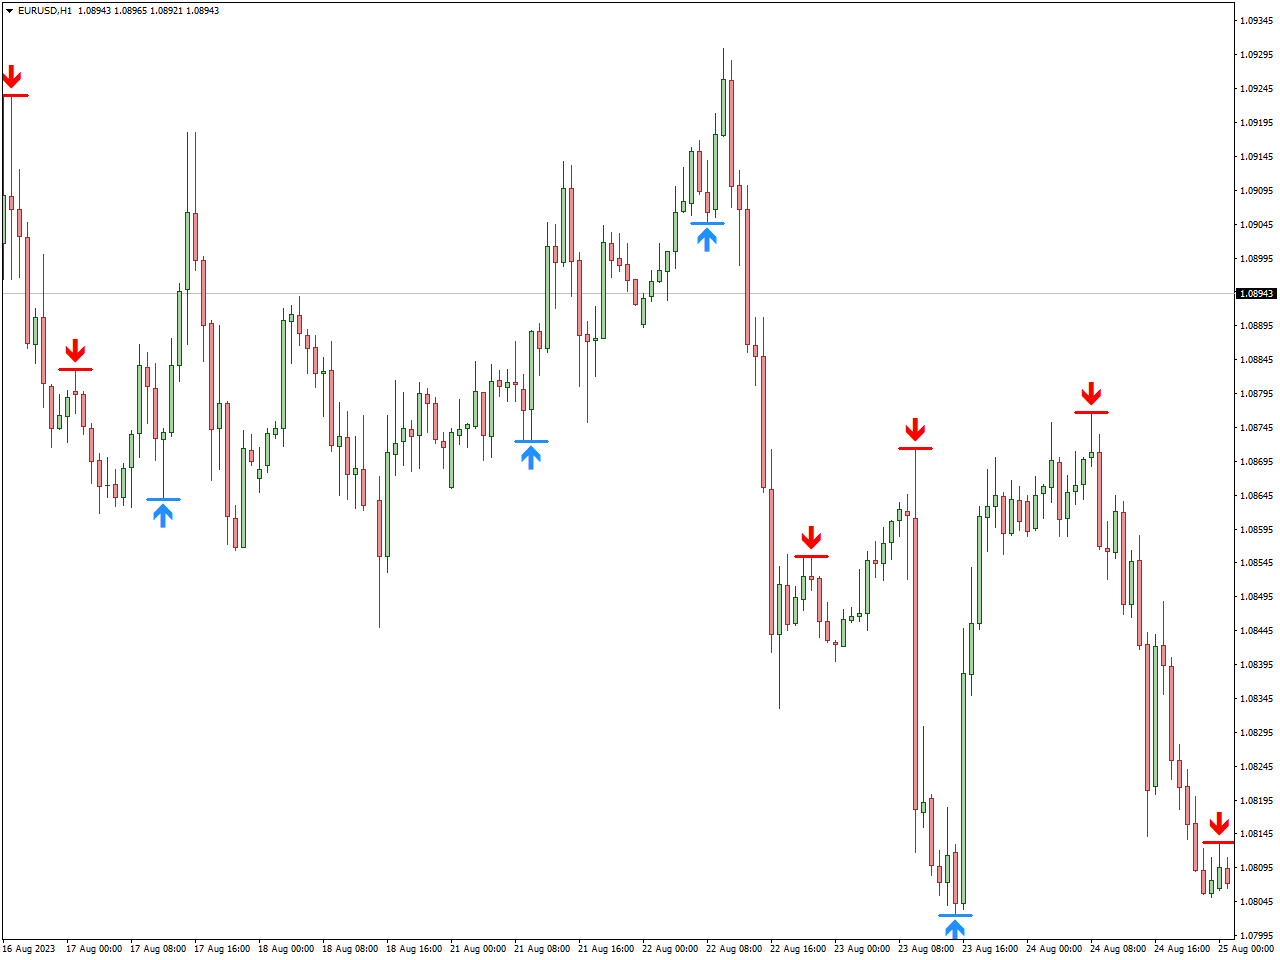
The PZ Reversals Fractals Indicator, designed for MT4, employs arrow plots to signify market reversals. Utilizing fractal analysis, the indicator identifies crucial points of trend reversal, displaying bullish and bearish arrows as the trend undergoes a shift. While the indicator is functional across all timeframes, it is advisable to focus on timeframes exceeding M30 for a more comprehensive understanding of the trend direction.
Operating by scrutinizing fractal patterns, the indicator precisely identifies market reversals. The emergence of a blue arrow signals the potential conclusion of a downtrend, providing an opportunity for traders to consider long positions.
Conversely, a red arrow indicates the potential conclusion of an uptrend, signaling an opportunity for traders to initiate short positions. To enhance signal confirmation, traders can combine the Reversals Fractals Indicator with other indicators.
In essence, the PZ Reversals Fractals Indicator systematically scans fractal formations, pinpointing significant market reversals. By interpreting the directional cues provided by the arrows, traders can strategically enter long or short positions based on the prevailing market conditions.
Conclusion
Mastering the art of trend reversal identification is a key element in the toolkit of successful traders. The diverse range of trend reversal indicators, each with its unique features and benefits, offers traders valuable insights into potential market shifts. Whether you’re exploring MACD Divergence, RSI signals, or other indicators, understanding how to interpret and integrate these tools is essential for making informed trading decisions. By incorporating trend reversal indicators into your strategy, you gain a competitive edge in anticipating market changes and optimizing your trading approach. Stay ahead of the curve with the power of trend reversal indicators at your fingertips.