

In the dynamic arena of financial markets, achieving success relies on the capacity to comprehend and decipher the intricacies of price fluctuations. Momentum indicators emerge as indispensable instruments in a trader’s toolkit, providing valuable insights into the vigor and orientation of market trends. This article delves into the realm of the most effective momentum indicators, investigating their functions, distinctive attributes, and how they empower traders to navigate the constantly changing terrain of trading. Whether you’re a seasoned trader or a newcomer entering the market, assimilating the knowledge of these momentum indicators can serve as the linchpin to attaining precision in your trading approach.
Top 15 Momentum Indicators
- Chande Momentum Oscillator Indicator
- MACD 2 Line Indicator
- Colored Stochastic Indicato
- Commodity Channel Index (CCI) Indicator
- FXSSI.StopLossClusters
- Momentum Indicator
- Average Directional Index Indicato
- Ichimoku Signals Cloud Indicator
- Force Index Indicator
- Support&Resistance
- Ultimate Oscillator Indicator
- Keltner Channel Indicator
- Chaikin Indicator
- Money Flow Index Indicator
- Choppiness Index V2 Indicator
Chande Momentum Oscillator Indicator
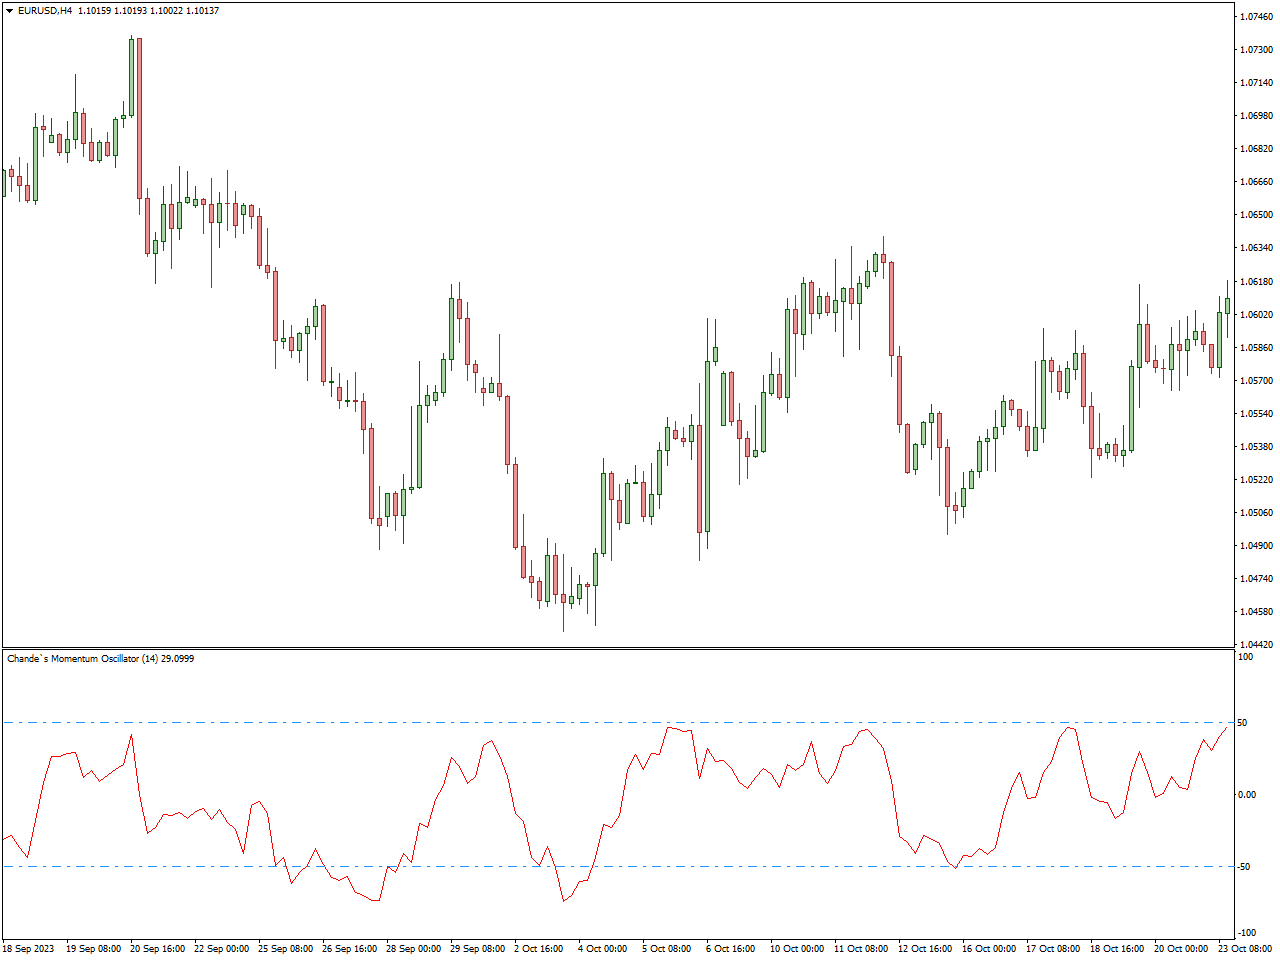
The Chande Momentum Oscillator (CMO) functions as a technical analysis tool crafted to evaluate the momentum within the price movements of a financial instrument. Originating from the work of Tushar Chande, this oscillator is geared towards recognizing overbought and oversold market conditions, aiding traders in anticipating possible shifts in trends.
To derive the Chande Momentum Oscillator, the calculation involves determining the variance between the sum of positive price changes and the sum of negative price changes over a specified timeframe. The outcome is then divided by the sum of positive and negative changes, yielding a percentage value. The oscillator exhibits fluctuations around a central line, typically set at zero, with values spanning from -100% to +100%.
In practical application, an above-zero Chande Momentum Oscillator implies substantial upward price movements, indicating bullish momentum. Conversely, a below-zero reading suggests robust downward price movements, signaling bearish momentum.
Traders frequently deploy the CMO to pinpoint potential trend reversals or divergences between price and momentum. Extreme values on either side of the central line help identify overbought and oversold conditions, offering insights into potential buying or selling opportunities.
MACD 2 Line Indicator
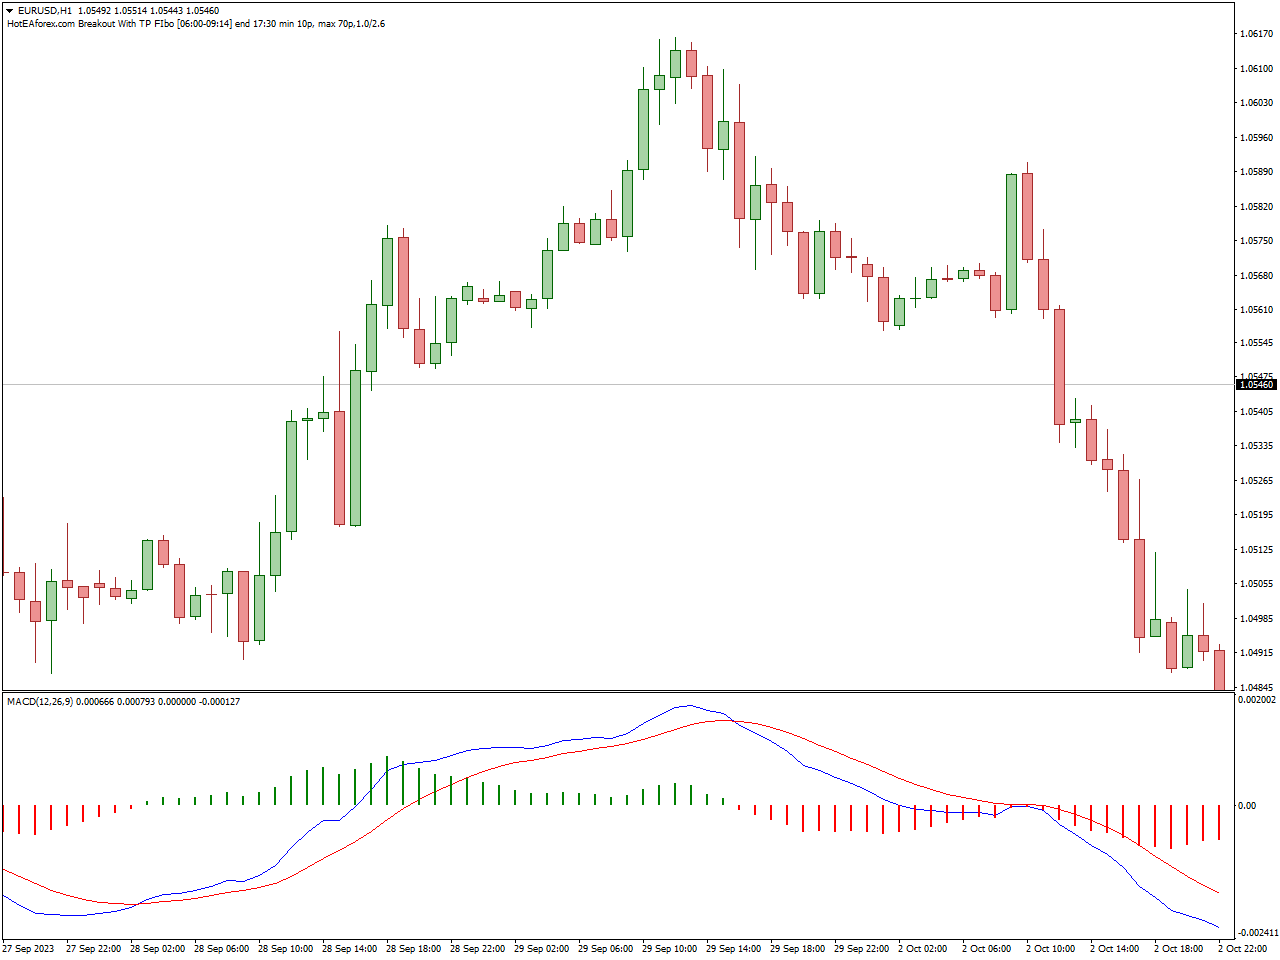
The MACD 2 Line Indicator, also known as the Moving Average Convergence Divergence with two lines, stands as a widely employed tool in financial markets for assessing the strength and direction of trends. Consisting of two lines—the MACD line (fast line) and the signal line (slow line)—this indicator offers insights into potential trend reversals and overall market momentum.
Derived from the variance between two Exponential Moving Averages (EMAs), typically a short-term EMA (fast) and a long-term EMA (slow), the MACD 2 Line Indicator is represented by the MACD line. The signal line, a smoothed average of the MACD line, complements this representation. The accompanying histogram, showcasing the variance between the MACD line and the signal line, facilitates the visualization of momentum shifts.
The interpretation of the MACD 2 Line Indicator involves the scrutiny of crossovers and divergences. A bullish crossover manifests when the MACD line surpasses the signal line, indicating potential upward momentum, while a bearish crossover (MACD line falling below the signal line) suggests potential downward momentum. Additionally, divergences between the MACD line and price movements serve as indicators of trend strength or weakness.
Colored Stochastic Indicator
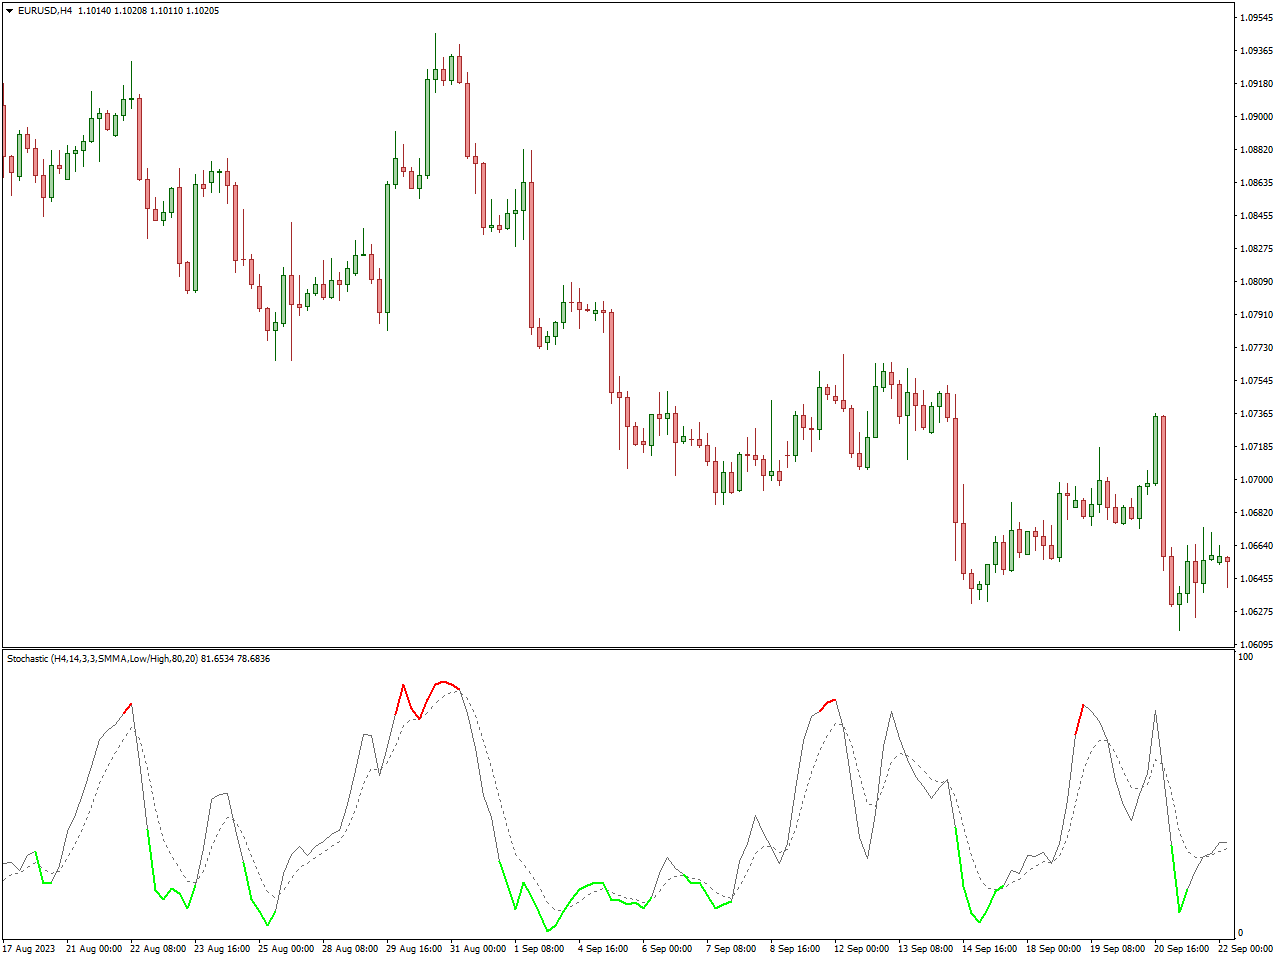
The Colored Stochastic Indicator is a widely utilized tool in financial markets for evaluating the momentum and anticipating potential trend reversals in an asset’s price movements. Serving as a modified version of the traditional Stochastic Oscillator, this indicator incorporates color-coded elements to enhance its visual interpretability.
Similar to the classic Stochastic Oscillator, the Colored Stochastic Indicator assesses the relationship between an asset’s closing price and its price range over a specified timeframe. The introduction of color coding aims to emphasize critical zones, facilitating the identification of overbought and oversold conditions.
Typically, the Colored Stochastic Indicator produces two lines, namely %K and %D, representing the prevailing momentum. The incorporation of color-coded elements often designates overbought conditions with a specific color (e.g., red), indicating a potential downward reversal, while oversold conditions may be marked with another color (e.g., green), suggesting a potential upward reversal.
Traders leverage the Colored Stochastic Indicator to pinpoint potential entry and exit points based on overbought and oversold conditions. A bullish signal may manifest when the indicator resides in the oversold zone, while a bearish signal may manifest in the overbought zone. Furthermore, observations of crossovers and divergences between the %K and %D lines provide valuable insights into potential trend changes.
Commodity Channel Index (CCI) Indicator
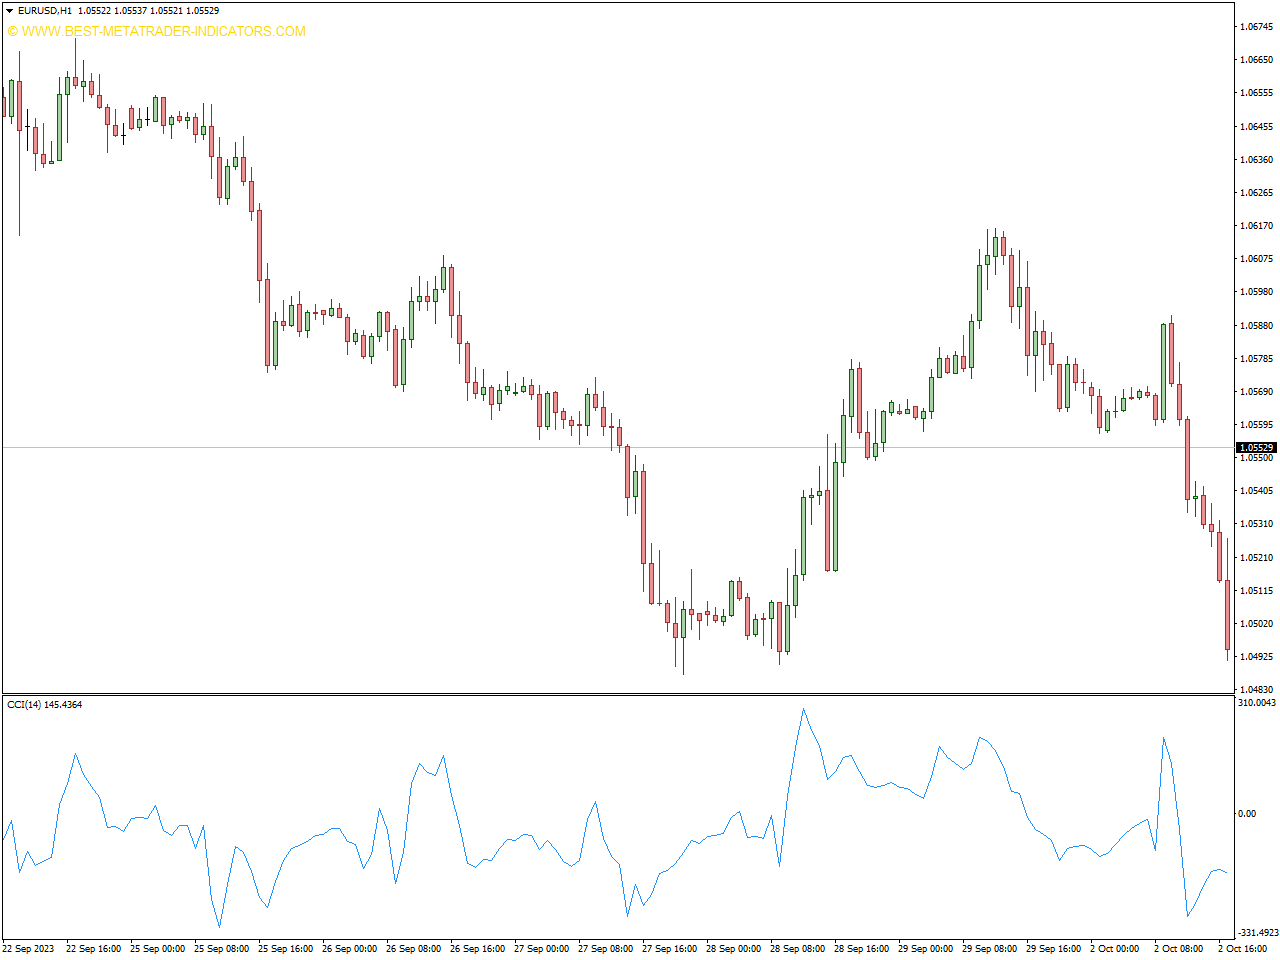
The Commodity Channel Index (CCI) Indicator is a frequently utilized tool in technical analysis, designed to evaluate the momentum of an asset’s price movements and pinpoint potential shifts in the trend. Devised by Donald Lambert, the CCI gauges the divergence of an asset’s price from its statistical average, assisting traders in recognizing overbought or oversold conditions in the market.
Calculated by determining the difference between the asset’s typical price and its simple moving average, divided by a constant multiple of the mean absolute deviation, the CCI’s resulting value oscillates around a centerline, commonly set at zero. Positive values suggest that the price exceeds the average, indicating potential overbought conditions, while negative values imply potential oversold conditions.
Traders employ the CCI to identify potential trend reversals and instances of price levels being overextended. Readings surpassing +100 may indicate overbought conditions, signaling a potential downward reversal, whereas readings below -100 may suggest oversold conditions, hinting at a possible upward reversal.
Furthermore, traders seek divergences between the CCI and price movements, as these divergences can offer insights into the strength or weakness of a trend. It’s essential for traders to integrate the CCI with other technical indicators and analysis methods for well-informed trading decisions.
FXSSI.RoundLevels
The Stop Loss Clusters (SLC) indicator unveils the specific areas where a significant portion of market participants have strategically placed their Stop Loss orders. Within the MT4/MT5 terminal, this indicator visually presents the most noteworthy aggregations of these orders, commonly known as clusters, directly on the price chart. When the price approaches clusters, it accelerates because stop orders begin to trigger.
A cluster, denoting a concentration of Stop Loss orders, is essentially a confined segment along the price scale of an asset, housing a substantial number of such orders from market participants. Typically, these clusters materialize at local highs and lows in price or around key support and resistance levels.
The thickness of the SLC indicator line depicted on the chart is directly proportional to the overall volume of the cluster. This unique feature introduces a third dimension—the cluster volume—to the chart, effectively creating a visual representation akin to a heat map.
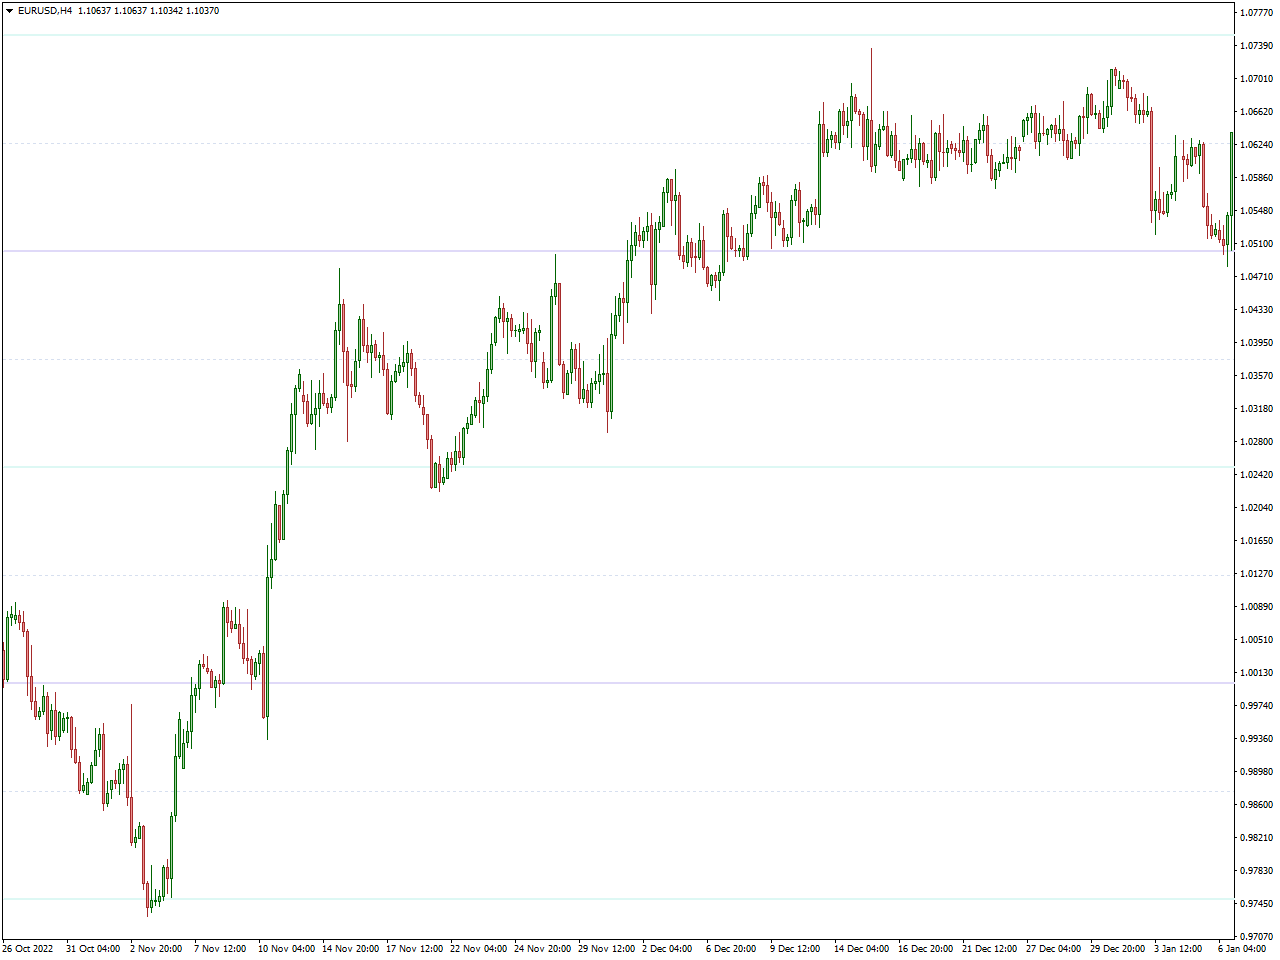
Momentum Indicator

A pivotal tool in technical analysis, the Momentum Indicator plays a crucial role in assessing the velocity and force behind the price movements of a financial asset. Its primary function is to assist traders in pinpointing potential shifts in trends, identifying conditions of overbought or oversold markets, and gauging the overall strength of a market trend.
The Momentum Indicator derives its values by comparing the current closing price of an asset with its closing price over a specified historical period. The resulting values, whether positive or negative, serve as indicators of recent price changes. Positive values signify upward momentum, while negative values suggest a downward shift.
Traders frequently leverage the Momentum Indicator to make well-informed decisions regarding optimal entry and exit points. Elevated positive values may signal a robust upward trend, while diminished or negative values could indicate a weakening trend or a possible reversal. Furthermore, observing divergences between the Momentum Indicator and price movements provides valuable insights into the underlying strength of a trend. In summary, this indicator equips traders with essential information to navigate the intricate dynamics of financial markets.
Average Directional Index Indicator
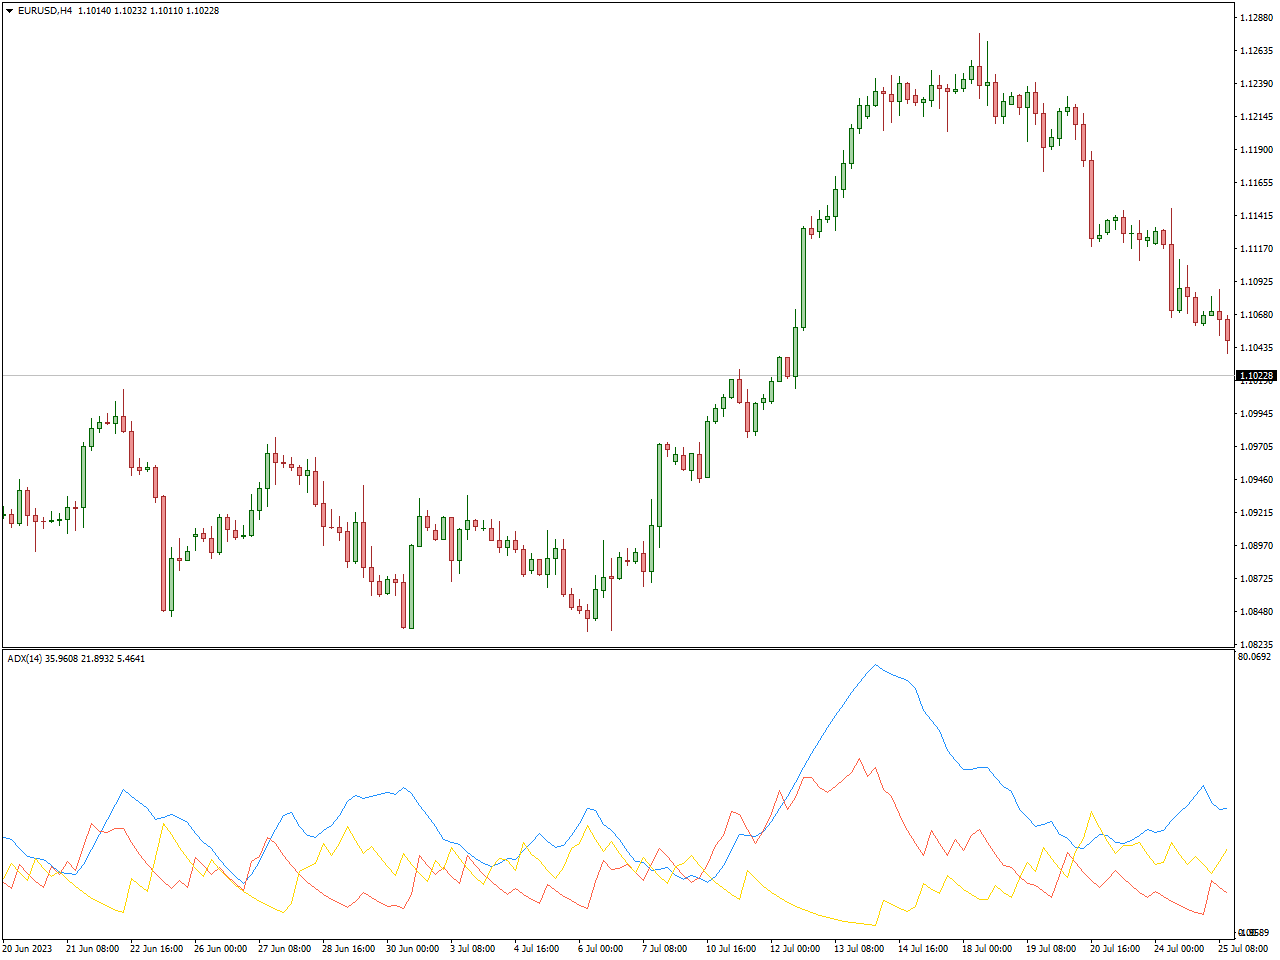
The Average Directional Index (ADX) is a pivotal instrument in the realm of technical analysis, assisting traders in gauging the intensity and potential persistence of a price trend in financial instruments. Conceived by J. Welles Wilder, this indicator is highly esteemed for its knack in revealing the strength of an ongoing trend.
Derived from the difference between the Plus Directional Indicator (+DI) and the Minus Directional Indicator (-DI), and refined through smoothing methods, the ADX furnishes a numeric reading spanning from 0 to 100. Elevated ADX figures signify a robust trend, whereas diminished values hint at a subdued or non-existent trend.
Market participants frequently leverage the ADX to ascertain the momentum of a trend and discern whether the market is in a trending phase or undergoing consolidation. A reading surpassing 25 is commonly perceived as a sign of an emerging trend, with figures eclipsing 50 pointing to a particularly forceful trend. Moreover, in tandem with the +DI and -DI, the ADX aids traders in pinpointing trend trajectories and potential pivot zones.
Ichimoku Signals Cloud Indicator
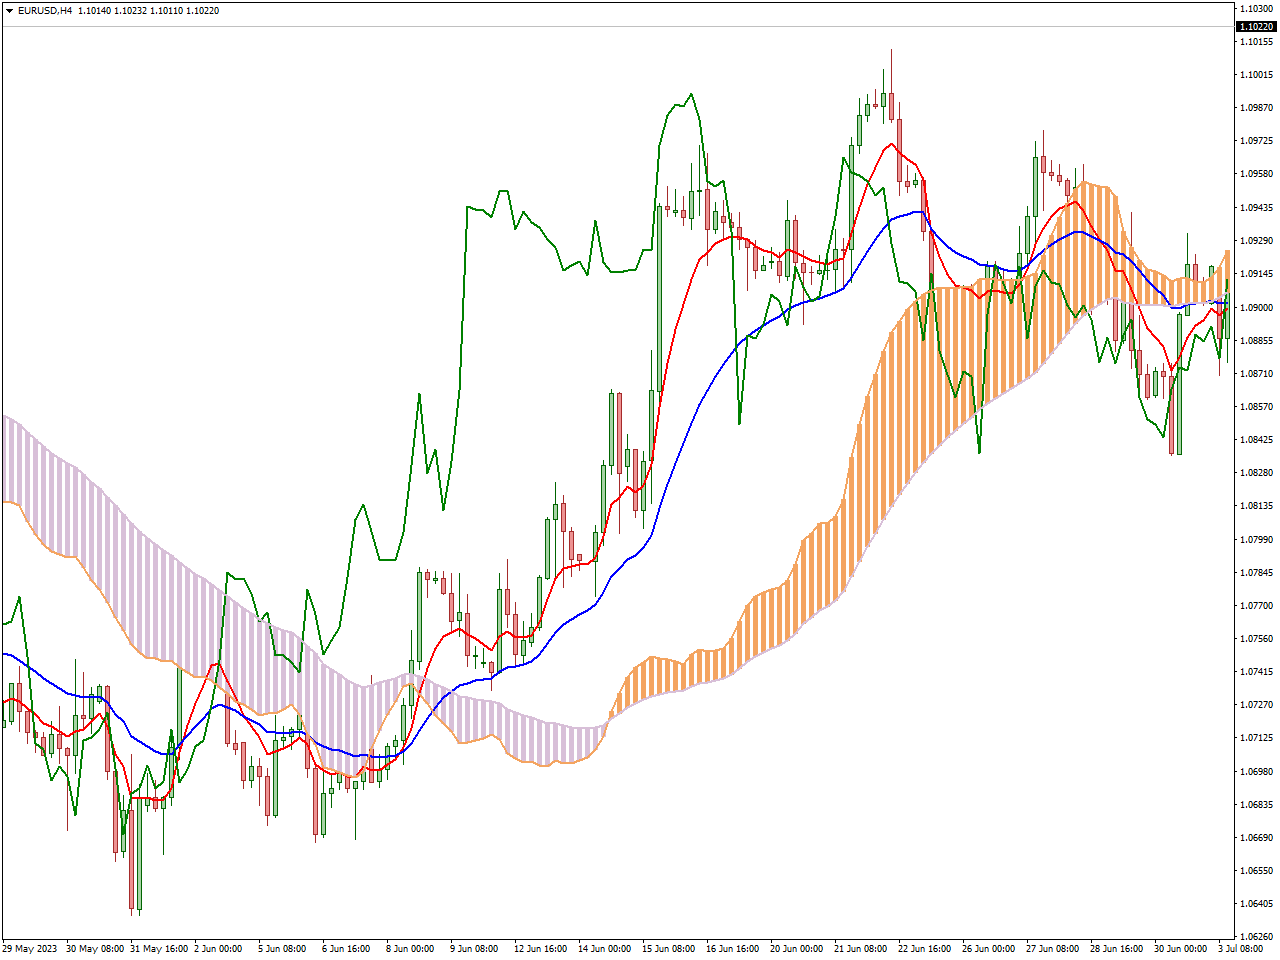
The Ichimoku Signals Cloud Indicator, also known as Ichimoku Kinko Hyo, stands as an encompassing tool in technical analysis, offering a comprehensive view of a financial instrument’s potential trend direction, support and resistance levels, and overall momentum. Crafted by Goichi Hosoda, this indicator is esteemed for its multi-dimensional methodology in analyzing market conditions.
The Ichimoku Signals Cloud comprises distinct components, each contributing unique insights into market dynamics. The Tenkan-sen (Conversion Line) and Kijun-sen (Base Line) play roles in trend identification and potential reversals. The Senkou Span A and Senkou Span B create the Cloud, functioning as dynamic support and resistance levels. The Chikou Span (Lagging Span) trails behind the current price, offering a historical viewpoint. Additionally, the Kumo (Cloud) visually represents potential future support and resistance areas.
Traders leverage the Ichimoku Signals Cloud to generate buy or sell signals based on the interactions between these components. For instance, when the price surpasses the Cloud, it signifies a potential bullish trend, and conversely, when below, a bearish trend may be indicated. Crossovers and divergences among the various lines provide valuable insights into prevailing market conditions.
Force Index Indicator
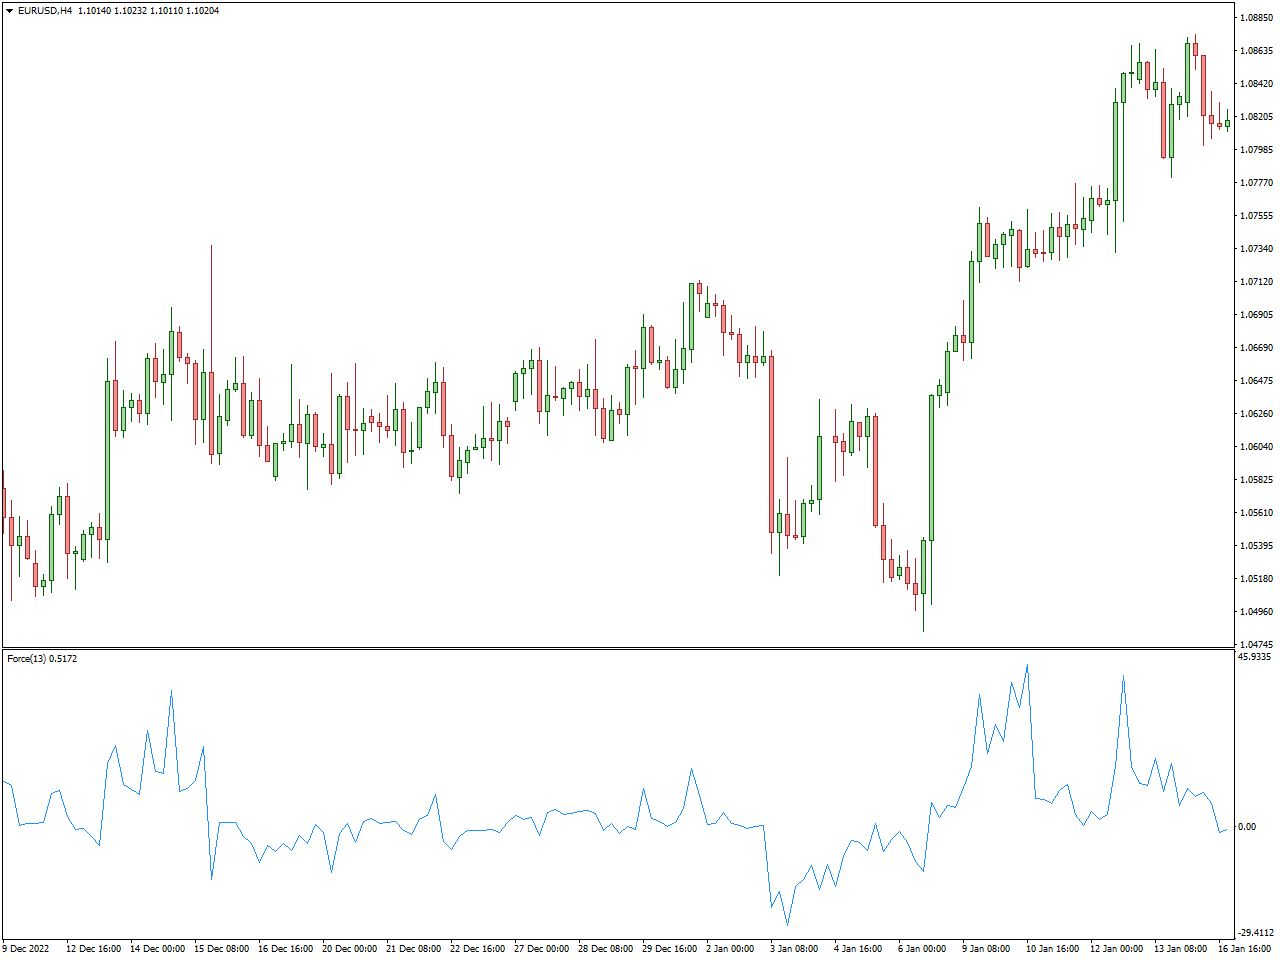
The Force Index Indicator stands as a valuable tool in the realm of technical analysis, aiding traders in assessing the strength and momentum underlying the price movements of financial assets. Devised by Alexander Elder, this indicator is designed to offer insights into market trends, potential reversals, and the overall strength of the market.
The calculation of the Force Index involves multiplying the daily price change by the daily volume, resulting in a running total. This cumulative total assists traders in pinpointing periods characterized by robust buying or selling pressure. Positive Force Index values signify bullish momentum, while negative values indicate bearish momentum.
Traders commonly leverage the Force Index Indicator to validate trends and pinpoint potential entry or exit points. Noteworthy shifts in the Force Index can serve as signals for the commencement of new trends or the indication of potential reversals. By seamlessly integrating this indicator into their analytical toolkit, traders can enhance their comprehension of the forces propelling price movements, enabling them to make well-informed decisions in the financial markets.
Support&Resistance
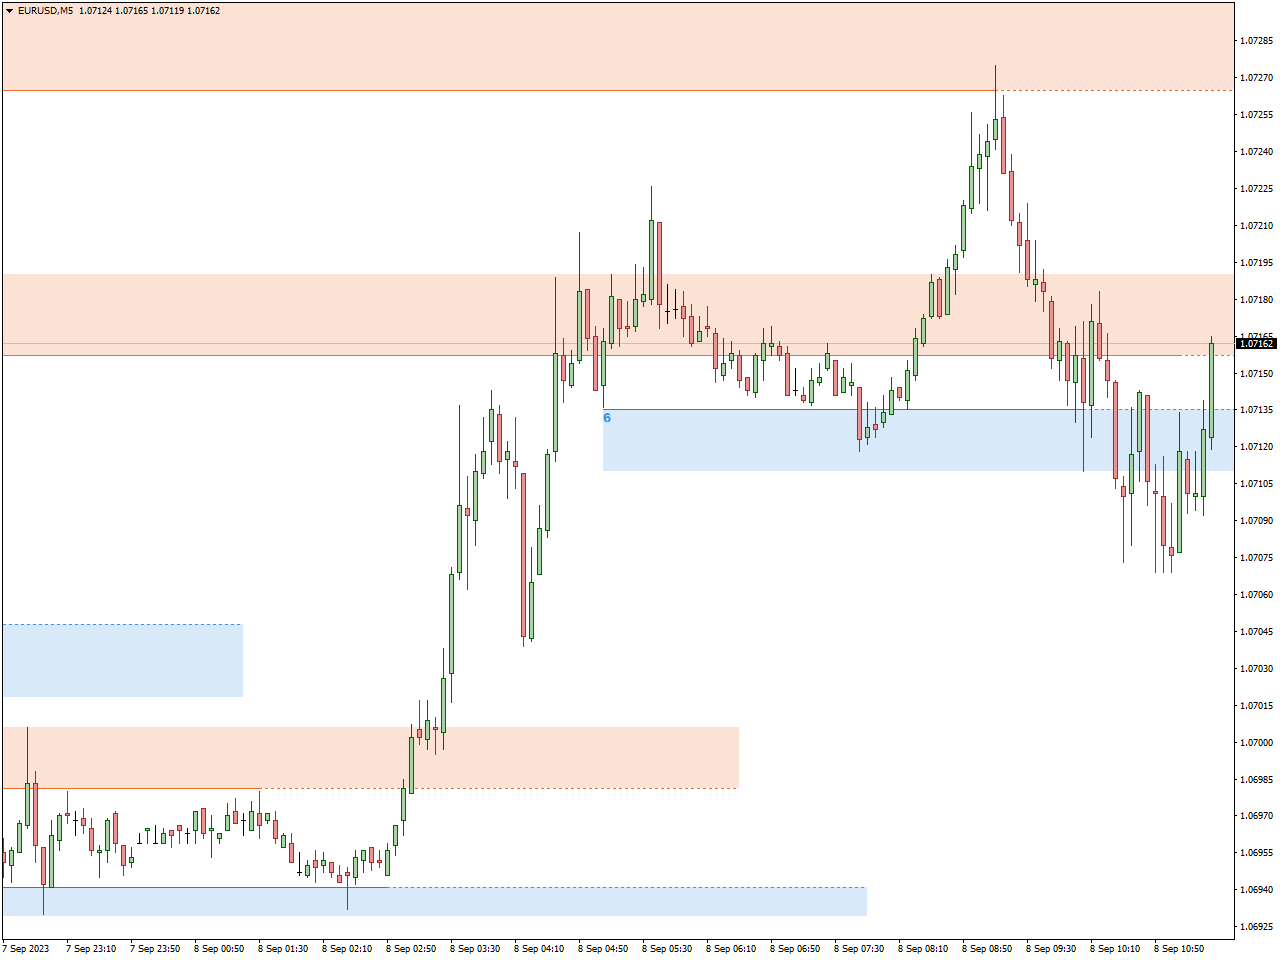
The primary objective of the Support&Resistance Indicator is to enhance a trader’s daily trading activities by autonomously identifying levels at which the price has actively interacted before and illustrating them on both MT4 and MT5 charts as rectangular areas. These areas are delineated based on the spread between price highs and lows that the level traverses, determining the height of the support or resistance.
Distinctively, resistance levels are denoted in orange, while support levels are designated in blue. Importantly, the Support&Resistance indicator is characterized by its non-repainting nature, ensuring reliability in its depictions. It’s worth noting that the occurrence of new highs or lows within the range of a specific support or resistance has the potential to expand the height of these levels.
Traders can leverage three major techniques when trading with robust support and resistance levels, including rebound or bounce from a level, level breakout, and retest of the broken level. These techniques are particularly advantageous due to their simplicity, making them accessible even for novice traders looking to incorporate effective strategies into their trading endeavors.
Ultimate Oscillator Indicator
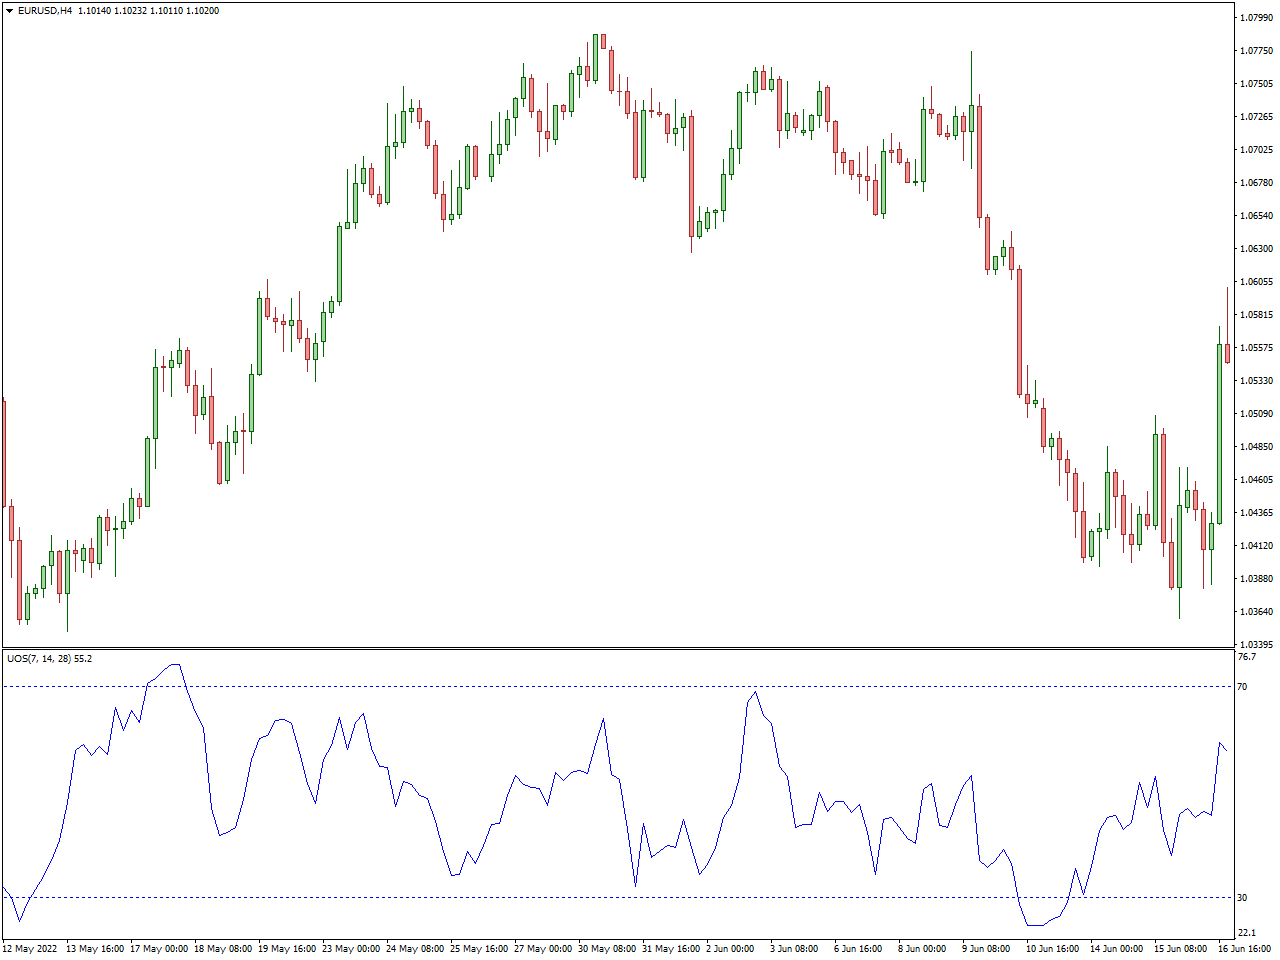
The Ultimate Oscillator, conceived by Larry Williams, stands as a prominent tool in technical analysis, offering traders insights into a financial asset’s momentum and the likelihood of trend reversals. This oscillator stands out by integrating data from multiple timeframes, including short, intermediate, and long-term periods, providing a holistic perspective on prevailing market conditions.
To derive its values, the Ultimate Oscillator calculates a weighted average of the three distinct timeframes, aiming to capture the dynamics of buying or selling pressure across varied time horizons. With values typically ranging between 0 and 100, readings surpassing 70 suggest overbought conditions, indicating a potential downward reversal, while values below 30 signify oversold conditions, hinting at a potential upward reversal. Traders often seek divergences between the oscillator and price movements to spot potential shifts in the prevailing trend.
A notable feature of the Ultimate Oscillator lies in its capacity to smooth out market fluctuations, offering a more stabilized indication of prevailing conditions. Traders commonly leverage this oscillator to confirm existing trends, identify potential reversals, and generate buy or sell signals based on overbought or oversold conditions. As with any technical tool, it is imperative for traders to complement the Ultimate Oscillator with other analytical methods and consider broader market factors for well-informed decision-making.
Keltner Channel Indicator
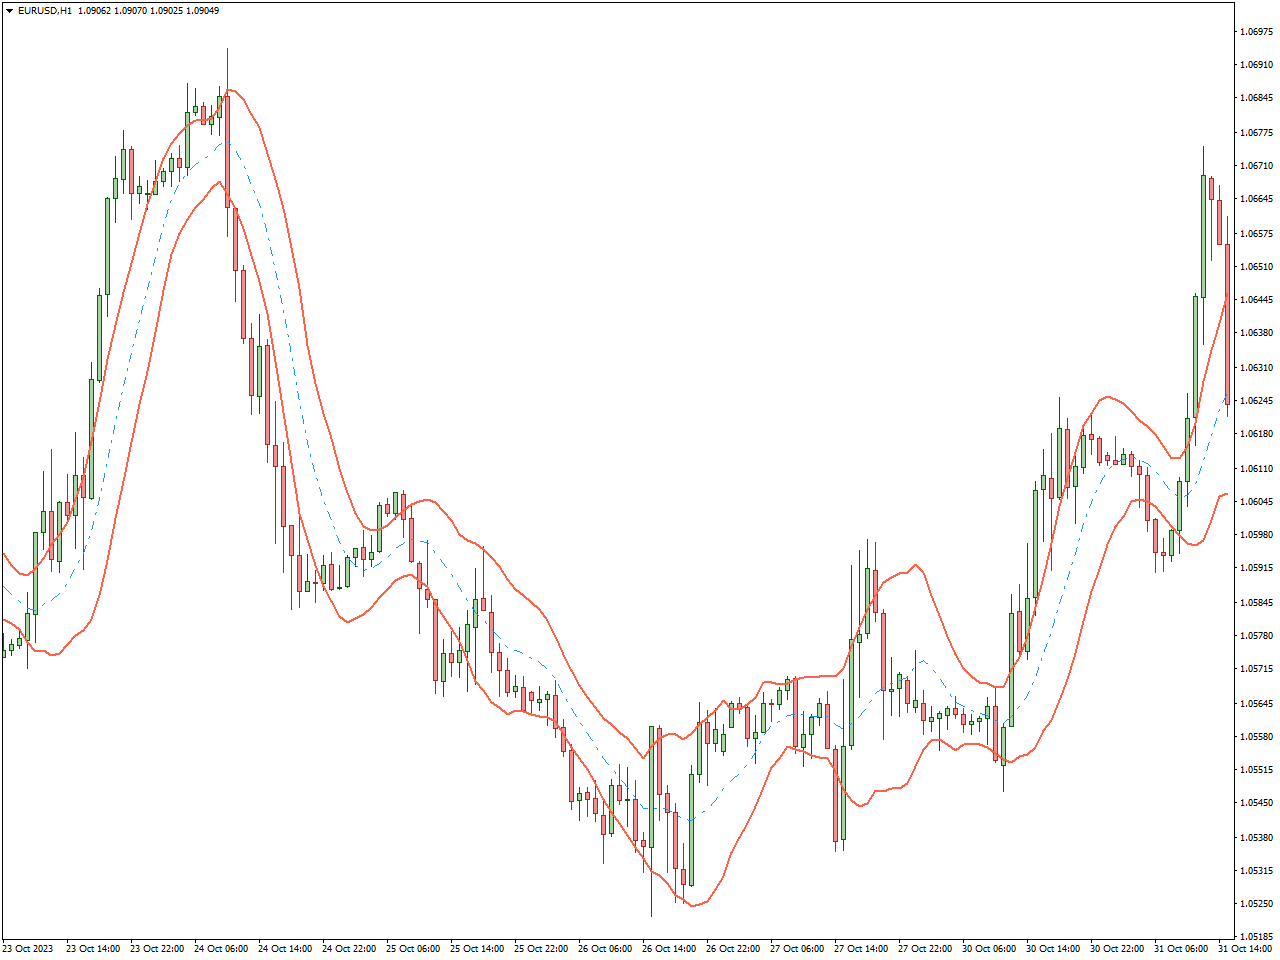
The Keltner Channel Indicator, named after its creator Chester Keltner, is a widely adopted tool in technical analysis that assists traders in evaluating both the volatility and potential trend reversals of a financial asset. This indicator combines the use of an exponential moving average (EMA) and the Average True Range (ATR) to define channel bands around the price movements of the asset.
Comprising three integral elements, the Keltner Channel includes the middle line, typically represented by an EMA calculated from the asset’s closing prices; the upper band, determined by adding a multiple of the ATR to the middle line; and the lower band, derived by subtracting a multiple of the ATR from the middle line. These components collectively form a channel around the asset’s price, providing valuable insights into potential overbought and oversold conditions.
Traders commonly leverage the Keltner Channel to discern trends, assess levels of volatility, and pinpoint potential reversal points. A breach of the upper band may indicate overbought conditions and suggest a potential downward reversal, while breaking below the lower band may signify oversold conditions and hint at a possible upward reversal. Moreover, the width of the channel serves as an indicator of market volatility, with wider channels indicative of higher volatility and narrower channels suggesting lower volatility.
Chaikin Indicator
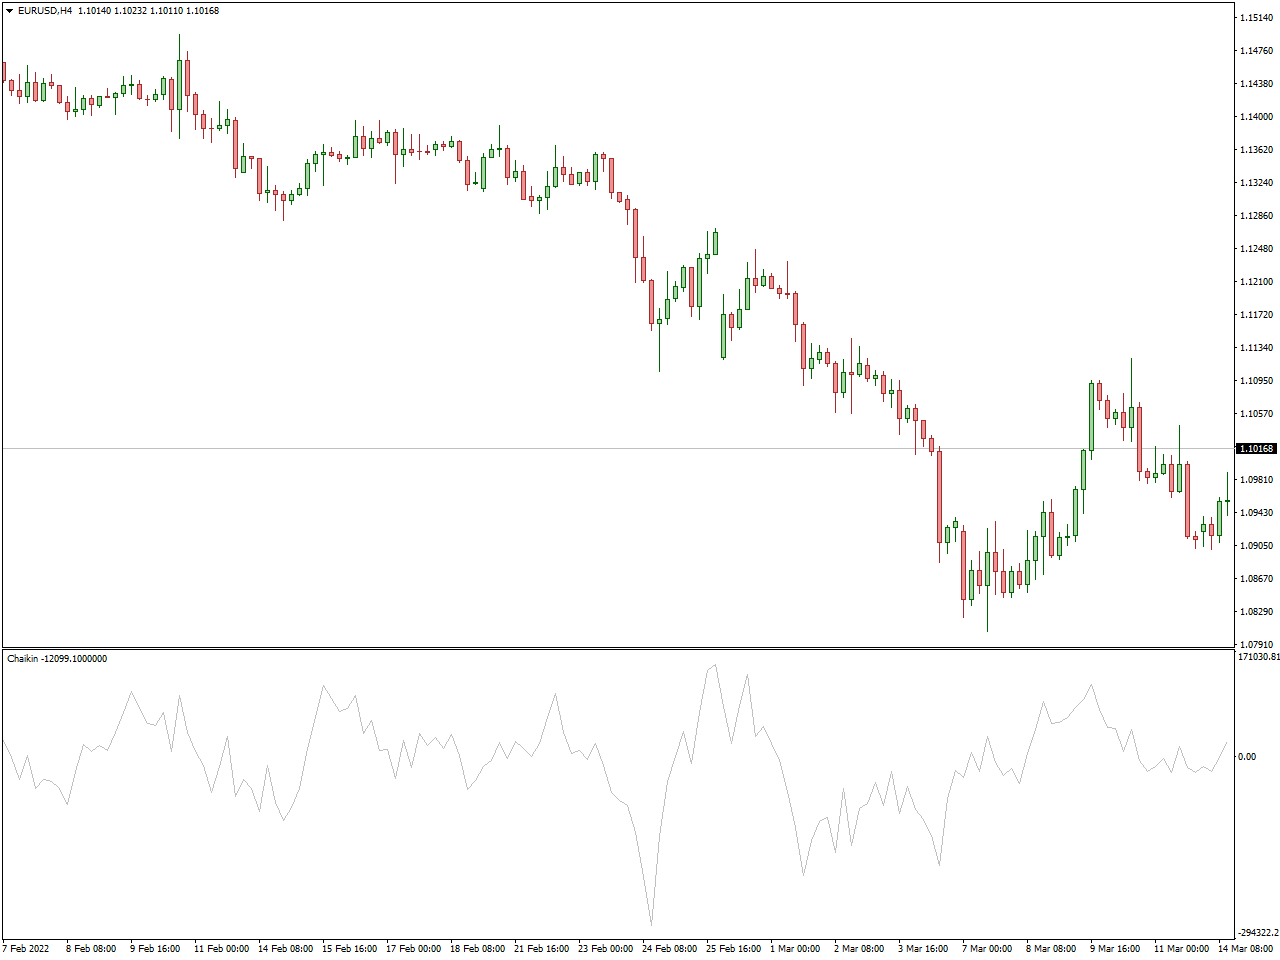
The Chaikin Indicator, developed by Marc Chaikin, is a widely employed technical analysis tool that assists traders in evaluating the momentum and possible shifts in trend within the price movements of a financial asset. This indicator uniquely incorporates both price and volume data to provide a comprehensive understanding of a trend’s strength.
Calculated based on the Accumulation Distribution Line (ADL), the Chaikin Indicator considers the correlation between a financial asset’s closing price and its trading volume. Positive values indicate the presence of buying pressure, suggesting potential upward momentum, while negative values signify selling pressure, indicating potential downward momentum.
Traders commonly apply the Chaikin Indicator to discern trends, anticipate potential reversals, and verify the robustness of price movements. Divergences observed between the indicator and price movements offer additional insights into the fundamental dynamics of a trend. The inclusion of the Chaikin Oscillator, a component derived from the difference between the 3-day exponential moving average and the 10-day exponential moving average of the ADL, further enhances the indicator’s efficacy in identifying shifts in momentum.
Money Flow Index Indicator
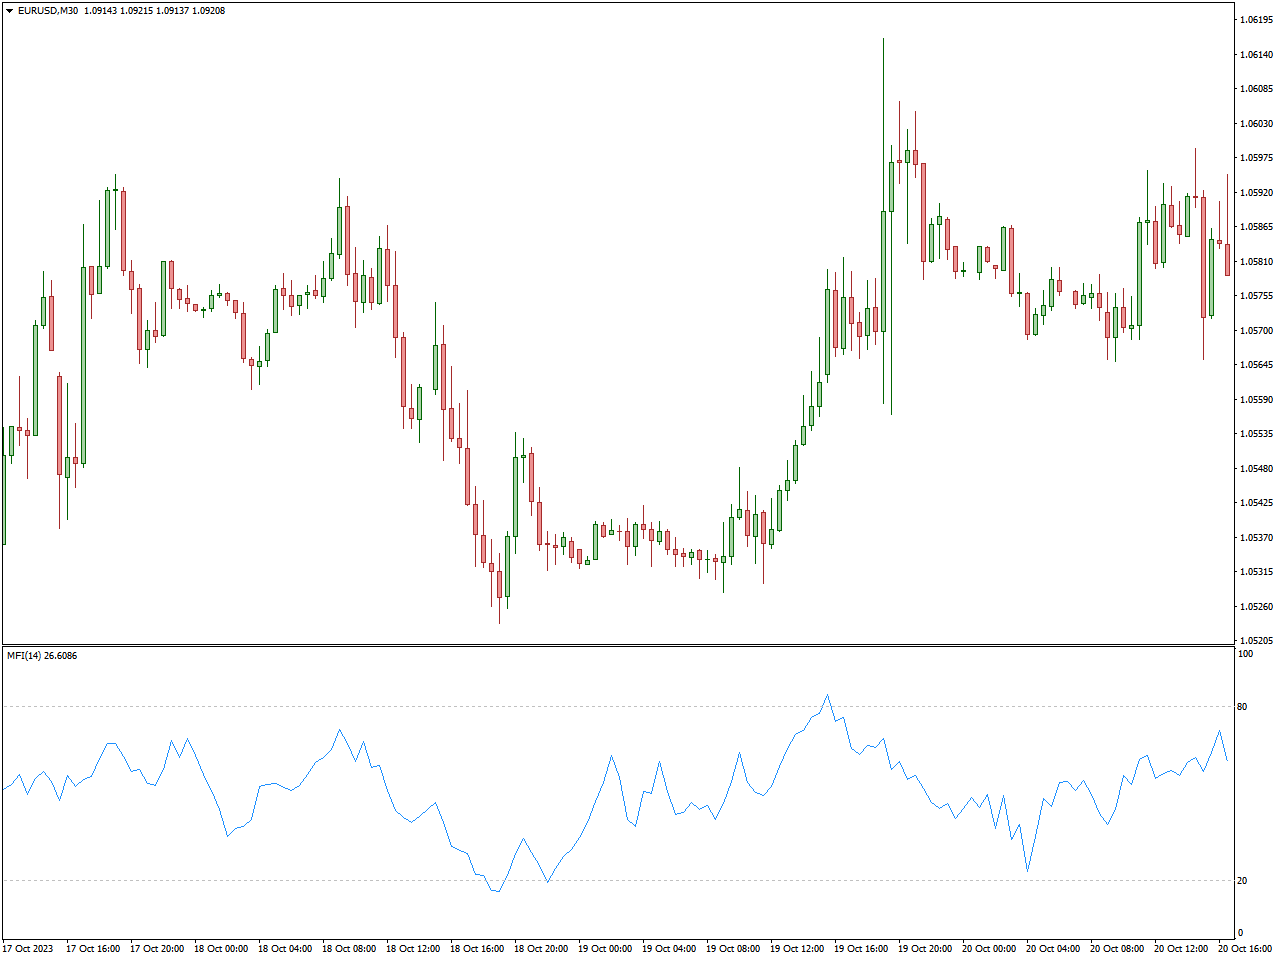
The Money Flow Index (MFI) serves as a widely employed technical analysis tool, aiding traders in assessing the strength and potential reversals within the price movements of a financial asset. Conceived by Gene Quong and Avrum Soudack, the MFI integrates both price and volume data to discern the flow of money into or out of an asset.
Calculation of the Money Flow Index involves evaluating the ratio of positive money flow to negative money flow over a specified period, typically 14 days. Money flow itself is determined by multiplying the typical price (the average of high, low, and close) by the corresponding trading volume. MFI values span from 0 to 100, with readings surpassing 80 signaling overbought conditions, hinting at a possible downward reversal, and readings below 20 denoting oversold conditions, indicating a potential upward reversal.
Traders frequently employ the Money Flow Index to pinpoint potential shifts in trends, identify overbought or oversold scenarios, and gauge the overall strength of a trend. Divergences observed between the MFI and price movements offer supplementary insights into potential alterations in market dynamics. The MFI’s incorporation of both price and volume data renders it an invaluable tool for traders seeking a comprehensive understanding of market conditions.
Choppiness Index V2 Indicator
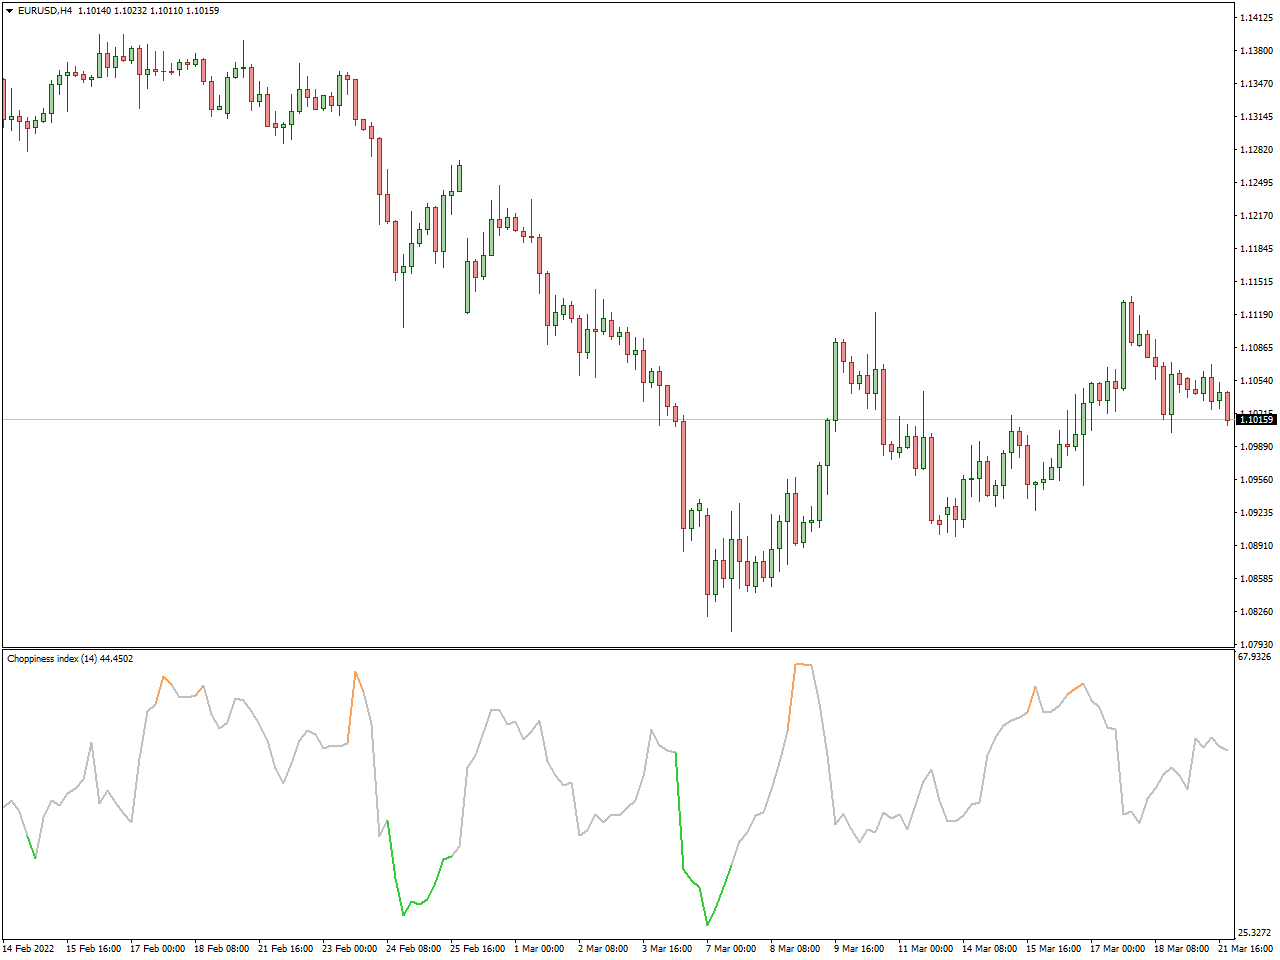
The Choppiness Index (CHOP) is an indicator in technical analysis designed to assess whether the market is currently experiencing a trending phase or a choppy (sideways) phase. Developed by Australian commodity trader E.W. Dreiss, the Choppiness Index aids traders in gauging market volatility and trend strength.
Calculated using a formula that considers the highest high, lowest low, and the range over a specified period (typically 14 periods), the Choppiness Index produces values ranging from 0 to 100. A reading below 38.2 indicates a choppy market phase, suggesting a lack of a discernible trend. Conversely, readings above 61.8 signal a trending market, indicating clear directional price movements.
Traders utilize the Choppiness Index to assess the market environment. During choppy phases, traders may opt to avoid trend-following strategies and instead employ range-bound approaches or use oscillators to capitalize on smaller price fluctuations within the range. In contrast, in trending markets, traders seek opportunities to enter trades in alignment with the trend, often employing additional technical tools for confirmation.
In conclusion, the Choppiness Index furnishes traders with a quantitative metric for distinguishing between market choppiness and trendiness. Through this assessment, traders can fine-tune their strategies, adapting them to the prevailing market conditions and optimizing their trading decisions.
Conclusion
As we wrap up our exploration into the realm of momentum indicators, it becomes apparent that these tools are essential for traders navigating the intricacies of financial markets. Whether it’s the Relative Strength Index (RSI) or the Moving Average Convergence Divergence (MACD), each indicator contributes a unique perspective to the analysis of market momentum. By incorporating the finest momentum indicators into your trading strategy, you acquire the capability to identify trends, pinpoint potential reversals, and make well-timed decisions that may lead to successful trading outcomes. As markets continually evolve, staying attuned to the signals emanating from these momentum indicators can serve as your key to mastering market movements with precision.