

Tick volume is a crucial component in Forex trading, as it provides valuable insights into market activity and liquidity. Understanding how to analyze and interpret tick volume can help traders make more informed decisions and improve their overall trading strategies.
In this article, we will provide a comprehensive guide to tick volume in Forex, including its definition, how it is calculated, and most importantly, how to analyze and interpret it to gain an edge in the Forex market.
What Is Tick Volume?
Before we start learning about tick volume, let’s first understand what a tick is in Forex.
In Forex trading, a tick refers to the smallest unit of measurement for a currency pair’s price movement. It represents the change in the Bid or Ask price of a currency pair by one pip. For example, if the EUR/USD currency pair is currently trading at 1.1200, and the price moves up to 1.1201, this would represent one tick. If the price then moves up to 1.1202, this would represent another tick.
Thus, tick volume refers to the number of price changes (ticks) that occur during a given period of time. A tick represents a price change, and tick volume refers to the total number of ticks that occur during a particular period, such as a minute, an hour, or a day, etc.
Visualization of The Tick Volume
Tick volume is most commonly visualized in the form of a volume bar chart. The standard tool that shows tick volumes in MT4 is called by pressing CTRL+L. The standard tick volume is shown in the screenshot below. The tick volume is shown as vertical blue bars at the bottom of the chart window.
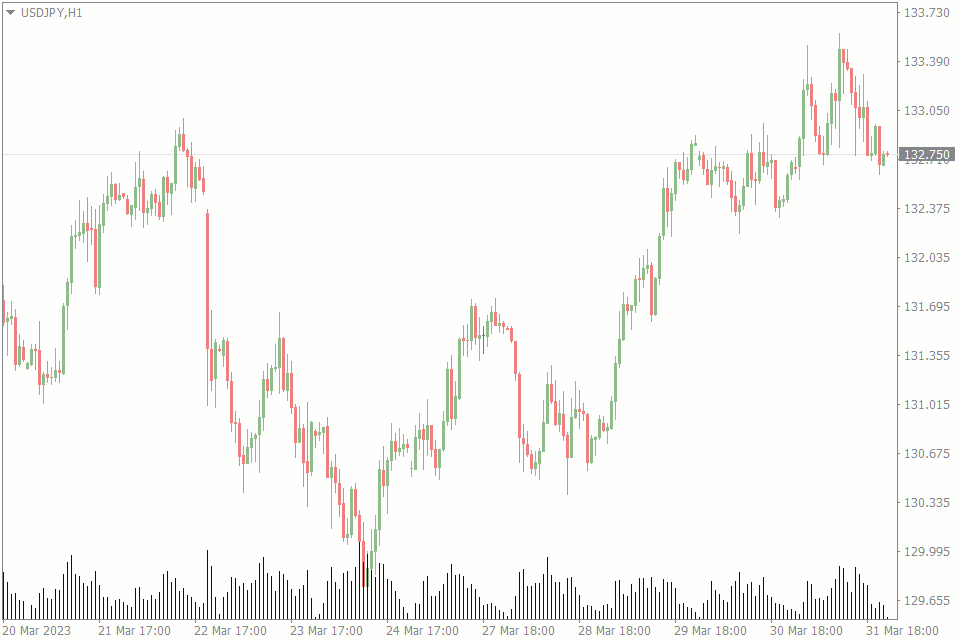
The volume bar in trading charts is typically formed by plotting the tick volume data in a histogram format. Each bar in the volume chart represents the number of ticks that occurred during the selected time period. The height of the bar represents the tick volume for that period, with taller bars indicating higher tick volumes and shorter bars indicating lower tick volumes.
In some trading platforms, the volume bars may also be color-coded to indicate whether the price moved up or down during that period. This can help traders quickly identify trends in tick volume and price movements.
It’s worth noting that tick volume is not the same as actual trading volume, as the former only counts the number of price changes, while the latter measures the actual amount of currency traded. Nonetheless, tick volume can still be a useful tool for Forex traders to gain insights into market dynamics and make more informed trading decisions.
What Is The Difference Between Tick Volume and Actual Trading Volume
Tick volume refers to the number of price changes that occur during a given period of time, while actual trading volume measures the total amount of currency that is bought and sold during that same period.
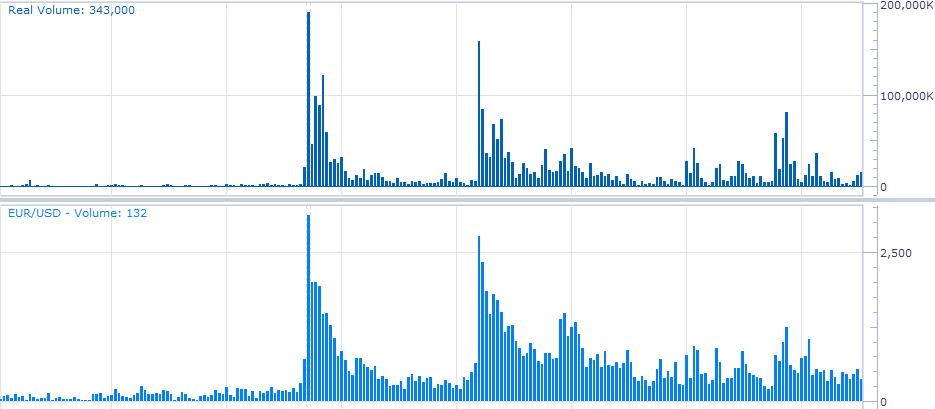
For example, let’s say that a currency pair has a tick volume of 1,000 during a particular minute. This means that the price changed 1,000 times during that minute, but it does not tell us how much currency was actually traded. Actual trading volume, on the other hand, would tell us the exact amount of currency that was bought and sold during that minute.
Tick volume and actual trading volume may look similar in some cases, but they are still distinct measures of market activity.
In certain situations, tick volume can be a good approximation of actual trading volume. For example, in highly liquid currency pairs with many participants trading at high frequencies, tick volume can closely approximate actual trading volume.
However, in other situations where trading is less frequent or there are fewer participants, tick volume may not accurately reflect actual trading volume. In these cases, tick volume may be much higher or lower than actual trading volume, making it an unreliable indicator of market activity.
Additionally, tick volume and actual trading volume may diverge when there is a large order being executed or when market conditions are volatile. For example, a single large trade could significantly impact actual trading volume while having little effect on tick volume.
How To Analyze Tick Volume
Analyzing tick volume involves examining the number of price changes or ticks that occur during a given period of time. By tracking tick volume, traders can gain insights into market activity and liquidity, which can help inform their trading decisions. Here are some key steps to analyzing tick volume:
-
Identify the time period: Select the time period you want to analyze, such as one minute or one hour.
-
Compare tick volumes: Compare the tick volume across different time periods to identify any trends or patterns. For example, if the tick volume is consistently high during certain times of the day, this may indicate a more active and liquid market.
-
Use tick volume with other indicators: Analyzing tick volume in conjunction with other technical indicators, such as moving averages or trend lines, can provide a more complete picture of market activity and help traders make more informed decisions.
-
Consider the context: Keep in mind the broader context of the market, such as major news events or economic data releases, which can impact tick volume and overall market activity.
Overall, analyzing tick volume requires a combination of data analysis and market intuition. By carefully tracking tick volume and using it in conjunction with other technical indicators and market insights, traders can gain a better understanding of market activity and make more informed trading decisions.
Indicators To Analyze Tick Volume
There are a variety of indicators that traders can use to analyze tick volume in Forex trading. They can be divided into three groups:
The Volume Profile indicator displays the trading activity at different price levels over a specified time period. It creates a histogram on the chart that shows the volume traded at each price level, highlighting areas of high and low activity. By analyzing the volume profile, traders can identify areas of support and resistance, as well as potential entry and exit points.
Additionally, the indicator can be used to track the progress of price movement within specific price levels, allowing traders to make more informed decisions based on market activity.
The Better Volume Indicator uses tick volume to measure market activity. It compares the current tick volume to the average tick volume over a specified time period to determine the strength of the market activity. The indicator displays this information in a histogram that shows the cumulative buying and selling pressure over the same time period.
Lastly, the Tick chart indicator is a popular tool for analyzing tick volume, as it displays the number of ticks that occur during a specified time period in the form of a chart. This can help traders visualize market activity and make more informed decisions based on the frequency and intensity of price movements.
By using these and other tick volume indicators in combination with other technical tools and market insights, traders can gain a deeper understanding of market activity and make more profitable trading decisions.
The Bottom Line
Understanding and analyzing tick volume can provide valuable insights into market activity and liquidity in Forex trading. By tracking tick volume and using it in conjunction with other technical indicators and market insights, traders can gain a deeper understanding of market trends, potential entry and exit points, and make more informed trading decisions.
While tick volume should not be relied on as the sole indicator for making trading decisions, it can be a powerful tool in a trader’s toolkit.
Whether you are a beginner or an experienced trader, incorporating tick volume analysis into your trading strategy can help you identify profitable opportunities and improve your overall performance in the Forex market.