

Support and resistance levels are important technical analysis tools used by forex traders to identify potential price levels at which a currency pair may experience buying or selling pressure.
Support and resistance levels are important because they can help traders identify potential entry and exit points for their trades. For example, a trader may look to buy a currency pair when the price approaches a support level, or sell when the price approaches a resistance level. Traders may also use support and resistance levels to set stop-loss and take-profit levels for their trades.
What Are Support and Resistance Levels
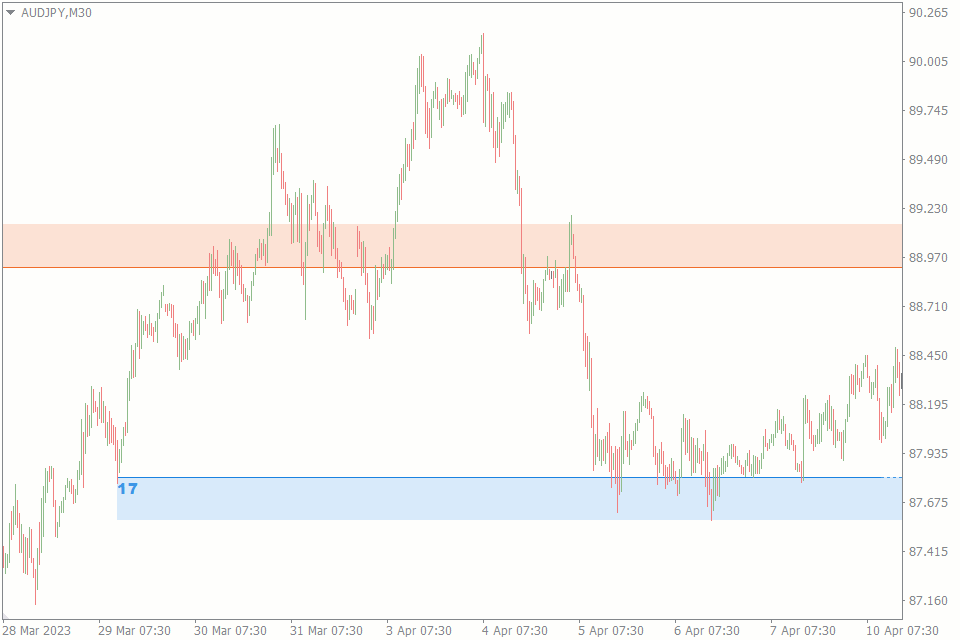
In the chart above you can see the automatically drawn support and resistance lines with the Support and Resistance indicator.
Support is a price level at which the demand for a currency pair is strong enough to prevent the price from falling further. In other words, it is a level where buyers are expected to enter the market and push the price higher. Traders often identify support levels by looking for areas on a chart where the price has previously reversed direction after reaching a certain level.
Resistance, on the other hand, is a price level at which the supply of a currency pair is strong enough to prevent the price from rising further. In other words, it is a level where sellers are expected to enter the market and push the price lower. Traders often identify resistance levels by looking for areas on a chart where the price has previously reversed direction after reaching a certain level.
Why It Is Important to Build Support and Resistance Levels
Support and resistance levels are built by traders and analysts based on historical price data and technical analysis to identify potential price levels at which a currency pair may experience buying or selling pressure.
Building support and resistance levels can be useful for several reasons:
- Trading decisions. Traders can use support and resistance levels to make trading decisions. For example, a trader may look to buy a currency pair when the price approaches a support level or sell when the price approaches a resistance level.
- Risk management. Traders can use support and resistance levels to set stop-loss and take-profit levels for their trades. For example, a trader may set a stop-loss order just below a support level to limit their potential losses if the price falls below that level.
- Trend identification. Support and resistance levels can be used to identify trends in the market. For example, if the price of a currency pair is consistently bouncing off a support level and moving higher, it may indicate an uptrend in the market.
- Confirmation of price movements. Support and resistance levels can provide confirmation of price movements. If a currency pair breaks through a resistance level, it may indicate a bullish signal and a potential continuation of the uptrend.
In summary, building support and resistance levels is an important part of technical analysis and can be useful for making trading decisions, managing risk, identifying trends, and confirming price movements in the forex market.
It is important to note that support and resistance levels are not always precise and can sometimes be broken. Traders should always use other technical analysis tools and risk management strategies to confirm their trading decisions and manage their positions. Alas, even experienced traders do not always build levels correctly.
When Support Becomes Resistance – And Vice Versa
In forex trading, support levels can become resistance levels when the price of a currency pair falls below a support level and then attempts to rise back up. When the price reaches the previous support level that it had broken through, it may encounter selling pressure, causing the price to drop again. This is because the previous support level has now become a resistance level, where traders who had previously bought the currency pair at that level may be looking to sell and take profits.
As an example, look at the uptrend on the weekly EURUSD chart:
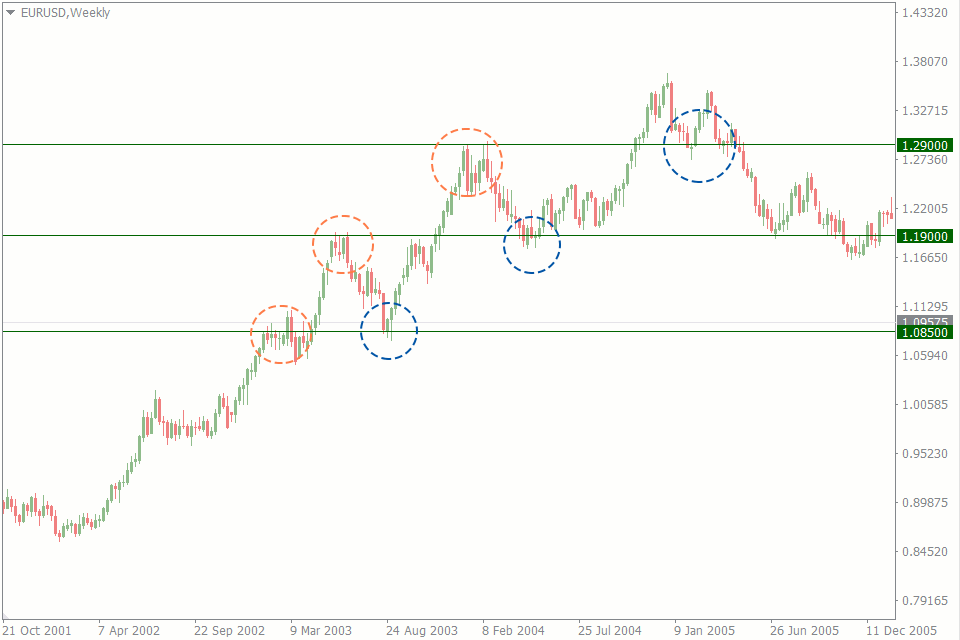
The chart shows price trading near a resistance level (orange circle). Eventually the price breaks through the resistance level and it becomes a support level (blue circle).
This reversal of roles between support and resistance levels can happen due to changes in market sentiment, economic news, or other factors that affect traders’ perceptions of the currency pair’s value. It’s important for traders to be aware of these changes and adjust their trading strategies accordingly. For example, if a support level has become a resistance level, a trader may look for short-selling opportunities or wait for the price to break through the resistance level before entering a long position.
Best Way to Identify Support and Resistance
To exclude the human factor, use special indicators which build support and resistance levels. Here are some of them:
- The Support and Resistance indicator for MT4 automatically plots key levels on the chart, with red indicating resistance and blue indicating support. It saves time for traders, but beginners should manually draw levels to gain experience. These levels guide order placement and help determine signals for opening trades.
- The Support Resistance Breakout Arrows indicator is a popular forex indicator designed for the MT4 platform to identify strong support and resistance levels. The indicator uses Fractals, CCI and RSI to determine the best support and resistance lines and zones and displays them on the chart in blue and red respectively. Also provides buy and sell signals with blue and magenta arrows.
- The ADR HighLow indicator is a forex indicator that traders can use for free on the MT4 platform. This indicator measures the average daily range (ADR) of a currency pair and displays the high and low of the day, and is also a great tool for setting stop loss and take profit levels. Use the best ADR indicator to identify potential support and resistance levels and use their trading strategy successfully.
Once a support or resistance level has been identified, traders can use this information to make trading decisions. For example, a trader may look to buy a currency pair when the price approaches a support level, or sell when the price approaches a resistance level. With the different indicators you can identify relevant support and resistance levels and build your trading strategies based on them. In addition, useful adjustments and customizations to the indicators can make it easily fit your trading style.