

The stochastic indicator is a popular forex technical analysis tool used by traders to identify potential buy or sell signals in financial markets. It was developed in the late 1950s by George Lane, and it is based on the observation that as a financial instrument’s price trend changes, the closing price tends to be closer to the high or low of the price range.
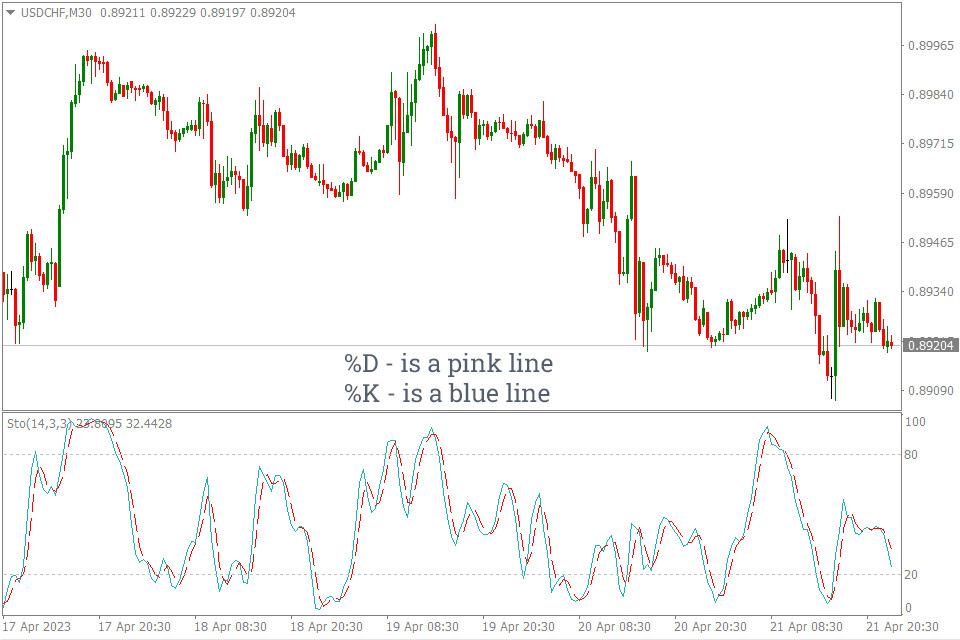
The stochastic indicator consists of two lines: the %K line and the %D line. The %K line is the main line, and it measures the current price’s position relative to the recent price range. The %D line is a moving average of the %K line and is used to smooth out the fluctuations in the %K line. The stochastic indicator is plotted on a scale of 0 to 100, with readings above 80 indicating overbought conditions and readings below 20 indicating oversold conditions.
Traders use the stochastic indicator in a variety of ways, such as to identify trend reversals, to confirm trends, and to generate buy and sell signals. For example, a buy signal may be generated when the %K line crosses above the %D line while both lines are in oversold territory, and a sell signal may be generated when the %K line crosses below the %D line while both lines are in overbought territory.
How the Stochastic Indicator is Calculated
The stochastic indicator is calculated using the following formula:
%K = (Current Close – Lowest Low) / (Highest High – Lowest Low) * 100
Where:
- Current Close is the current closing price of the financial instrument being analyzed.
- Lowest Low is the lowest low price of the financial instrument over a specified period (usually 14 periods).
- Highest High is the highest high price of the financial instrument over the same specified period (usually 14 periods).
- Once the %K line is calculated, the %D line is then calculated as a moving average of the %K line. The most commonly used moving average for the %D line is a 3-period simple moving average.
%D = 3 – period Simple Moving Average of the %K.
Here’s an example of how the stochastic indicator would be calculated for a hypothetical financial instrument with a closing price of $50 over the last 14 periods:
The lowest low over the last 14 periods is $40.
The highest high over the last 14 periods is $60.
The %K line would be calculated as: (%K = ($50 – $40) / ($60 – $40)) * 100 = 50.
The %D line would be calculated as a 3-period simple moving average of the %K line. Suppose that the %K line over the last three periods was 40, 50, and 60. The %D line would be calculated as: %D = (40 + 50 + 60) / 3 = 50.
The resulting stochastic indicator value would be 50 for both the %K and %D lines.
How to Trade Forex Using the Stochastic Oscillator
You can use the stochastic indicators in many ways, depending on what your trading strategy is. The most common uses of the stochastic oscillator are to determine overbought or oversold prices and make trades using divergences.
Overbought and Oversold Levels
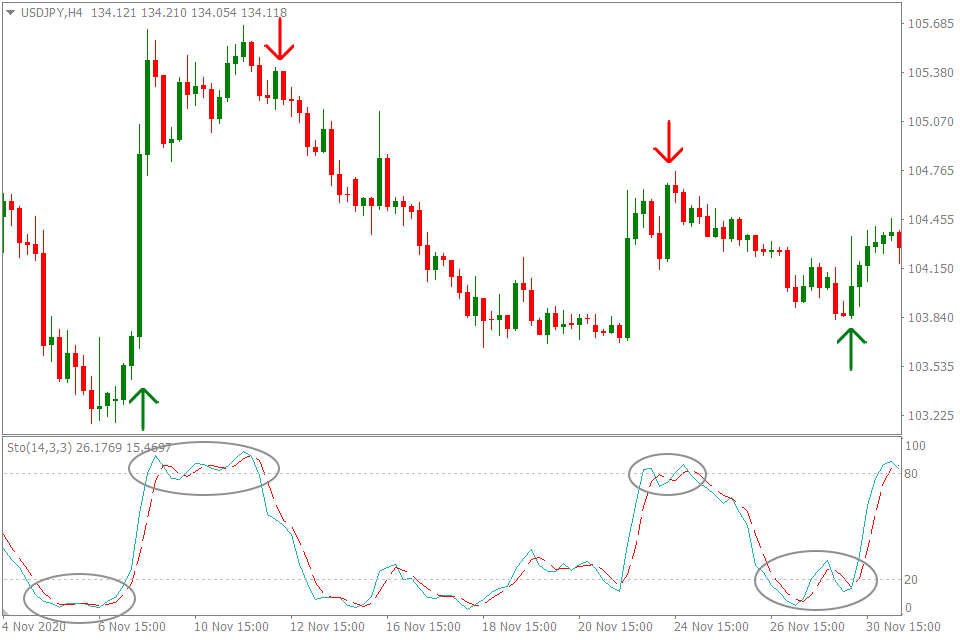
The stochastic indicators values are between 0 and 100. When the lines cross the 80% mark, this is a sign of overbought conditions. It is possible that uptrend the trend could reverse. When the price drops below 20%, you should buy because it is oversold.
When using the stochastic as part of your strategy for overbought/oversold, be careful. Price can stay overbought/oversold for some time before it reverses. Wait for confirmation of the price’s reversal before making a trade if you are in this situation.
Wait for Confirmation. It’s important to wait for confirmation before making any trading decisions based on the stochastic indicator. For example, if the %K line rises above 80, wait for the %D line to also rise above 80 before considering a short trade.
Consider Other Technical Indicators: The stochastic indicator is just one tool in a trader’s arsenal. Consider using other technical indicators such as moving averages, trend lines, and support and resistance levels to confirm signals from the stochastic indicator.
Look for Divergences
Trading divergences is also another useful way to make trades using the stochastic oscillator. Its use is similar to how it works on the MACD. One way to use the stochastic indicator is to look for divergences between the indicator and price. If the price is making higher highs but the stochastic indicator is making lower highs, it could be a sign of weakness and a potential reversal.
Normaly, the stochastics indicator follows the price movements. The indicator will trend upwards when the price is trending upward, and downwards when the same price is trending downwards. You’ll see that the indicator will form lower lows if the price is on a downward trend, and higher highs if the indicator is on an upward trend.
In rare instances, the stochastic may move in a direction different from the price. Price is either rising while indicator is falling, or vice-versa. Divergence is what we call it. In such cases, be prepared for a possible change in the direction of price.
You can also combine indicators. Here are some useful divergence indicators:
- MACD Divergence. The MACD Divergence Indicator is a powerful tool that helps traders identify trend reversal points in the market. It is a popular and free indicator that is compatible with the MT4 platform. This new indicator plots divergences between the MACD indicator and the price on your chart, making it easy to spot potential trend reversals. It works by measuring the difference between two moving averages, and traders can use it to identify bullish or bearish divergences. With its ability to identify trend reversal points, this indicator is useful for both beginner and advanced traders.
- AO Divergence. The AO Divergence Indicator is a useful BE4 tool for forex traders who want to identify divergence patterns in the market. This new MT4 indicator is popular with traders due to its effectiveness in spotting divergence patterns and predicting potential price reversals. It works by analyzing the Awesome Oscillator (AO) and highlighting divergence patterns that may indicate possible trend changes. The AO Divergence Indicator is easy to use and can be a valuable addition to any trader’s toolbox.
Bottom Line
The stochastic indicator can be a useful tool for identifying overbought and oversold conditions in the market. However, it’s important to use it in conjunction with other technical indicators and to wait for confirmation before making any trading decisions.