

Arrow indicators are technical analysis tools used in financial markets, including forex, stocks, and commodities. These indicators typically appear as arrows on price charts, pointing either up or down, to signal potential entry or exit points for traders. The arrows indicate the direction in which a trader should consider taking action, such as buying or selling a financial instrument.
It’s important to note that while arrow indicators can be useful tools for traders, they should not be used in isolation. It’s essential to combine them with other technical analysis tools, such as trendlines, moving averages, and price patterns, to confirm trading signals and make informed decisions.
Different trading platforms, including MetaTrader 4 (MT4), offer various arrow indicators that traders can use to enhance their analysis and trading strategies. Traders should experiment with different indicators and settings to find the ones that align best with their trading style and preferences. As with any trading strategy, risk management and thorough analysis are crucial for successful trading outcomes.
Arrow Indicators for MT5
- MA Crossover Alert Indicator
- MACD True Alerts Indicator
- Dark Inversion Indicator
- ADX Buy Sell Indicator
- Trend Signal Indicator
- TRIX Arrows Indicator
- FXSSI.ProfitRatio
- Buy Sell Signals Arrows Indicator
- PZ Reversals Fractals Indicator
- My Price Action Indicator
- Stochastic Cross Alert Indicator
- i-GAP Indicator
- MACD Divergence Indicator
- ADX Crossing MA Indicator
- TD Sequential Ultimate Indicator
- Fractal ZigZag No-repaint Indicator
- MACD With Alert Indicator
- 3 MA Cross Alert Indicator
- JF Engulfing Indicator
- Sidus Indicator
MA Crossover Alert Indicator
The Moving Average crossover alert indicator is a powerful analysis tool used by forex traders to recognize potential entry and exit points in the financial markets. It relies on the intersection of two moving averages and generates visual alerts to indicate BUY and SELL signals.
This indicator can be applied to various timeframes and financial instruments, such as stocks, forex pairs, commodities, or cryptocurrencies. Understanding that no indicator can ensure precise signals, it is essential to acknowledge the importance of combining it with other technical analysis tools and risk management strategies for optimal results.
It’s important to note that no trading indicator is foolproof, and using this Moving Average crossover alert indicator should be combined with other forms of analysis and risk management techniques. Additionally, the effectiveness of this indicator may vary depending on the market conditions, and it is essential to test it thoroughly on past data before actually using it in real-time trading.
Finally, indicators serve as tools to support the trading process, but they should not be the sole basis for making trading decisions.It’s crucial to have a well-thought-out trading strategy and a good understanding of the market dynamics to become a successful forex trader.
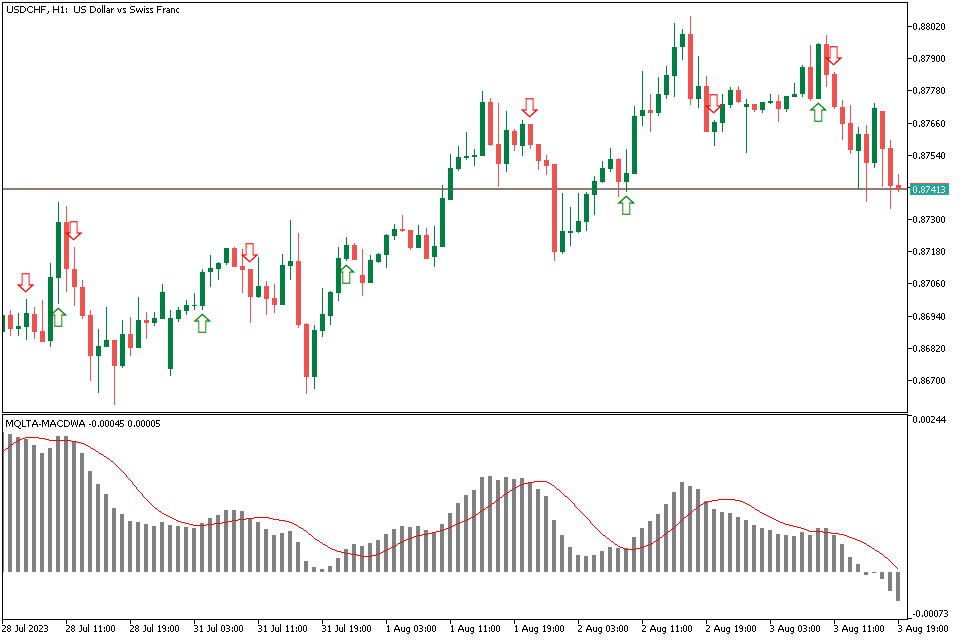
MACD True Alerts Indicator
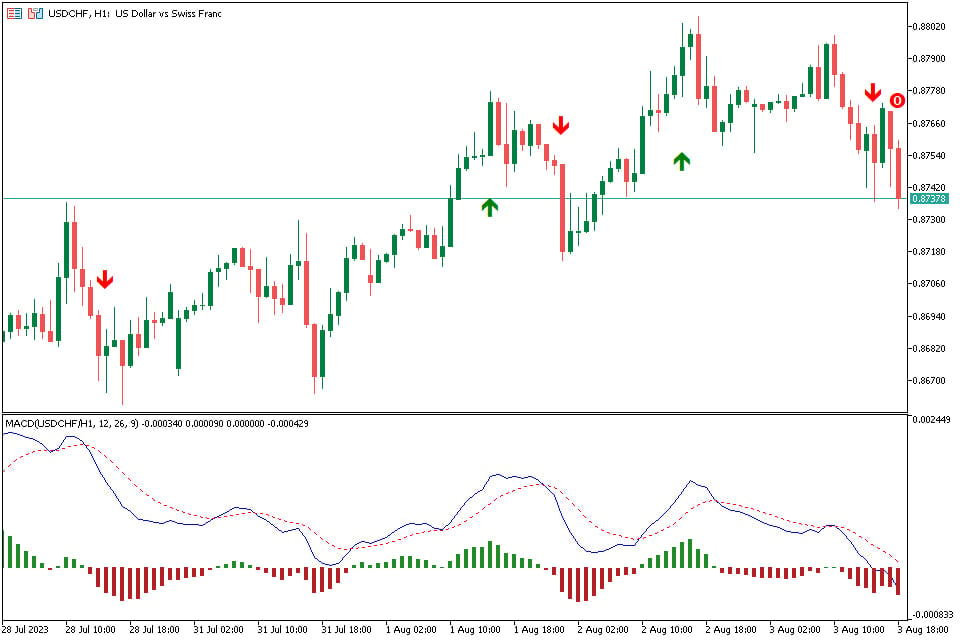
The MACD, a widely used momentum indicator, comprises two lines: the MACD line and the signal line. It aids in recognizing shifts in the strength, direction, momentum, and duration of a trend in the price of a financial instrument.
Traders frequently employ crossovers between the MACD line and the signal line as a means to generate trading signals.
In trading, it is common for many traders to use two Exponential Moving Averages (EMAs) – a fast one and a slow one. Combining these two EMAs enhances trend identification and can also be useful for signaling entry or exit points in the market.
The term “True Alerts” suggests that this custom indicator incorporates additional criteria or filters to reduce false signals or enhance the accuracy of the alerts generated by the MACD. These filters may involve other technical indicators, price patterns, or specific conditions that must be met to trigger alerts.
The MACD True Alerts indicator in MT5 operates similarly to the standard MACD, but it comes with an extra signal line. This additional line aids in analyzing the overall price direction.
Dark Inversion Indicator
The Dark Inversion Indicator for MT5 is a robust technical analysis tool that assists traders in spotting potential market reversals. Using sophisticated algorithms and price action patterns, it identifies critical turning points in the market, offering valuable insights into potential trend shifts.
This Indicator generates trading signals based on a logical formula derived from data on each timeframe. It incorporates an Average True Range (ATR) set with 14 periods to measure market volatility. Traders can follow real-time signals generated by the indicator.
The indicator provides values for setting stop-loss (SL) and take-profit (TP) levels.
For beginners, the Dark Point Indicator can serve as an easy-to-use trading guide. It offers different win rate statistics depending on the timeframe used, allowing traders to identify the most favorable timeframe to achieve higher win rates.
ADX Buy Sell Indicator
ADX (Average Directional Index) serves as a measure of trend strength. It calculates the moving average of price range expansion over a specific period, commonly set to 14 bars, but other timeframes can also be used.
When the +DMI (Positive Directional Movement Indicator) is higher than the -DMI (Negative Directional Movement Indicator), it indicates that prices are on the rise, and ADX measures the strength of the uptrend. Conversely, when the -DMI is above the +DMI, it signals that prices are declining, and ADX gauges the strength of the downtrend.
This versatile tool, ADX, can be applied to various trading assets, including stocks, mutual funds, exchange-traded funds (ETFs), and futures.
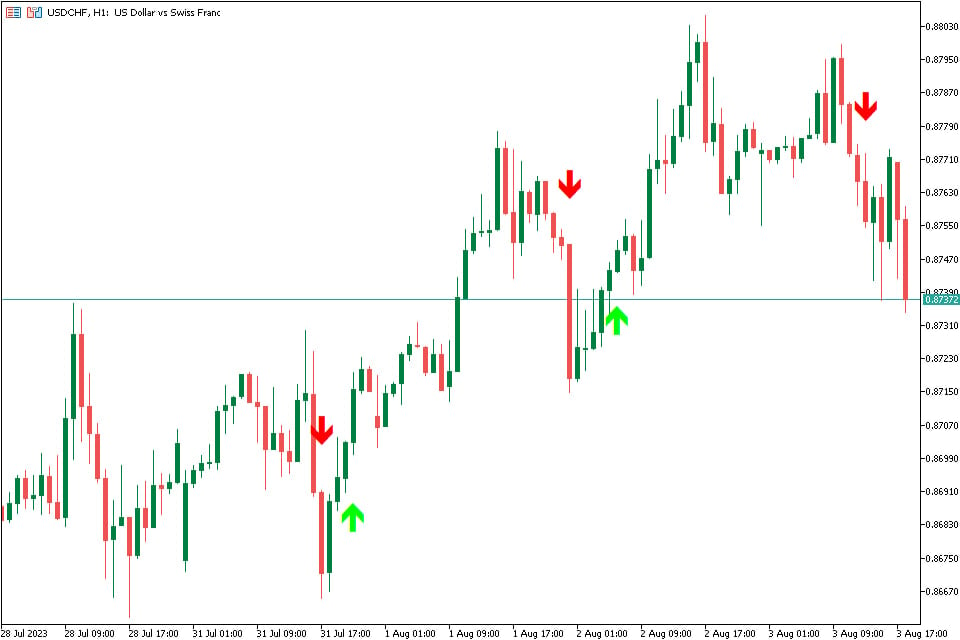
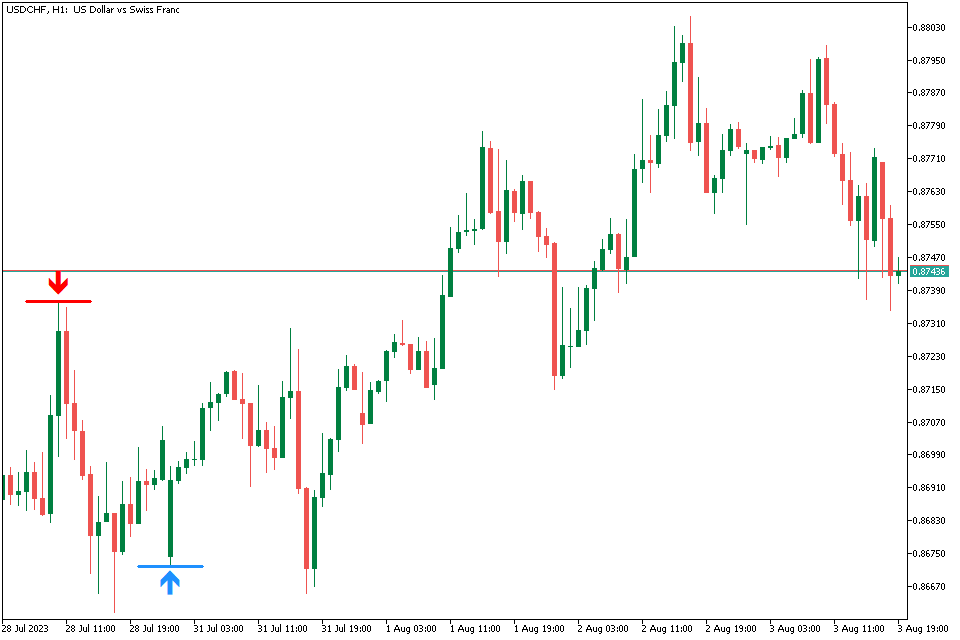
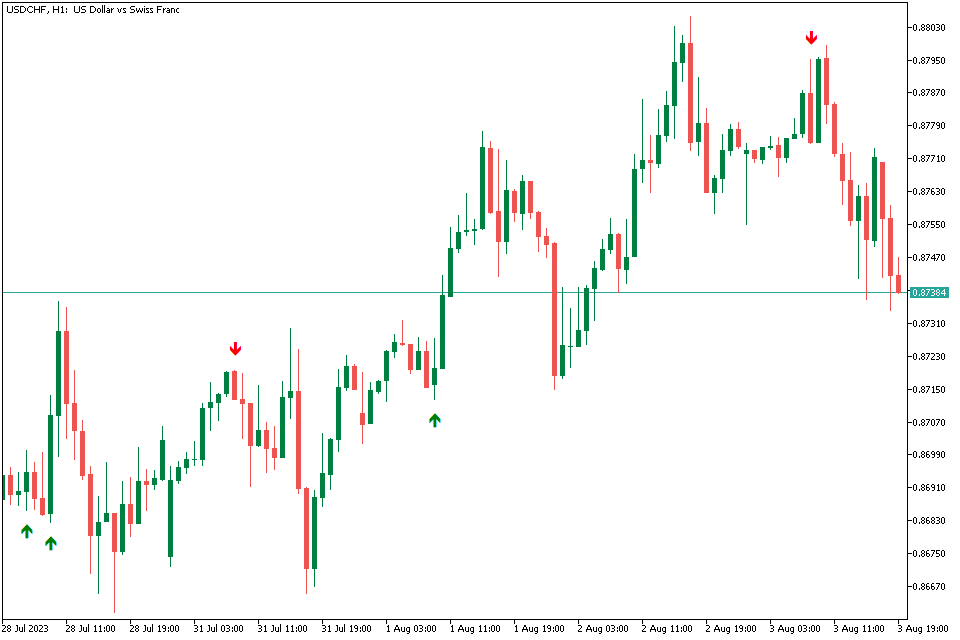
Trend Signal Indicator
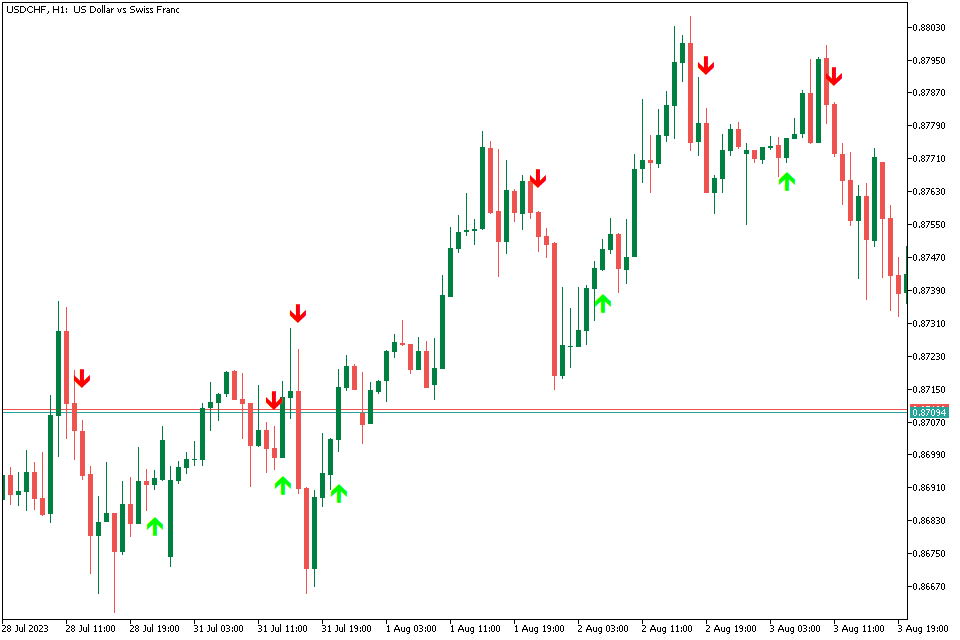
The “Trend Signal Indicator” is a technical analysis tool used to identify and signal potential trends in the financial markets. This indicator analyzes price data and other relevant factors to generate visual cues or alerts that suggest the presence of a particular trend, such as an uptrend or downtrend.
When the indicator identifies a bullish trend, it generates a BUY or LONG signal, suggesting that traders may consider entering a long position. On the other hand, when a bearish trend is detected, the indicator generates a SELL or SHORT signal, indicating a potential opportunity to enter a short position.
The indicator’s primary purpose is to assist traders in recognizing the prevailing trend (bullish, bearish, or sideways) and potential entry or exit points in the market. It can be beneficial for traders seeking to align their trades with the prevailing trend to increase the likelihood of profitable outcomes.
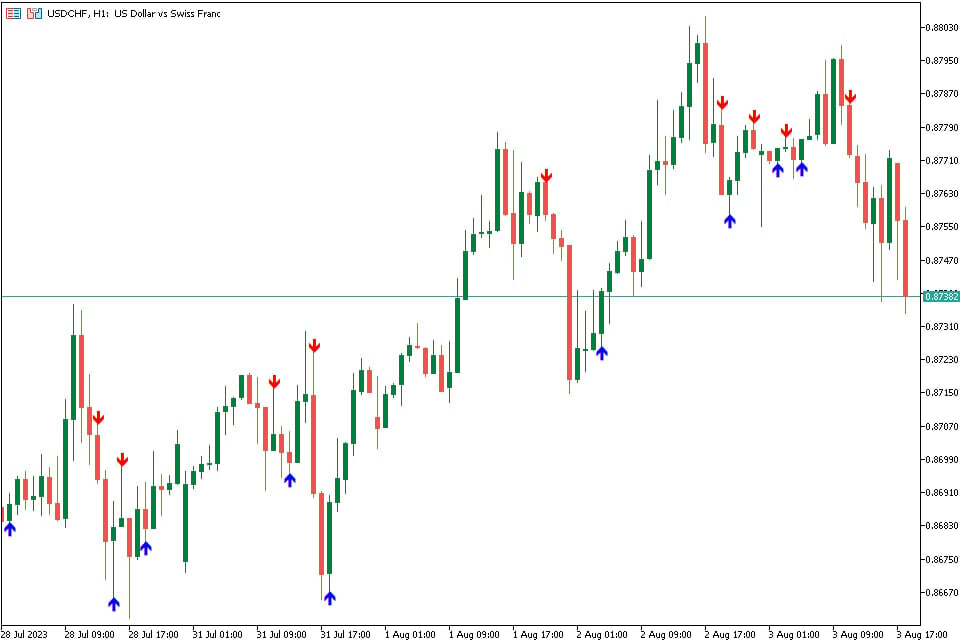
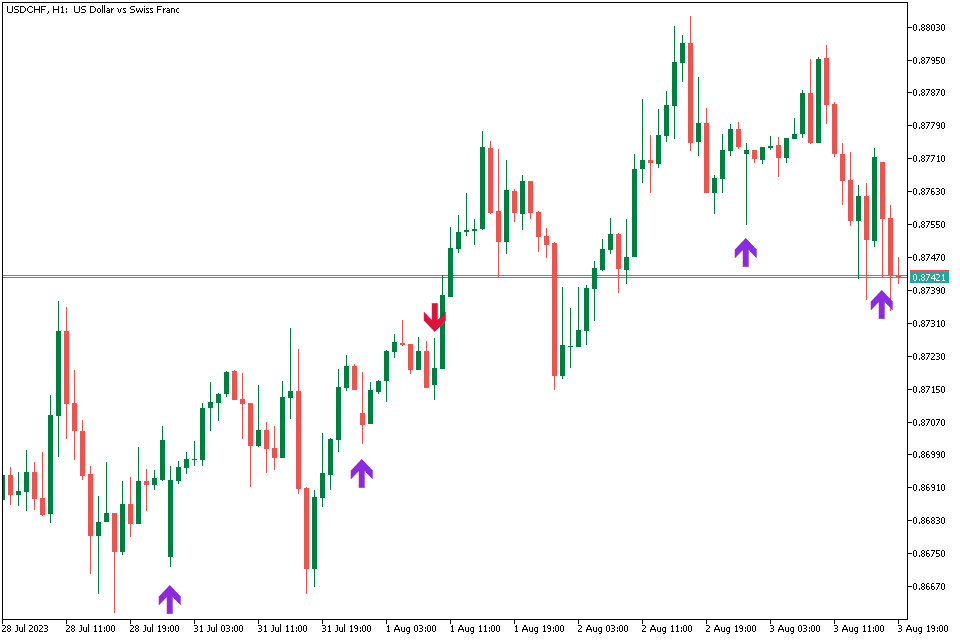
TRIX Arrows Indicator
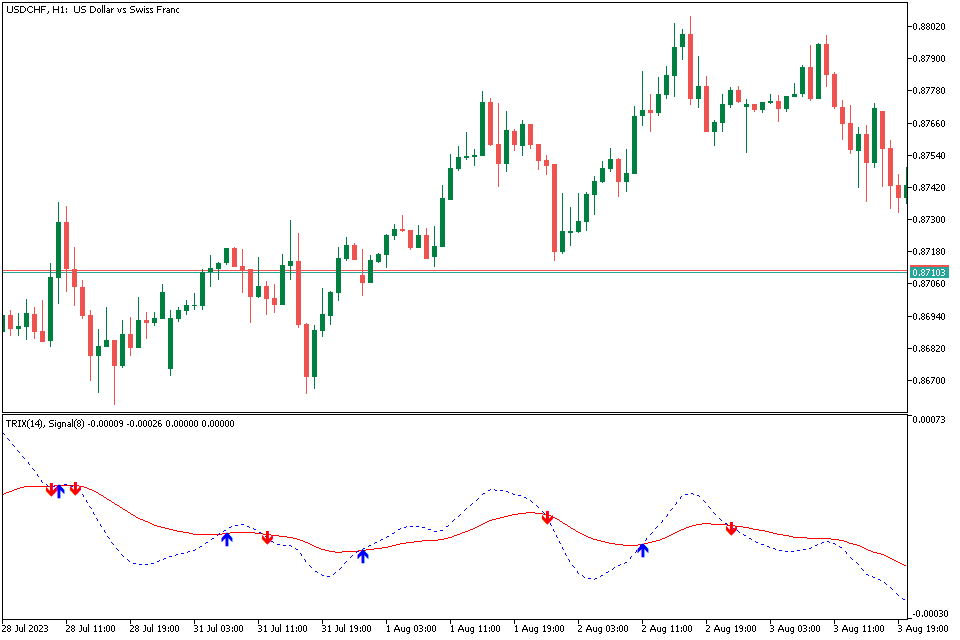
The Trix Arrows Indicator is a trend analysis tool for forex trading that evaluates price deviation and market volatility to determine the trend direction. The indicator comprises two curves: the red curve serves as the reference, and the blue curve acts as the signal.
A blue arrow pointing upward occurs when the blue curve crosses above the red curve, indicating buyer dominance. Conversely, a red arrow is formed when the blue curve crosses below the red curve, suggesting potential short trade setups. Before utilizing this tool, it’s essential to identify key support and resistance levels in the market.
The TRIX indicator is a valuable tool for investors, analysts, and traders. It allows them to analyze price trends and momentum, though it’s not foolproof. Despite this, TRIX remains a versatile and straightforward method for predicting price performance to some extent. Professional investors and traders are encouraged to study various prediction methods and past market movements. Once they grasp the market and its tools, they can trade with confidence. Learning about TRIX and other trading strategies will always be beneficial for investors.
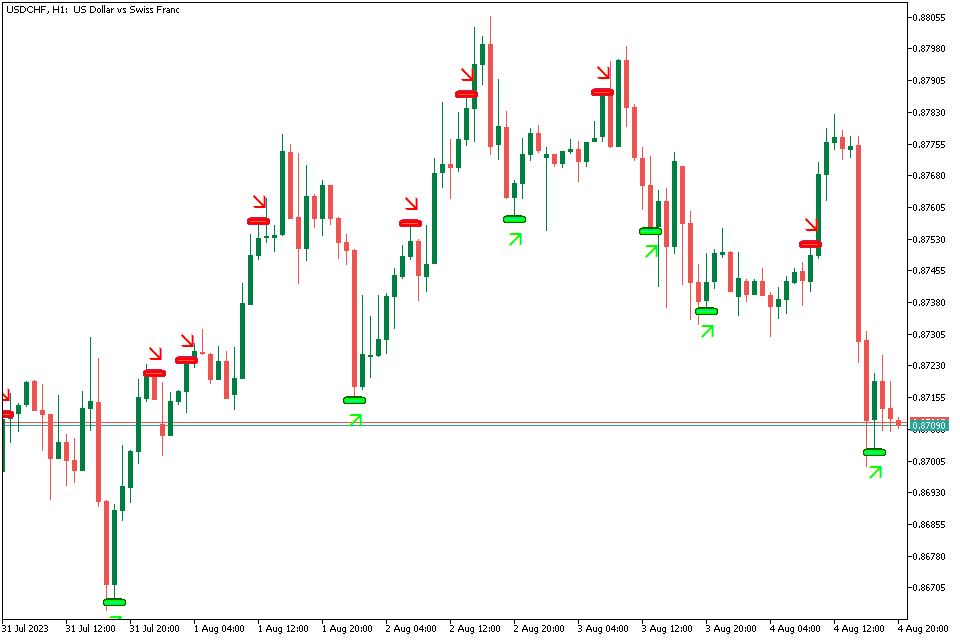
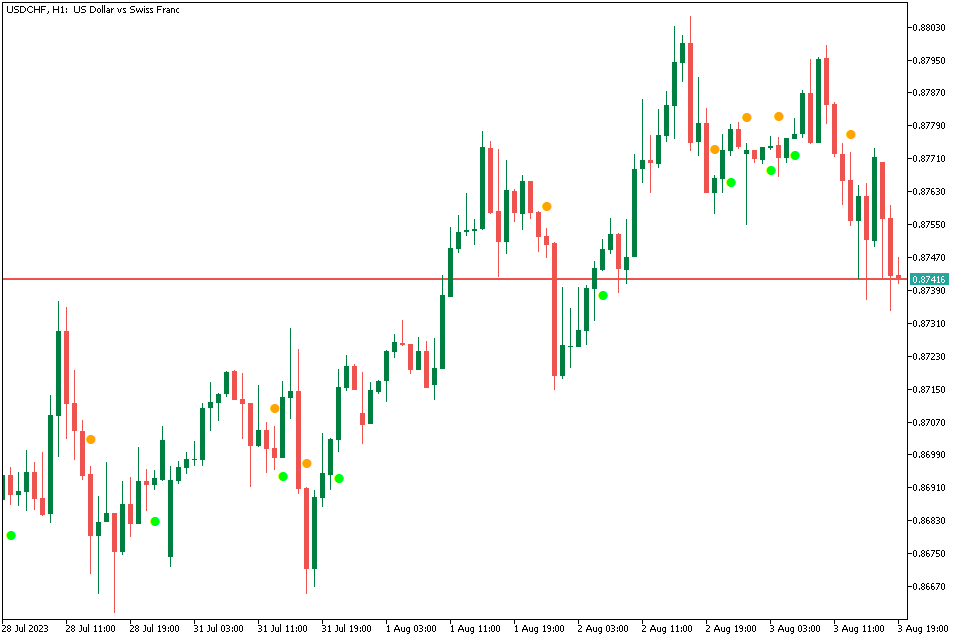
FXSSI.ProfitRatio
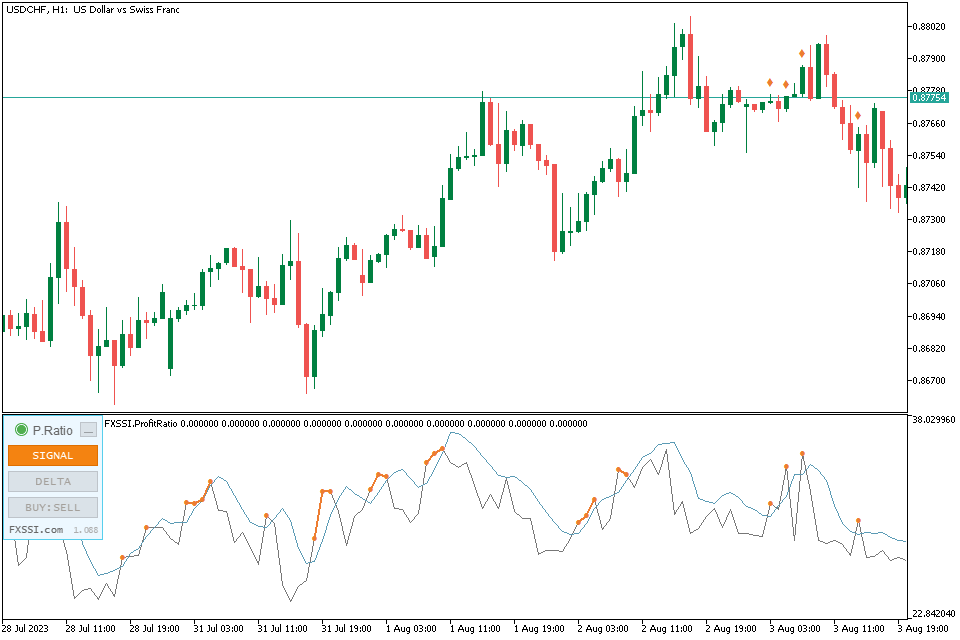
One of the most difficult aspects of Forex trading involves precisely identifying trend reversal points. These specific points hold significance as they enable early market entry during price movements, leading to substantial profits.
The Profit Ratio indicator exhibits the ratio of successful to unsuccessful trades among the presently active positions. This tool aids in identifying potential reversal levels even prior to the price embarking on a reverse trajectory.
If the diamond appears above the price, it serves as a reversal signal, indicating a shift from a bullish to a bearish market, thus signaling a potential sell opportunity. Conversely, if the diamond appears below the price, it acts as a reversal signal for a bearish to bullish market transition, signaling a potential buy opportunity.
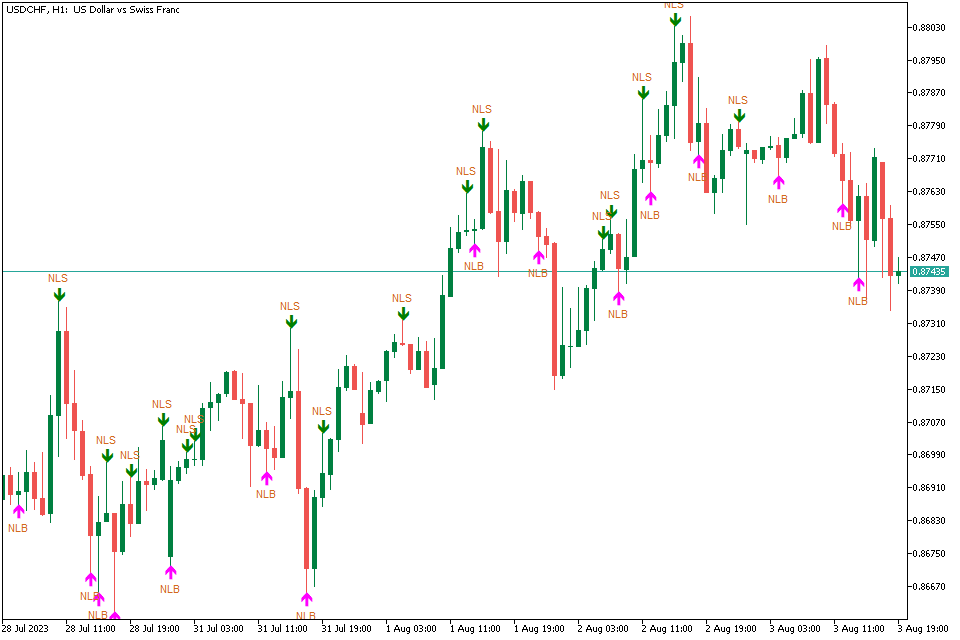
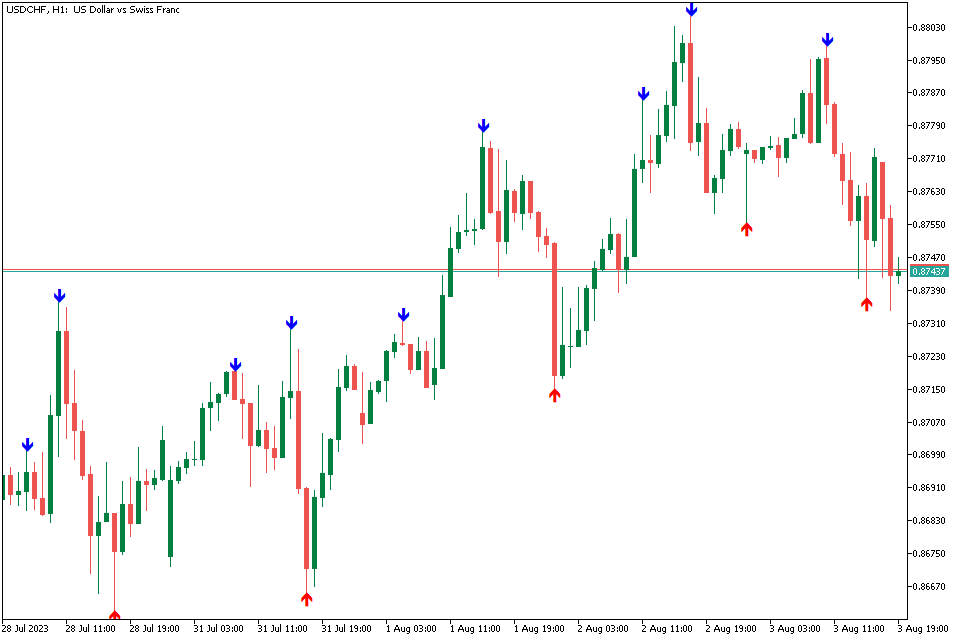
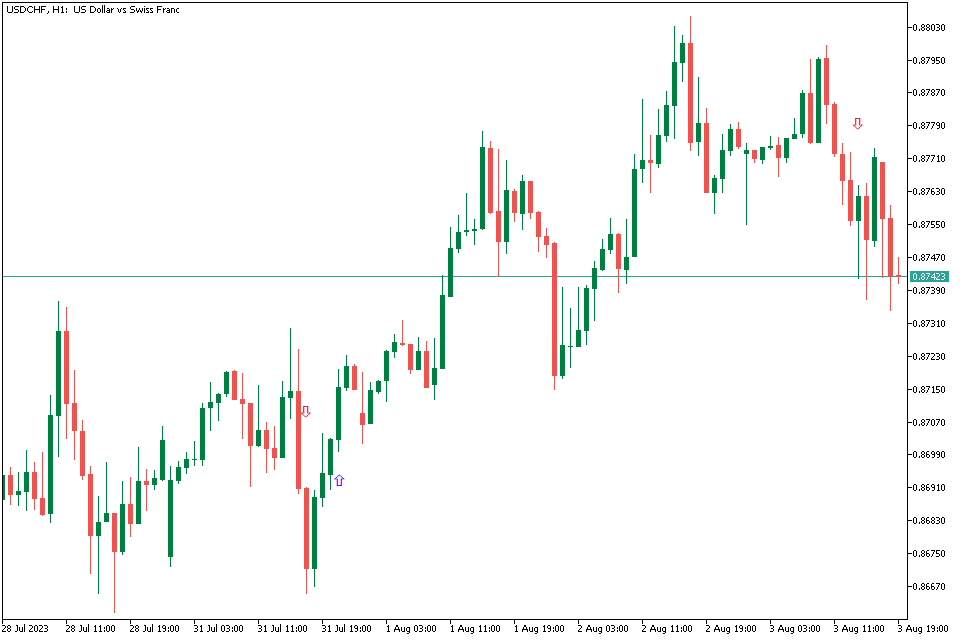
Buy Sell Signals Arrows Indicator
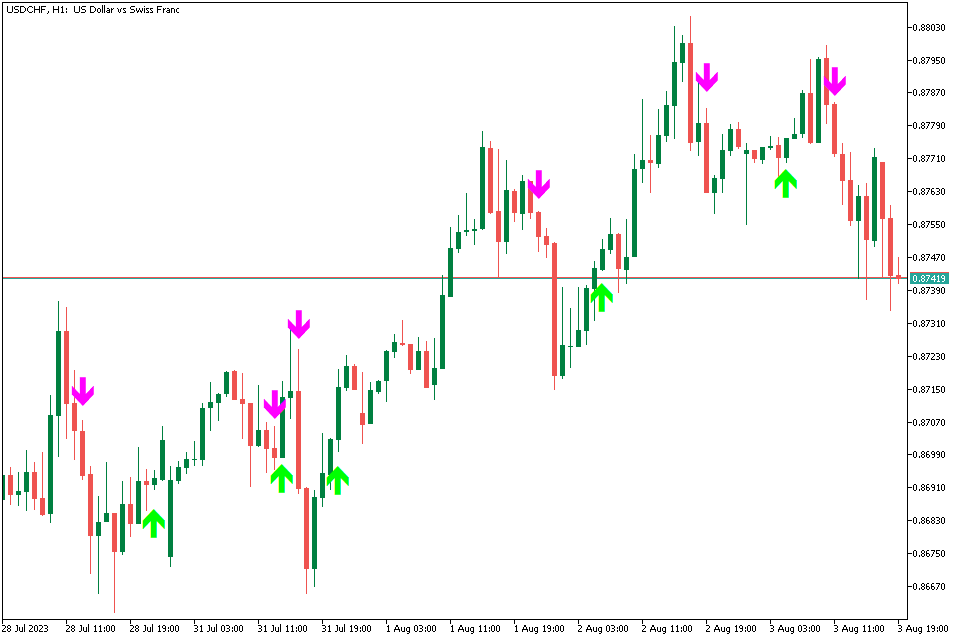
The “Buy Sell Signals Arrows Indicator” is a technical analysis tool used in forex trading to provide visual signals in the form of arrows, indicating potential entry and exit points for buying and selling assets or securities.
When the indicator generates a “Buy” signal, it displays an upward-pointing arrow, suggesting that it may be an opportune time to enter a long position (buy) in the asset. Conversely, when a “Sell” signal is generated, a downward-pointing arrow appears, indicating a potential exit point or a chance to enter a short position (sell) to profit from a declining market.
Forex traders often use such indicators as a part of their trading strategies to help them make informed decisions about when to initiate or exit trades, and to identify potential trend reversals or significant price movements in the market.
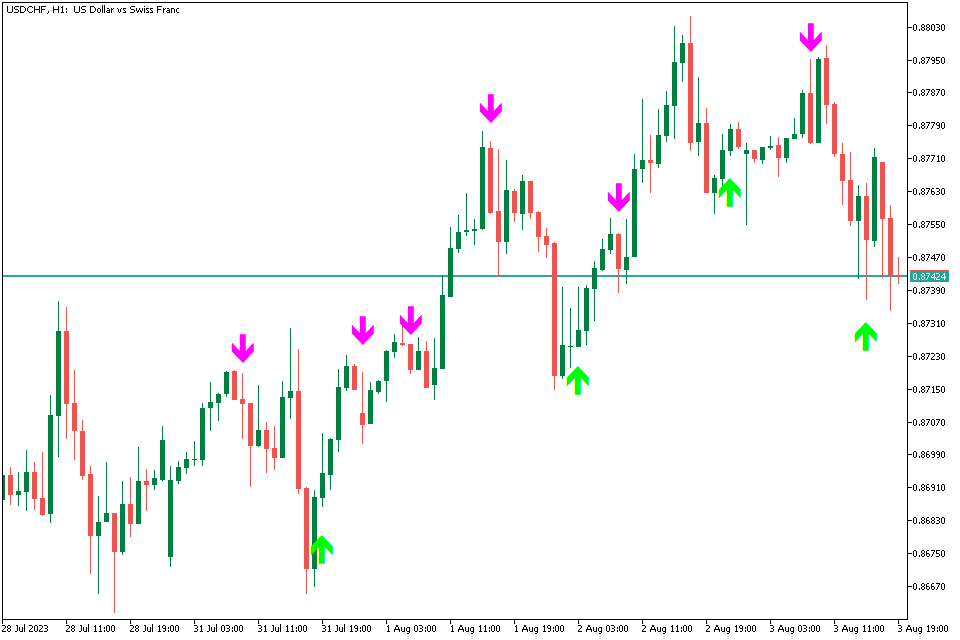
PZ Reversals Fractals Indicator
The indicator in question is categorized as a reactive or lagging signal due to its reliance on fractals, which are formations consisting of an odd number of bars with the central bar being the highest or lowest point.
The indicator plots its signal only after all bars in the fractal have closed. Despite this characteristic, traders with a pre-existing directional bias will discover the indicator to be highly valuable as it can identify early entry points in the market.
The PZ Reversals Fractals is a tool that scans fractals and highlights significant market reversals. By examining the displayed arrows, forex traders can make informed decisions to open either long or short positions.
My Price Action Indicator
The “Price Action Indicator” is a trading tool that focuses on analyzing the movement of asset prices on a chart without relying on traditional technical indicators.
Instead of using complex mathematical calculations like traditional indicators, the Price Action Indicator primarily looks for candlestick patterns, support and resistance levels, trendlines, and other visual cues to understand market sentiment and make trading decisions.
It’s worth noting that the Price Action Indicator requires experience and skill in interpreting price movements, and it is often used in combination with other technical and fundamental analysis tools to build a comprehensive trading strategy.
Stochastic Cross Alert Indicator
The Stochastic Cross Alert Indicator is an invaluable tool in technical analysis, aiding traders in obtaining more accurate signals to detect potential trend reversals.
This indicator is designed to be compatible with a wide range of financial instruments, offering real-time alerts and customizable parameters, making it a flexible and valuable addition to your set of technical analysis tools.
The arrows on the chart correspond to bullish and bearish signals generated by stochastic crossovers.
i-GAP Indicator
i-GAP is a user-friendly indicator designed for MT5, displaying arrows on the chart to indicate market gaps. It showcases two types of arrows, with one denoting a downward gap and the other an upward gap. By observing these arrows, traders can promptly evaluate the prevailing market sentiment and direction.
The indicator performs optimally on lower timeframes, like 1-minute or 30-minute charts, since gaps typically emerge following significant news releases.
By using this indicator, traders can consistently identify crucial price levels and anticipate potential areas of price fluctuations in any market.
MACD Divergence Indicator
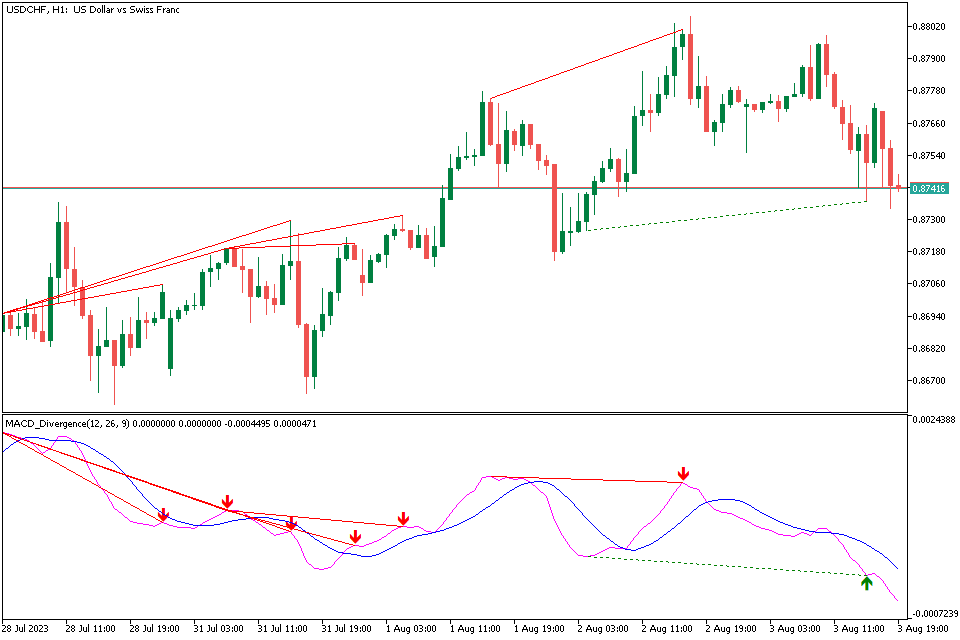
The moving average convergence divergence (MACD) is a widely recognized technical indicator employed by forex analysts, day traders, and long-term investors alike. It serves as a momentum indicator primarily utilized to assess market sentiment and identify prevailing market trends.
The MACD comprises two lines. When the MACD line diverges from the signal line and/or the asset’s price, it indicates a possible change in the current trend.
Similar to other divergences observed on price charts, MACD divergence is a valuable tool for identifying trading opportunities. However, it is essential to view it as distinct from a complete forex trading strategy. Rather, it should be regarded as an additional confluence trading technique that aids in detecting market anomalies and, consequently, identifying potentially profitable trades.
ADX Crossing MA Indicator
The “ADX Crossing MA Indicator” is a technical analysis tool used in trading to identify potential trend changes and generate signals based on the crossing of the Average Directional Index (ADX) and a Moving Average (MA).
The ADX Crossing MA Indicator generates signals when the ADX line crosses above or below the Moving Average line.
Traders use the ADX Crossing MA Indicator to identify possible trend changes, confirm trend strength, and make informed decisions about when to enter or exit positions.
TD Sequential Ultimate Indicator
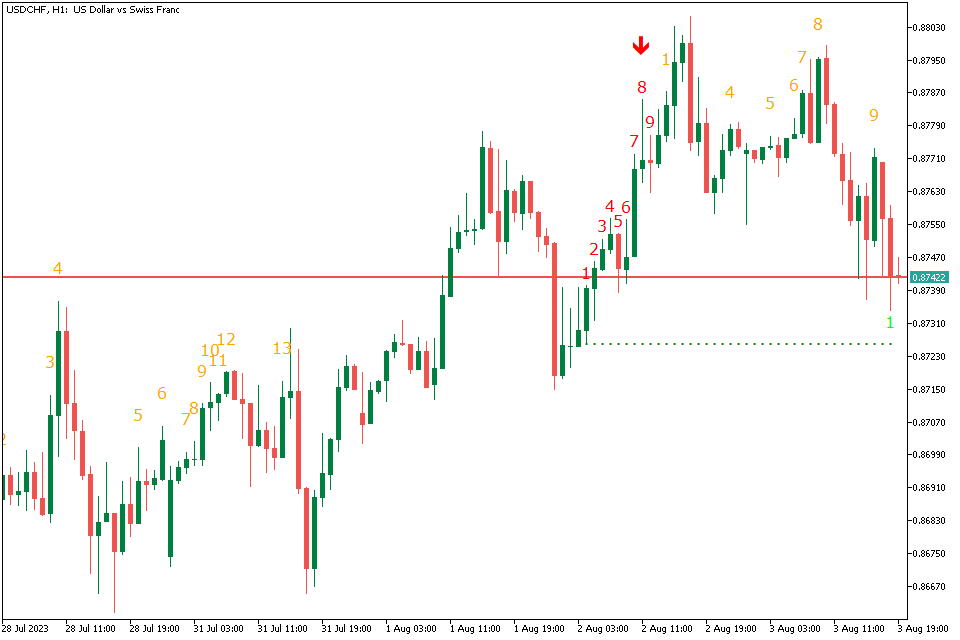
TD Sequential Ultimate incorporates all aspects of Tom DeMark’s renowned technical analysis approach, which is used to forecast potential trend reversal scenarios.
This indicator serves as a comprehensive tool for identifying shifts in price momentum. It applies the theory of bar counting based on their highs and lows to assess market biases.
For both trend-following and swing traders, detecting a new market trend early on is of utmost importance.
Moreover, this indicator is user-friendly, featuring simple trading rules, making it suitable for beginners in the forex and stock markets.
Fractal ZigZag No-repaint Indicator
The Fractal ZigZag (No Repaint) Indicator provides accurate market predictions, offering traders a high level of confidence in their analysis.
It is both user-friendly and unique since it does not repaint, making it a valuable and reliable technical indicator for traders.
The Fractal Zigzag No Repaint indicator is a valuable addition to your trading toolkit. Incorporating effective forex indicators can increase your likelihood of success. However, it’s essential to maintain realistic expectations as you navigate the markets.
MACD With Alert Indicator
The “MACD With Alert Indicator” is a powerful technical analysis tool used in trading, which incorporates the Moving Average Convergence Divergence (MACD) indicator along with an alert system.
The MACD is a momentum indicator used to follow trends, aiding traders in determining the trend’s strength and direction. Comprising two lines, namely the MACD line and the signal line, this indicator provides valuable insights.
A bullish signal is generated when the MACD line crosses above the signal line, suggesting a potential upward trend. Conversely, when the MACD line crosses below the signal line, it produces a bearish signal, suggesting a possible downward trend.
3 MA Cross Alert Indicator
The “3 MA Cross Alert Indicator” is a technical analysis tool used in trading to detect potential trend changes based on the crossover of three Moving Averages (MAs).
Moving Averages are widely used trend-following indicators that smooth out price data over a specified period, helping traders identify the prevailing direction of the market.
When the shorter-term MA crosses above the medium-term MA and the medium-term MA crosses above the longer-term MA, it generates a “bullish crossover” signal, suggesting a potential uptrend. On the other hand, when the shorter-term MA crosses below the medium-term MA and the medium-term MA crosses below the longer-term MA, it produces a “bearish crossover” signal, indicating a potential downtrend
JF Engulfing Indicator
The JF Engulfing Indicator is a precise tool designed to identify engulfing patterns on charts. Engulfing candles frequently signal trend reversals, presenting potential opportunities for traders to capitalize on.
This indicator displays buy/sell arrows whenever a signal occurs, making it a valuable resource for traders seeking to detect and act upon these significant price patterns.
An engulfing pattern occurs when one candle fully engulfs the entire body of the previous candle. Detecting such patterns can be done manually, or you can opt for an automated tool to do it for you. This is where the JF Engulfing indicator for MetaTrader 5 proves beneficial.
Sidus Indicator
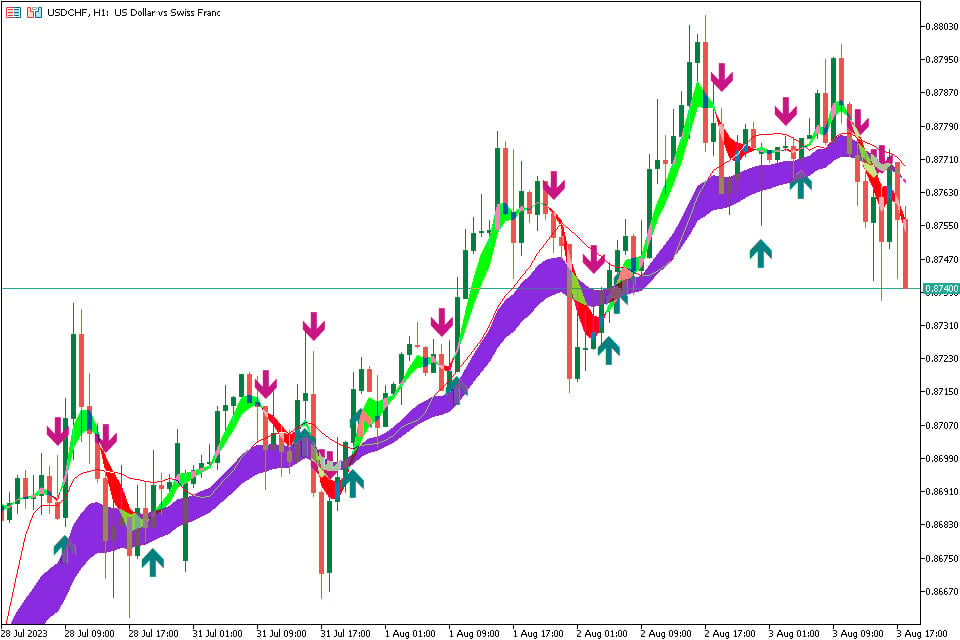
The Sidus Indicator is a technical analysis tool used in financial markets, particularly in forex trading. It is based on a combination of two moving averages and is designed to identify potential trends and trading signals.
The Sidus Indicator is composed of two main components: the Fast Moving Average and the Slow Moving Average. When the fast moving average crosses above the slow moving average, a buy signal is generated. Conversely, a sell signal is triggered when the fast moving average crosses below the slow moving average.
Traders often use the Sidus Indicator as part of a comprehensive trading strategy, combining it with other technical indicators or price patterns to validate signals and minimize false signals.
Summing-up
In conclusion, arrow indicators play a significant role in the world of financial markets, offering traders valuable insights into potential entry and exit points. These indicators, represented as arrows on price charts, indicate the direction traders should consider taking action, whether it’s buying or selling a financial instrument.
Arrow indicators serve as valuable tools in the arsenal of traders, helping them navigate the complexities of financial markets and improve their trading performance when used in conjunction with other analytical techniques and a disciplined approach to risk management.