

Indicators play a crucial role in forex trading, serving as indispensable tools for traders in the market. These indicators are employed by numerous forex traders on a daily basis, aiding them in gauging opportune moments for buying or selling within the forex market. Referred to as a pivotal component of technical analysis, these indicators hold significance for both technical and fundamental analysts alike.
Engaging in forex trading entails tackling a multifaceted and dynamic venture, as traders must adeptly navigate the ever-shifting realm of currency valuations and economic cues. Amidst the challenging terrain of the forex market, equipping yourself with effective tools becomes imperative to maintain your bearings and evade mishaps.
This is precisely where technical indicators come into play – akin to a reliable guide, they offer direction and alert you to potential challenges, ensuring you traverse the path with vigilance and strategy.Join our journey as we delve into the Top 20 best indicators, illustrating their opportunities and demonstrating how they can be integrated to your trading arsenal.
TOP 20 Forex MT4 Indicators
- Lucky Reversal Indicator
- Volume Profile Indicator
- Order Block Breaker Indicator
- Buy Sell Magic Indicator
- FXSSI.StopLossClusters Indicator
- Super Arrow Indicator
- Elliott Wave Count Indicator
- Supply Demand Zones Indicator
- Chandelier Exit Indicator
- Currency Power Meter Indicator
- FXSSI.TradingActivity
- MACD 2 Line Indicator
- Half Trend Buy Sell Indicator
- Auto TrendLine Indicator
- Support & Resistance Indicator
- Fibonacci Retracement Indicator
- Show Pips Indicator
- Qualitative Quantitative Estimation Indicator
- Forex Reversal Indicator
- VWAP Bands Indicator
Lucky Reversal Indicator
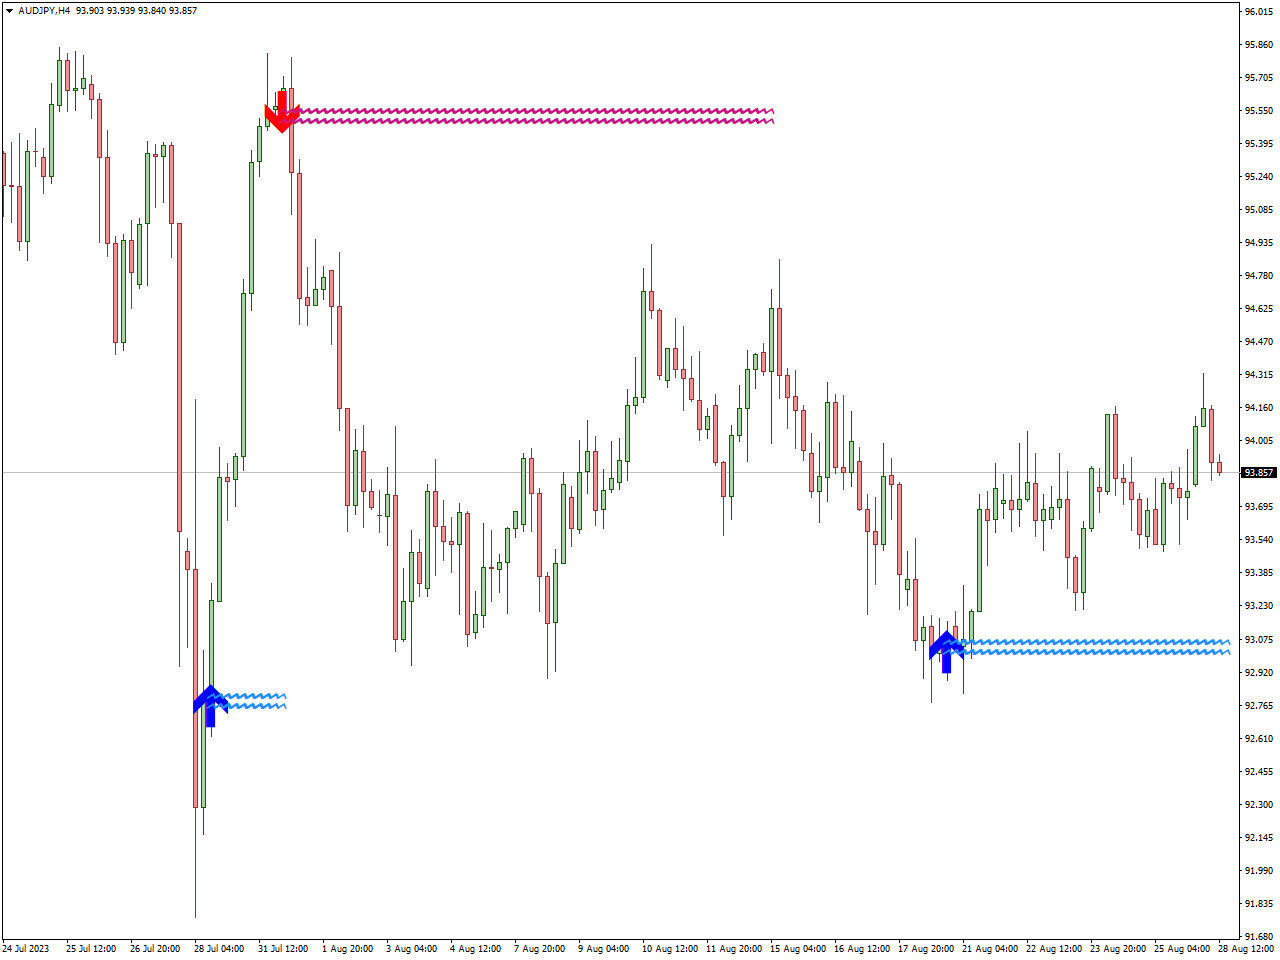
The Lucky Reversal indicator is a tool employed in trading to identify potential reversals in market trends. By analyzing price movements and patterns, the indicator aims to provide traders with insights into moments when a prevailing trend might shift its direction.
Presenting its signals through buy and sell arrows on the primary chart, the Lucky Reversal MT4 indicator serves to enhance forex trading by providing supplementary validation for entry and exit points within a variety of trading systems and strategies.
The “Lucky Reversal” indicator’s effectiveness lies in its ability to help traders anticipate changes in market sentiment, facilitating more informed trading decisions. As with any trading tool, prudent utilization and integration into a comprehensive trading strategy are essential for maximizing its benefits.
Volume Profile Indicator
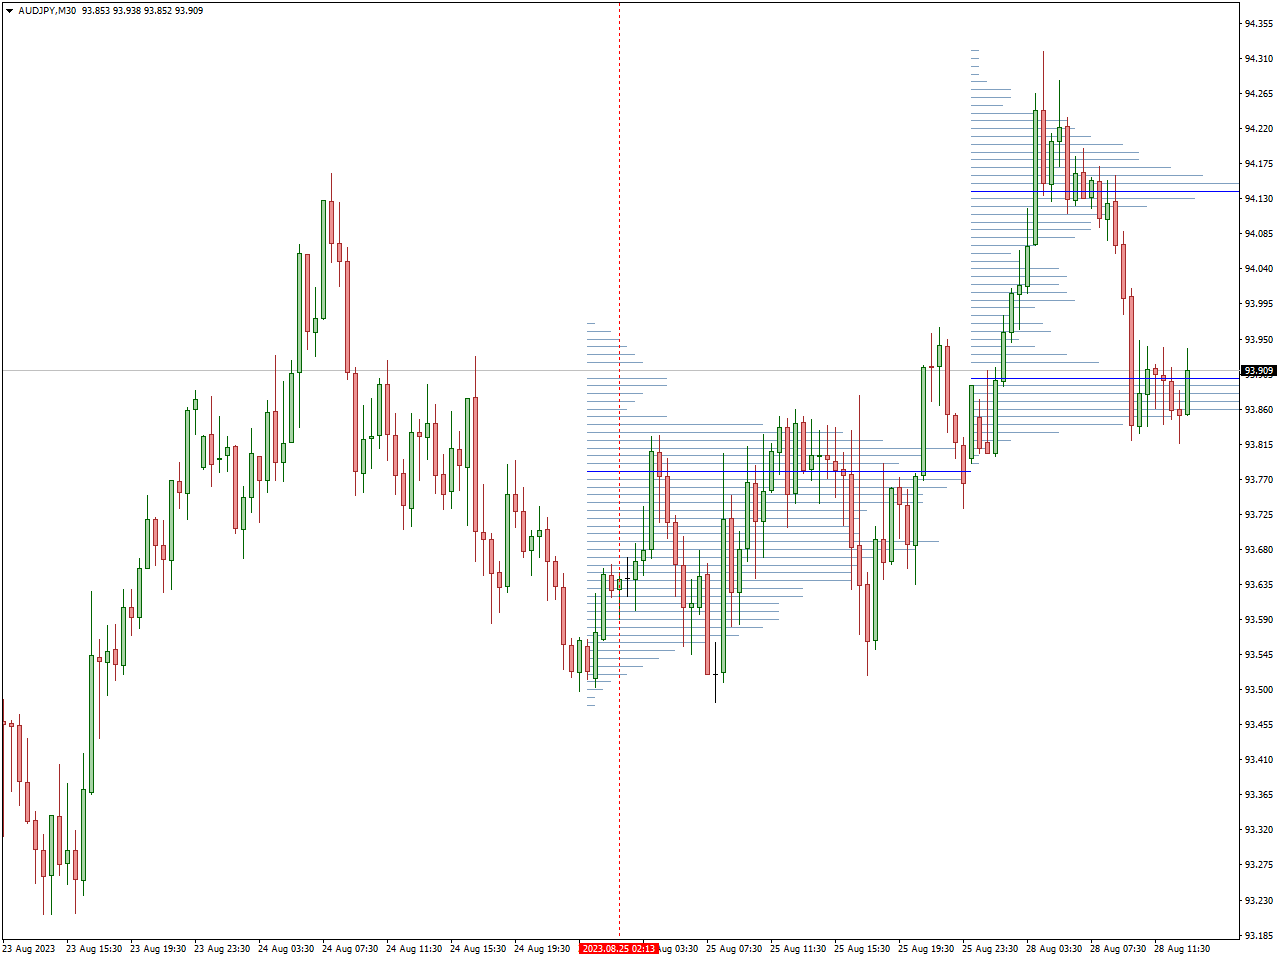
The Volume Profile Indicator serves as a trading and technical analysis tool, presenting the trading volume registered at distinct price levels during a designated timeframe. By visualizing the volume distribution across a range of prices, it aids traders in pinpointing significant support and resistance regions, zones of heightened activity, and prospective breakout junctures.
Utilizing the Volume Profile Indicator, traders acquire valuable perspectives on market dynamics, validate price trends, and evaluate the potency of price shifts. This comprehension of noteworthy trading activity empowers traders to enhance their decision-making regarding entry and exit positions, while also allowing them to fine-tune their trading methodologies as needed.
This indicator is particularly useful in markets where volume plays a crucial role, such as futures and stocks, as it can provide a deeper understanding of the supply and demand dynamics at different price levels. Integrating the Volume Profile Indicator into a comprehensive trading approach can enhance a trader’s ability to identify strategic trading opportunities.
Order Block Breaker Indicator
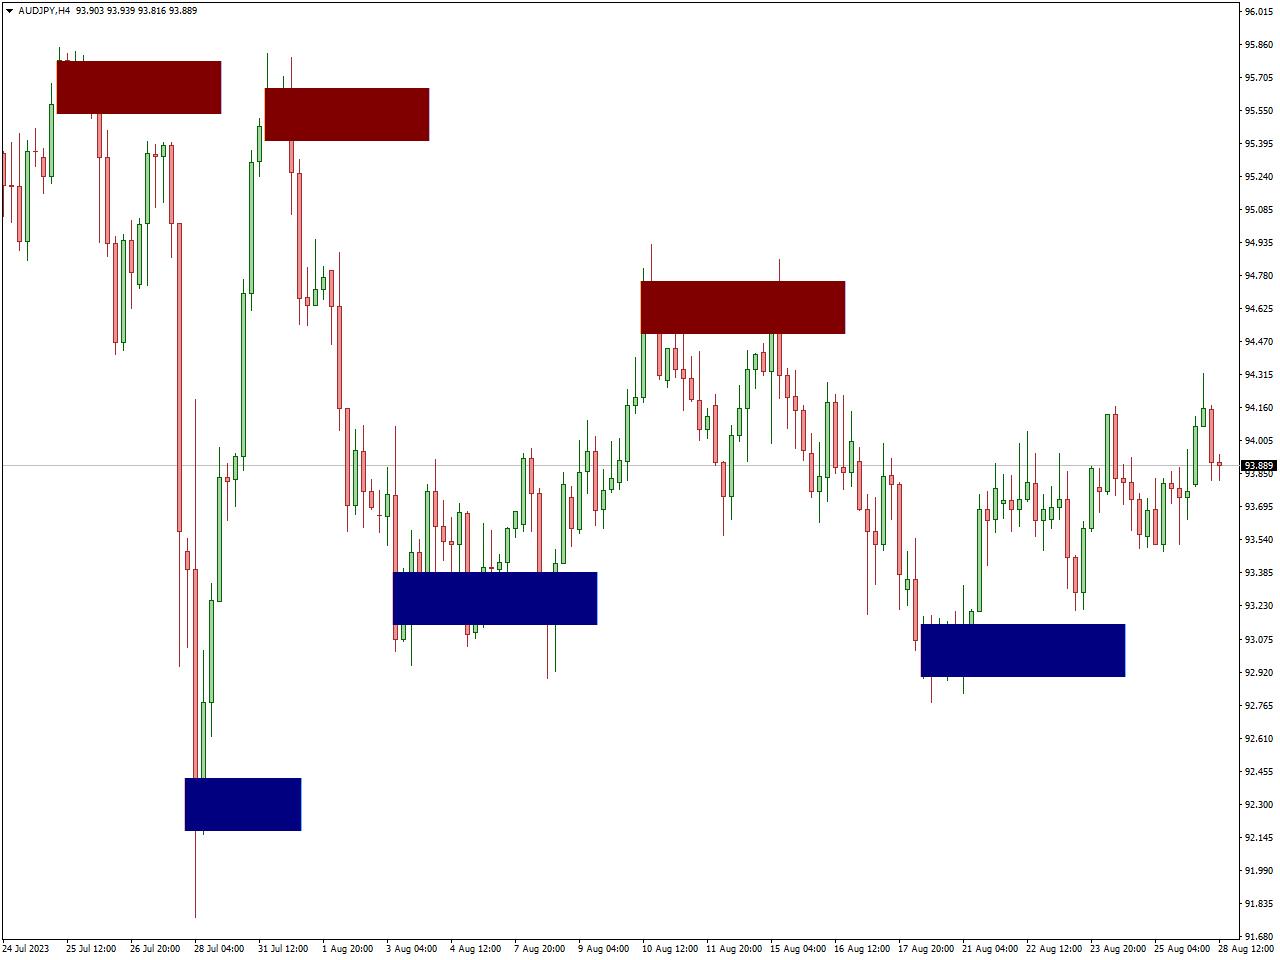
The Order Block Breaker constitutes a trading approach and indicator designed to pinpoint and engage with pivotal price levels referred to as “order blocks.” These order blocks denote price consolidations where institutional traders execute their buy or sell orders. The objective of the Order Block Breaker indicator is to exploit potential price shifts, either through reversals or continuations, that materialize upon breaching these order block zones.
Traders who employ the Order Block Breaker indicator often look for key support and resistance levels, which correspond to the order blocks. When price breaks above a resistance order block or below a support order block, it is seen as a potential trading opportunity.
This indicator underscores the significance of pinpointing zones where institutional traders have positioned their orders, given their potential to impact forthcoming price shifts. It amalgamates technical analysis with a comprehension of market psychology and the dynamics of order flow.
Buy Sell Magic Indicator
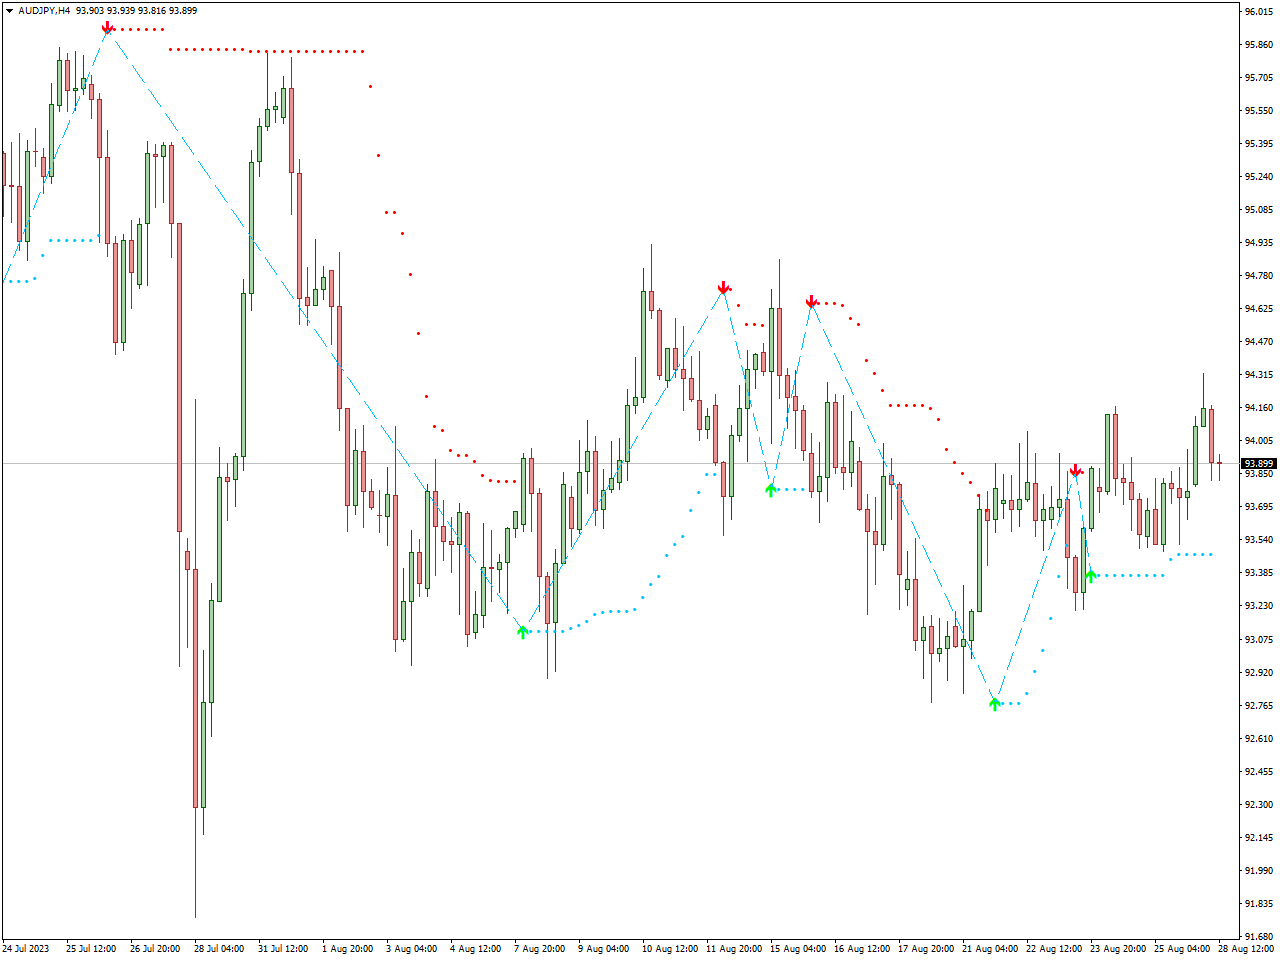
The Buy Sell Magic Indicator is a trading tool designed to aid traders in identifying potential buy and sell signals within the market. This indicator utilizes a combination of technical analysis techniques to generate signals that suggest optimal entry and exit points for trading positions.
Traders who make use of the Buy Sell Magic Indicator commonly depend on its signals to make well-informed choices regarding the timing of trade entries and exits. This indicator could offer visual indicators like arrows or alterations in color on price charts, signifying instances when a potential opportunity to buy or sell emerges.
Nonetheless, akin to all trading tools, the efficacy of the Buy Sell Magic Indicator hinges on its compatibility with a trader’s comprehensive strategy, risk management practices, and grasp of market conditions. Prior to seamlessly incorporating this indicator into their trading methodology, traders should diligently undertake exhaustive testing and analysis.
FXSSI.StopLossClusters Indicator
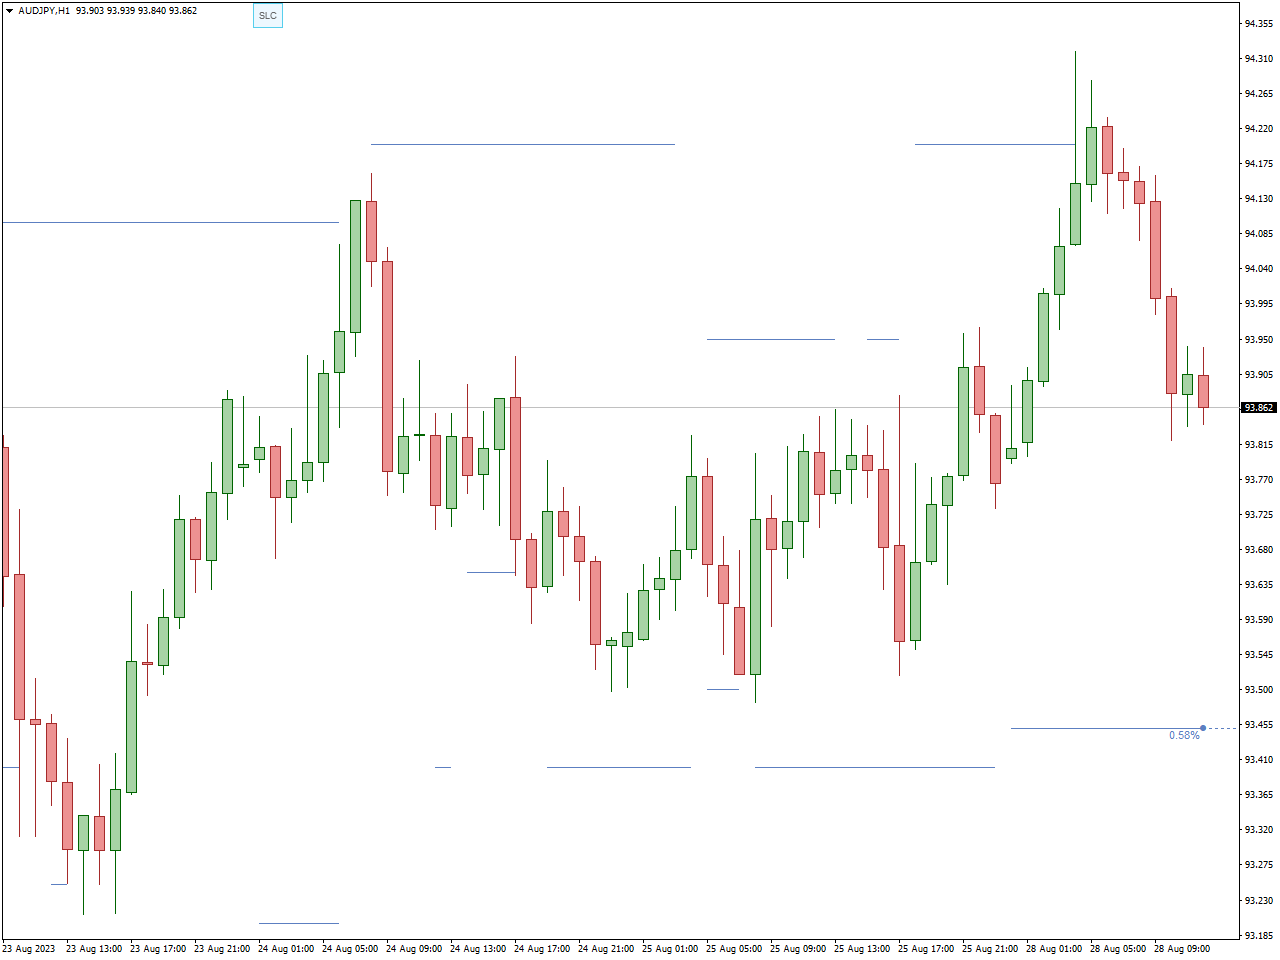
The Stop Loss Clusters (SLC) indicator reveals the concentrations where a majority of market participants have positioned their Stop Loss orders for their trades. This indicator showcases the most significant accumulations of these orders, referred to as clusters, directly on the chart within the MT4 terminal.
A cluster, or accumulation, represents a confined range along the price scale of an asset, containing a substantial number of Stop Loss orders established by other participants in the market.Typically, these clusters manifest at local price highs and lows, or at prominent support and resistance levels.
The thickness of the SLC indicator line displayed on the chart corresponds to the overall volume of the cluster. This mechanism imparts a third dimension (the cluster volume) to the chart, effectively simulating a heat map.
Super Arrow Indicator
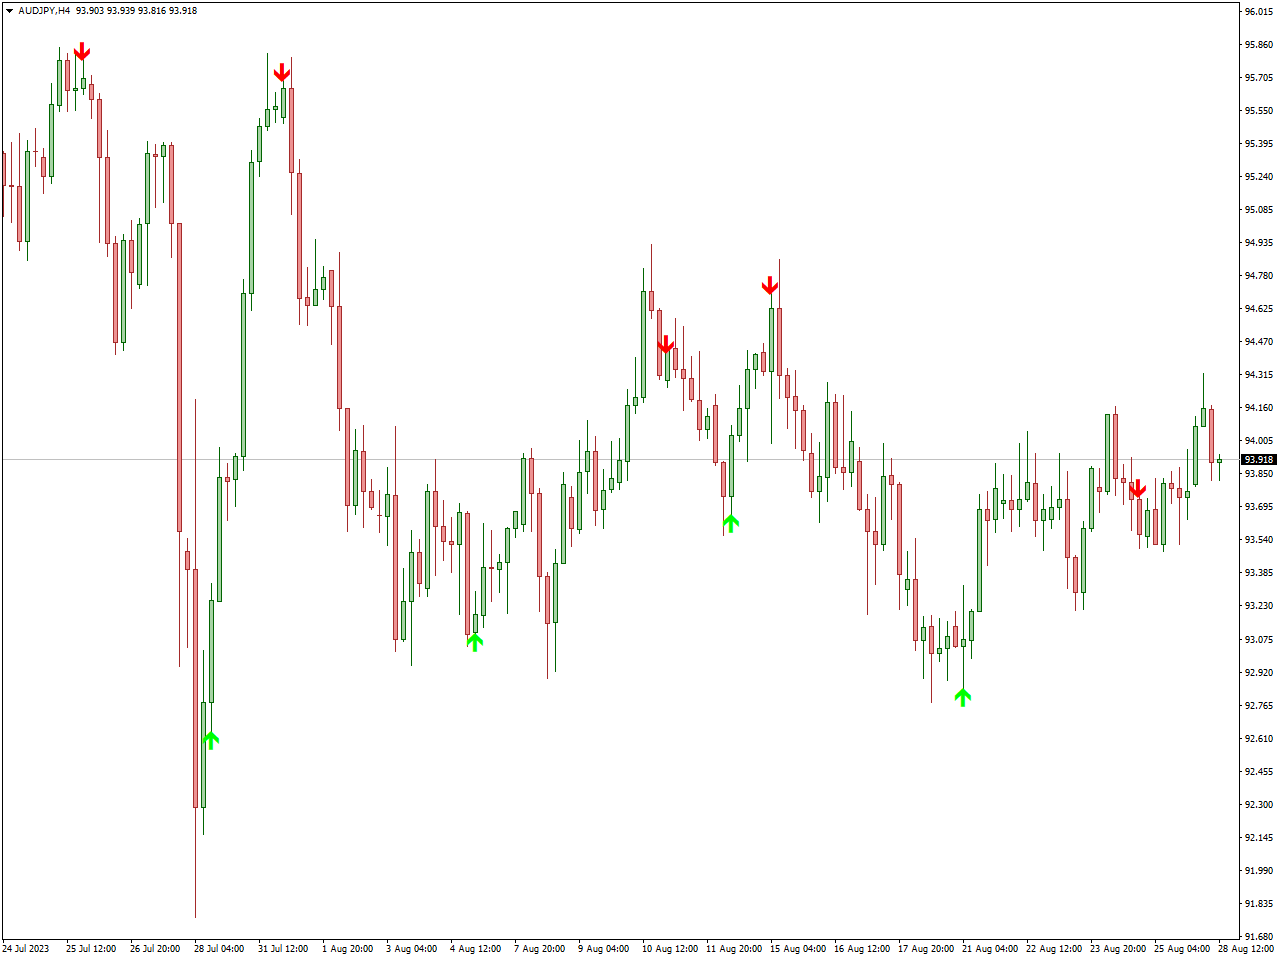
The Super Arrow Indicator is a tool utilized in trading to pinpoint potential buy and sell signals with heightened accuracy. This indicator is engineered to offer traders visual cues, often in the form of arrows, which signify moments when favorable trading opportunities may arise.
Traders who incorporate the Super Arrow Indicator into their analysis generally depend on these signals to make informed decisions about initiating trades or closing positions. These arrows, typically displayed on price charts, help identify instances when market conditions align with a potential upward or downward price movement.
In summary, the Super Arrow Indicator is a trading tool that offers clear visual signals, often presented as arrows, to help traders identify potential entry and exit points in the markets. It simplifies decision-making by highlighting possible trading opportunities.
Elliott Wave Count Indicator
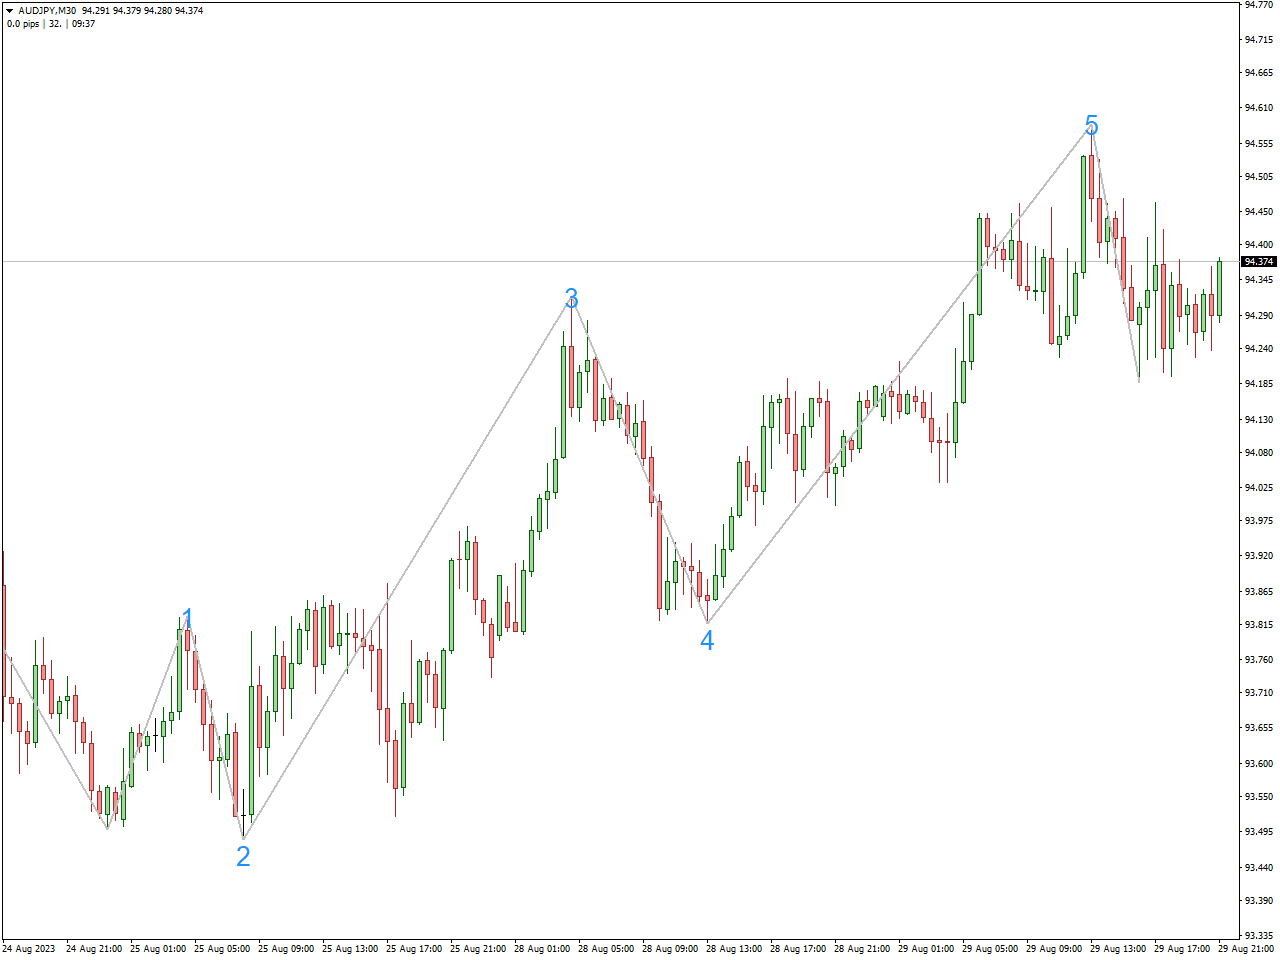
The Elliott Wave Count Indicator is a sophisticated tool designed to aid traders in applying the Elliott Wave Theory to their technical analysis and decision-making processes. Rooted in the concept of market cycles and psychology, the Elliott Wave Theory proposes that price movements in financial markets follow repetitive wave patterns that can be predicted and analyzed.
Unlike manual wave counting, which can be time-consuming and prone to subjectivity, the Elliott Wave Count Indicator aims to provide a more objective and efficient approach. It can help traders quickly spot potential wave patterns, determine the wave count, and assess the potential targets and levels of support and resistance associated with each wave.
Elliott Wave Count Indicator represents a modern application of a classic trading theory. It aims to simplify the complex Elliott Wave analysis process, providing traders with a tool to potentially enhance their understanding of market trends and turning points. However, traders should exercise caution and continue to build a well-rounded trading strategy that accounts for a variety of factors influencing market behavior.
Supply Demand Zones Indicator
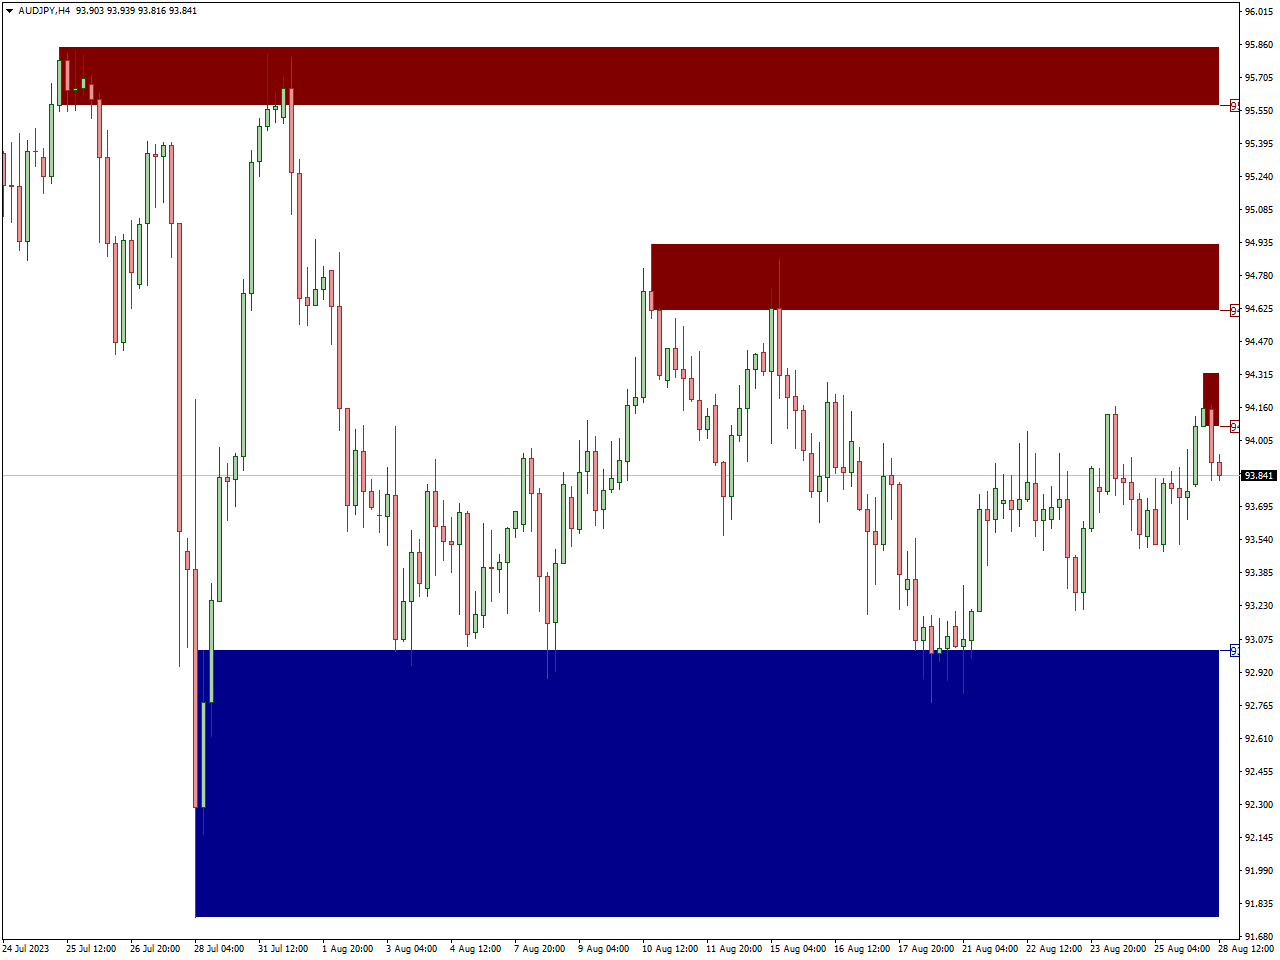
Supply Demand Zones Indicator is a tool used in trading to identify areas on a price chart where supply (sellers) and demand (buyers) imbalances may be present.
These zones highlight potential levels where the market sentiment could change, leading to reversals or significant price movements.
It’s important to highlight that effectively using this indicator necessitates a strong grasp of its mechanics, calculation methods, and how it aligns with your broader trading approach. Before integrating any trading tool or strategy into your trading endeavors, it’s recommended to conduct thorough research and approach its application with careful consideration.
Chandelier Exit Indicator
The Chandelier Exit Indicator is a complex technical analysis tool designed to assist traders in identifying potential exit points for their trades. Named after the concept of a chandelier that hangs from the highest point, this indicator aims to help traders find optimal exit positions during both uptrends and downtrends.
This indicator dynamically adjusts its position based on market volatility. In essence, it helps traders follow the principle of letting their profits run while cutting losses short. During strong trends, the Chandelier Exit Indicator keeps a distance from the highest high attained, allowing for potential gains to accumulate. Conversely, during periods of increased volatility or reversals, the indicator tightens its distance from the highest high, aiming to provide an early exit and protect profits.
In summary, the Chandelier Exit Indicator is a versatile tool that can aid traders in making more informed decisions about exiting their trades. By dynamically adjusting to market conditions, it seeks to strike a balance between capturing gains and minimizing losses, which is a fundamental goal for successful trading.
Currency Power Meter Indicator
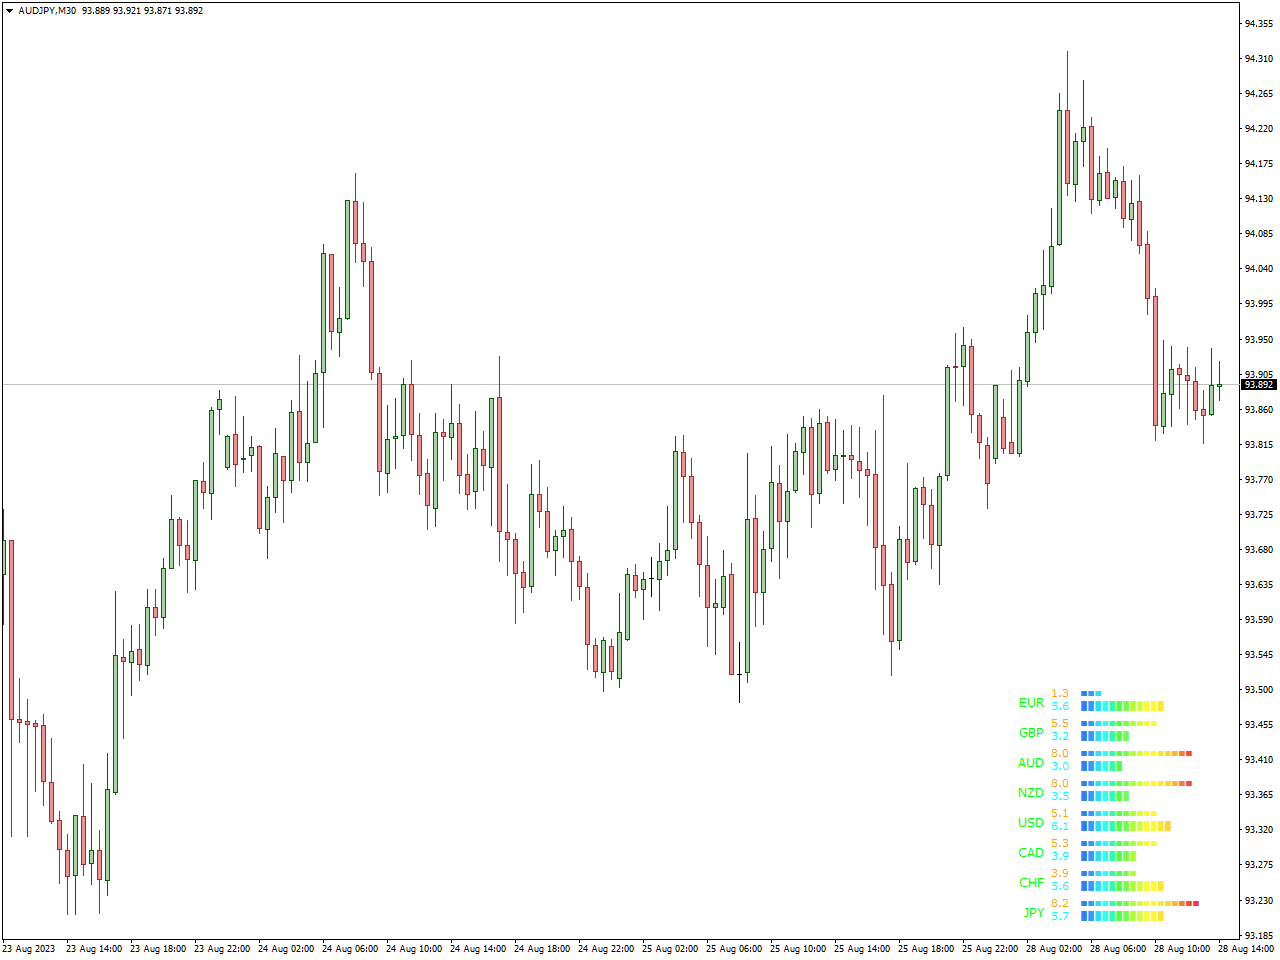
By analyzing the strengths and weaknesses of individual currencies, the Currency Power Meter Indicator assists traders in making informed decisions regarding currency pairs to trade. The indicator often displays these assessments in the form of a numerical ranking or visual chart, allowing traders to quickly identify which currencies are exhibiting strength and which are exhibiting weakness.
This indicator is particularly valuable for traders who engage in currency pair trading, as it provides insights into potential trends and reversals. For example, if a currency is consistently ranked as one of the strongest, it might be paired with a currency ranked as one of the weakest to identify potential buy opportunities.
The Currency Power Meter Indicator functions as a dynamic tool to assist traders in evaluating the relative potency of different currencies. By providing valuable insights into potential trading configurations and market trends, it empowers traders to cultivate a more strategic and knowledgeable approach to their forex trading endeavors.
FXSSI.TradingActivity
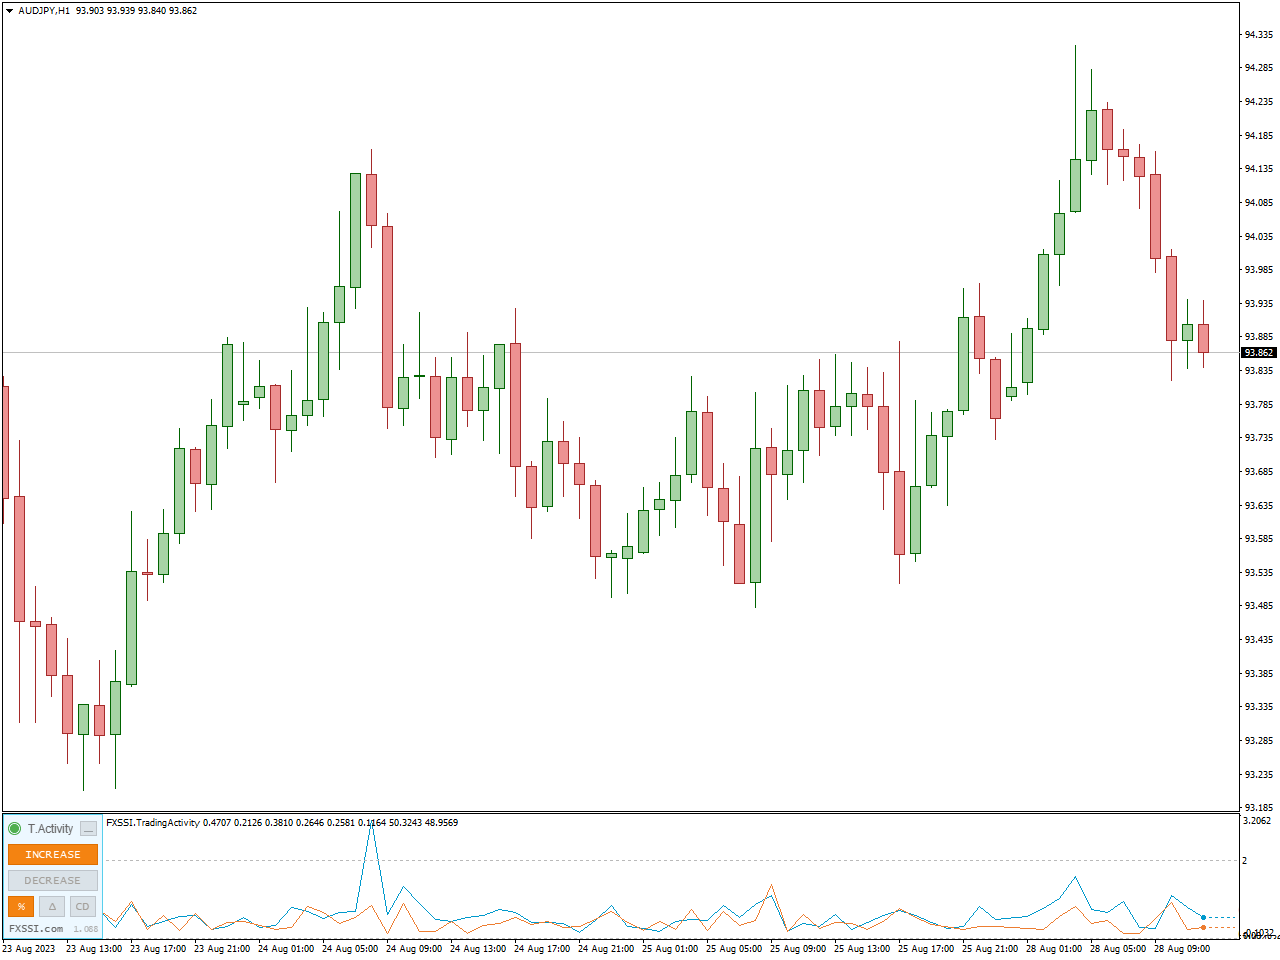
The TradingActivity indicator reveals shifts in the balance between sellers and buyers. It provides insight into the number of sellers/buyers who have initiated/concluded trades during the preceding period.
This indicator doesn’t necessitate intricate configurations; it’s ready for use out of the box. You only need to opt for a color scheme that aligns with your personal preferences.
Keep in mind that when utilizing trading indicators, it’s crucial to comprehensively grasp their intent, calculation methodology, and how they harmonize with your comprehensive trading approach. Prior to integrating any trading tool or strategy, consistently practice caution and conduct comprehensive research.
MACD 2 Line Indicator
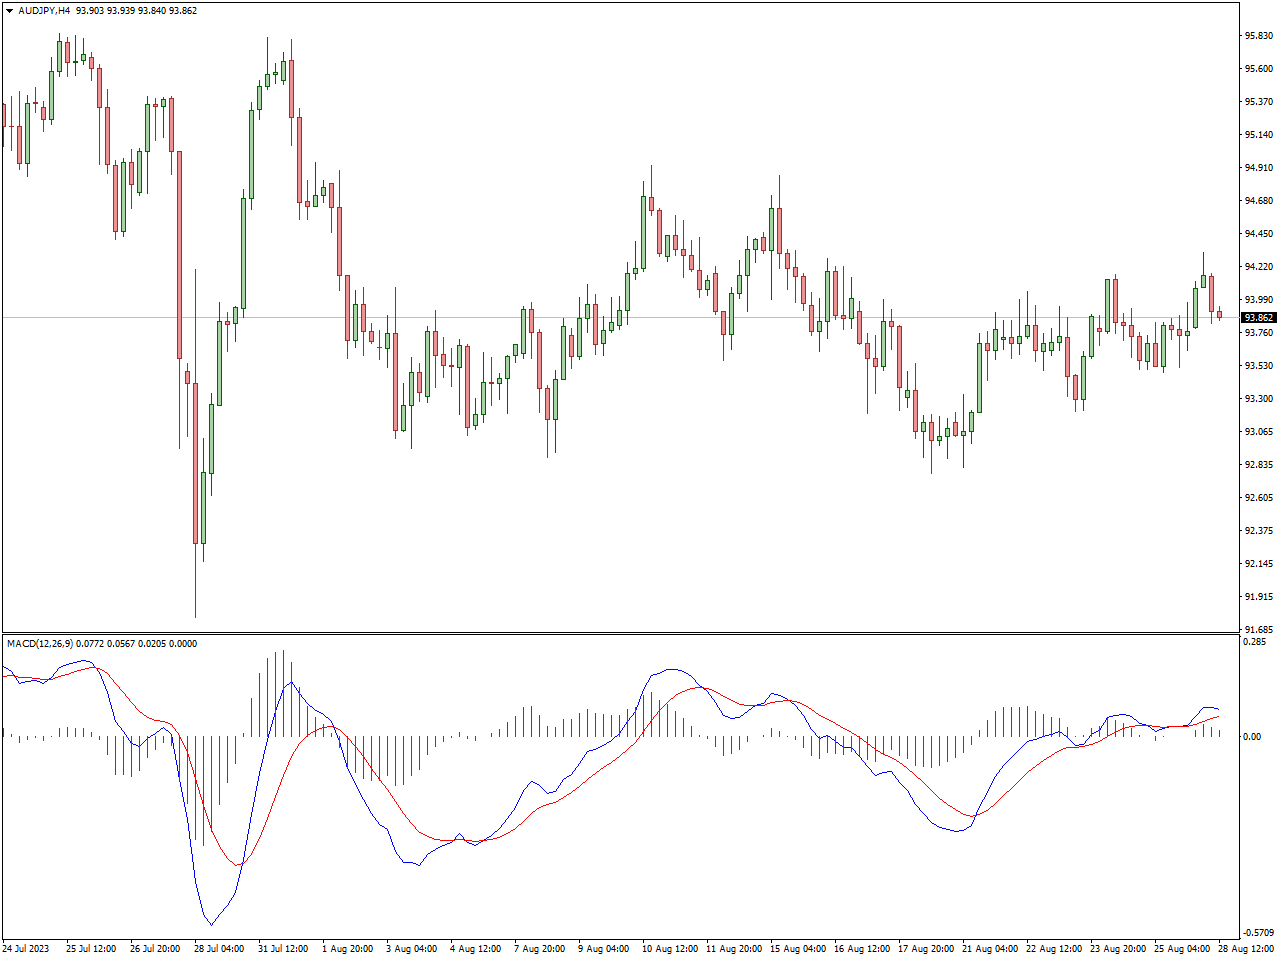
The MACD 2-line indicator, commonly known as MACD (Moving Average Convergence Divergence), holds a prominent place as a technical analysis tool, utilized by traders and investors to pinpoint potential trends and shifts in momentum within a security’s price movement. It is comprised of two distinctive components: the MACD line and the signal line.
Crossovers: Among the key techniques employed by traders utilizing the MACD indicator is the observation of crossovers between the MACD line and the signal line. A scenario where the MACD line rises above the signal line might indicate a potential “buy” or “long” signal, hinting at the possibility of a shift towards bullish momentum in the short term.
Divergence: Traders also pay heed to divergence between the MACD lines and the security’s price movement. If the security’s price records lower lows while the MACD is charting higher lows, this situation could imply an impending reversal towards a bullish trajectory.
In a nutshell, the MACD 2 Line Indicator is a trading tool that consists of two lines – the MACD line and the signal line. It helps traders identify trends and momentum shifts in security prices.
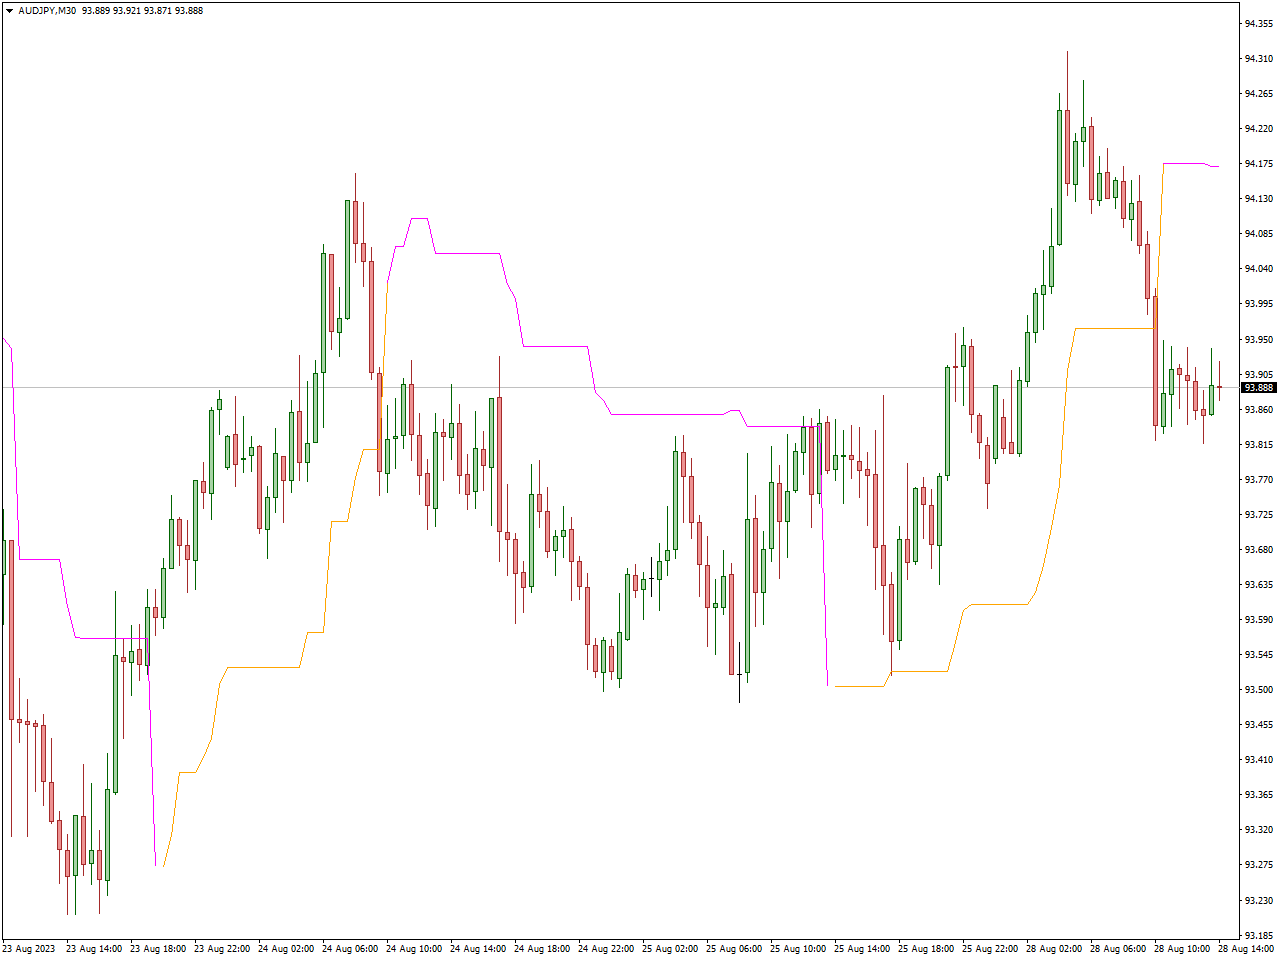
Half Trend Buy Sell Indicator
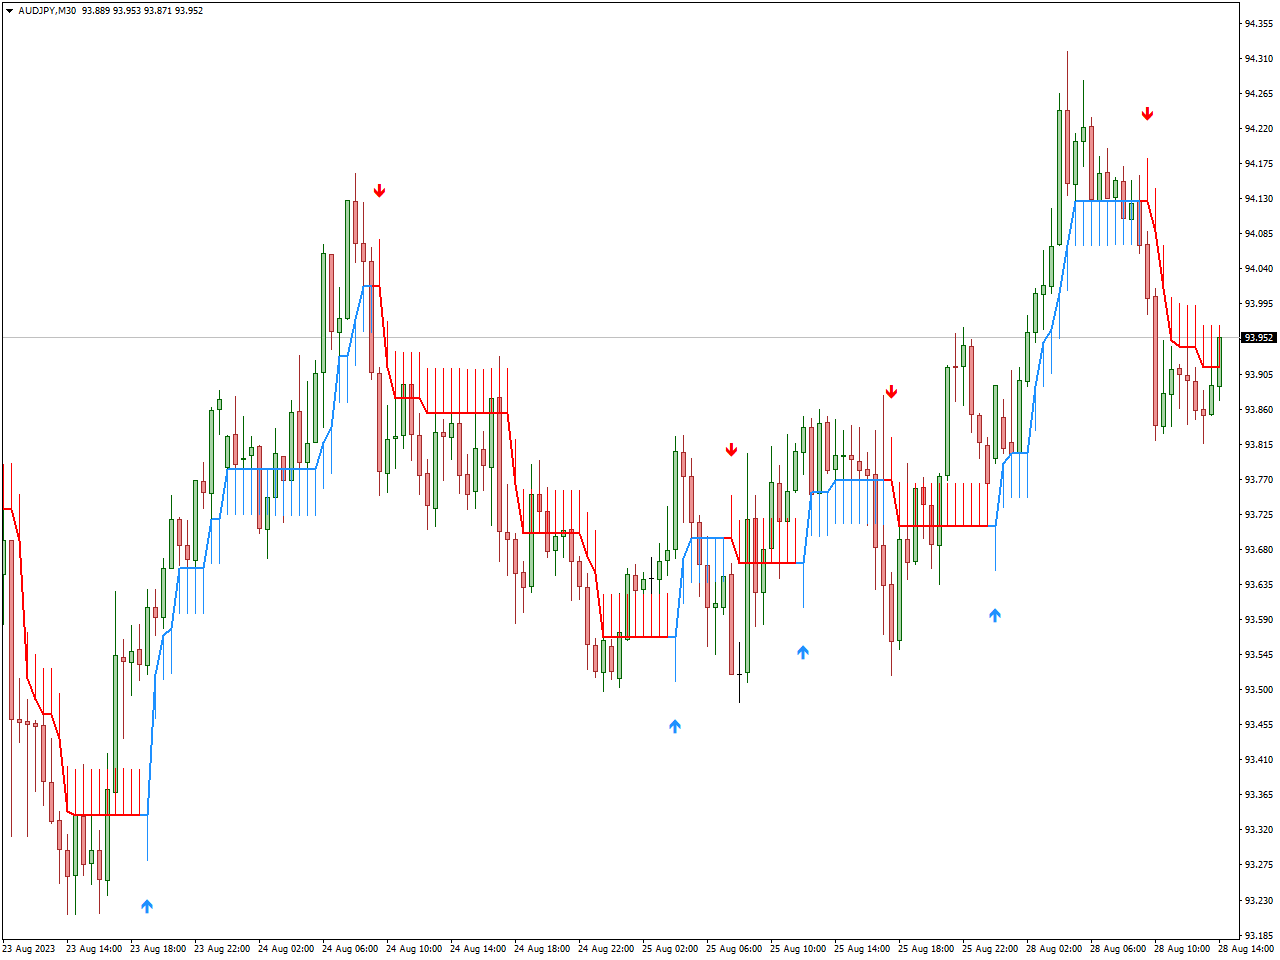
The Half Trend Buy Sell Indicator is a tool traders use to spot potential buy and sell cues in the market. It captures price trends and offers signals for trade entry and exit. Particularly valuable for “long” positions, where traders aim to profit from rising prices, the indicator aids in informed trading choices.
The half trend MT4 indicator derives precise signals through the utilization of moving averages. This trend-tracking tool is applicable across various time frames for successful intraday trading within the online forex market. Its live entry and exit arrow signals, which do not undergo repainting, position it as a favored trend trading instrument among forex traders.
Remember, relying solely on one indicator isn’t foolproof. Successful trading often involves combining various indicators and techniques to make informed decisions. Plus, the indicator’s effectiveness can vary with market conditions and traded assets. Practice on a demo account and grasp its behavior before integrating it into your strategy. Consulting experienced traders or financial experts can provide valuable insights.
Auto TrendLine Indicator
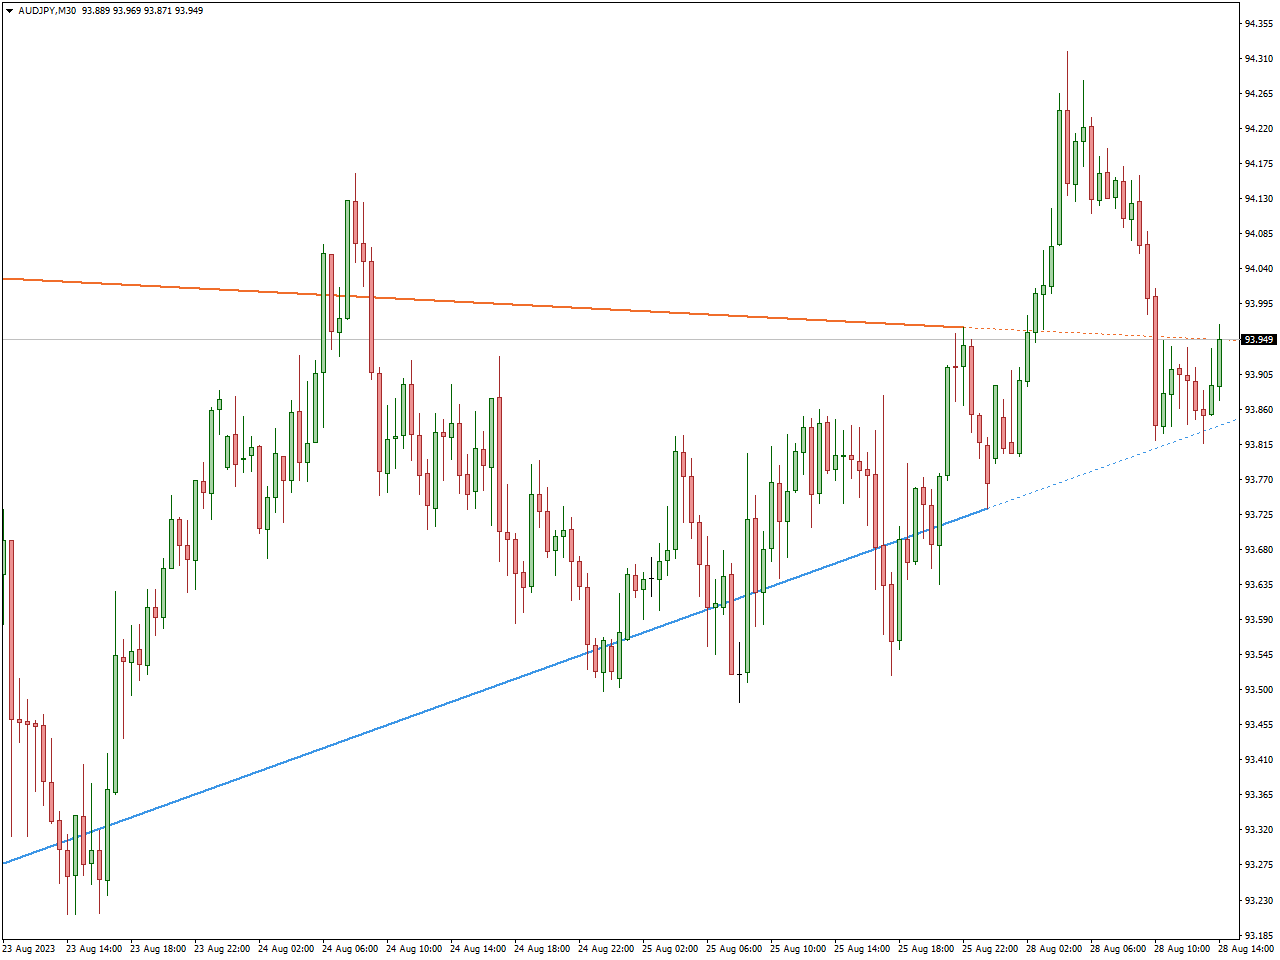
The Auto TrendLine Indicator functions as a technical aid by automatically sketching trend lines on price charts. This assists traders in recognizing trends and possible trading prospects. When contemplating “long” trading positions, which involve seeking gains from upward price movements, the Auto TrendLine Indicator can offer significant value.
The Auto TrendLine Indicator operates by autonomously generating trend lines on charts. These lines help visualize and define the direction of price trends, making it easier to spot potential entry and exit points.
For “long” trades, traders using the Auto TrendLine Indicator might consider exiting positions when the trend line shows signs of a reversal, such as changing its slope or being broken. Alternatively, predefined profit targets or trailing stop orders can be employed to lock in gains as prices rise.
Support & Resistance Indicator
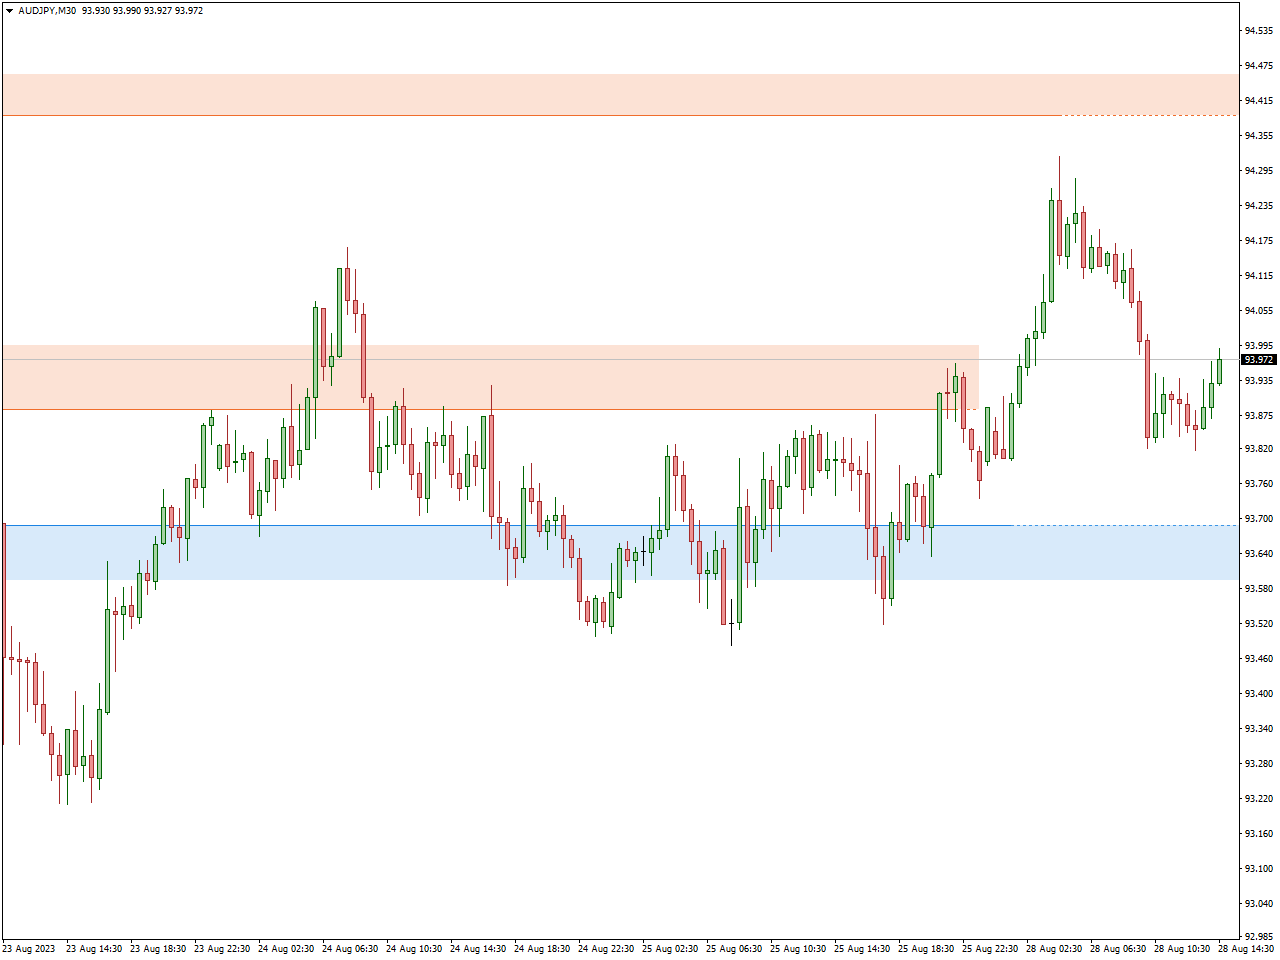
Traders often utilize the Support & Resistance Indicator to pinpoint crucial price levels where a financial asset is prone to encountering support (a level marked by heightened buying interest) or resistance (a level where selling pressure tends to escalate). This tool assists traders in identifying potential junctures at which market dynamics might shift, thereby contributing to their ability to make well-informed trading choices.
This tool aids traders in identifying junctures where trends might reverse, breakouts could materialize, or price movements might encounter a pause. Its foundation rests on the notion that historical price levels possess the ability to influence future price dynamics. Support and resistance levels are pivotal elements of technical analysis, and this indicator visually presents these levels on a price chart. Traders can leverage this insight to strategize entry and exit points, establish stop-loss and take-profit orders, and evaluate the potential risk and reward associated with a trade.
The Support & Resistance Indicator is a fundamental tool for traders seeking to anticipate price levels where markets may react.By identifying areas of potential support (buying interest) or resistance (selling pressure), this indicator offers valuable insights for planning entry and exit points, setting stop-loss and take-profit orders, and managing risk.
Fibonacci Retracement Indicator
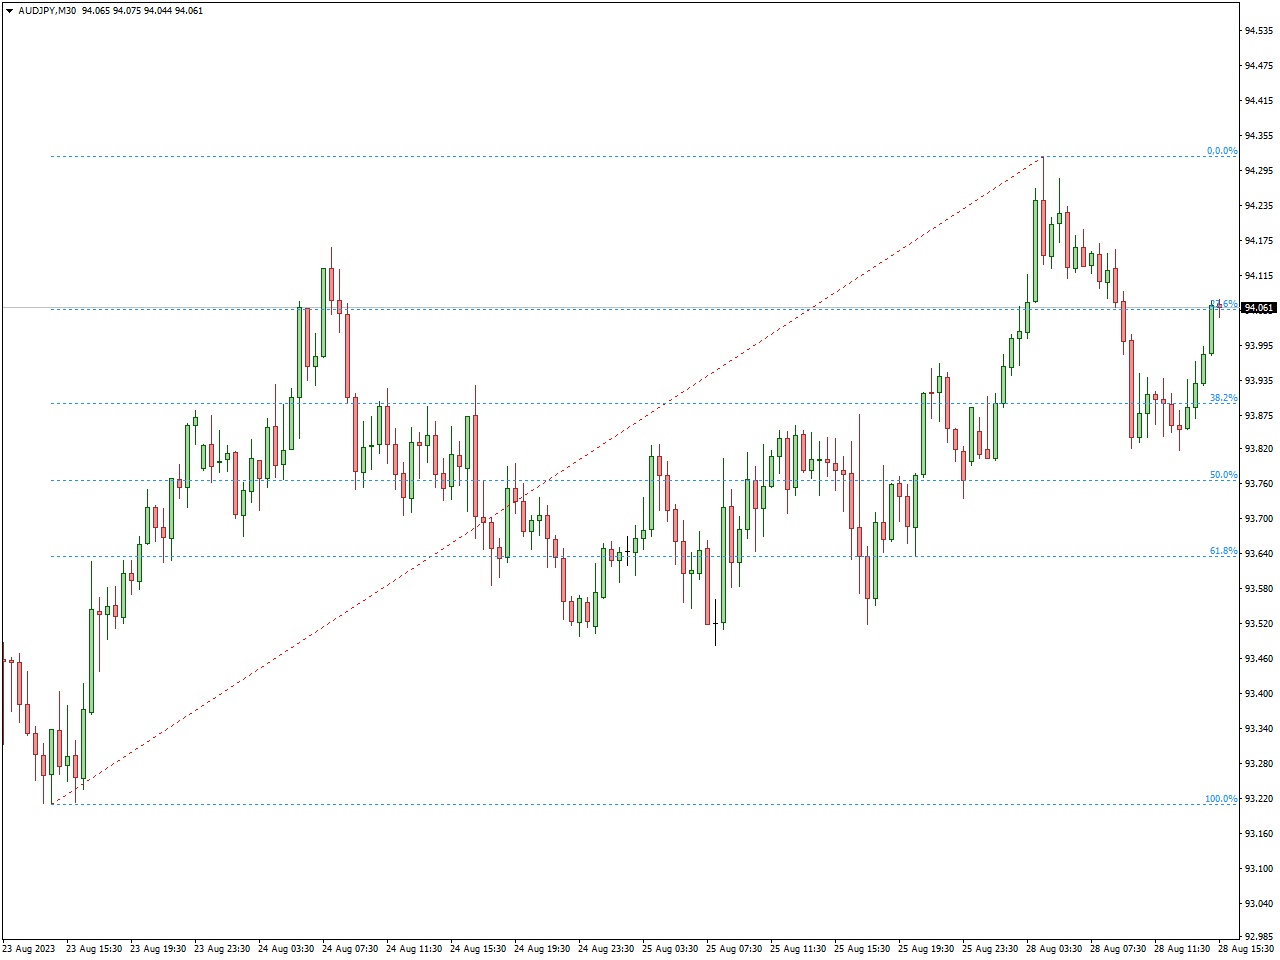
The Fibonacci Retracement Indicator is an indicator that traders use to spot possible support and resistance levels on a price chart. It relies on the Fibonacci sequence, a math pattern where each number is the sum of the two before it. When trading, this indicator helps find potential price levels where an asset might change direction or pull back in an ongoing trend.
As with any trading tool, it’s important to interpret the Fibonacci Retracement levels in the context of your overall trading strategy.
These levels are not definitive buy or sell signals; they provide potential areas where price might react due to historical market behavior. Combining this indicator with other technical and fundamental analyses can help you make more informed trading choices.
Show Pips Indicator
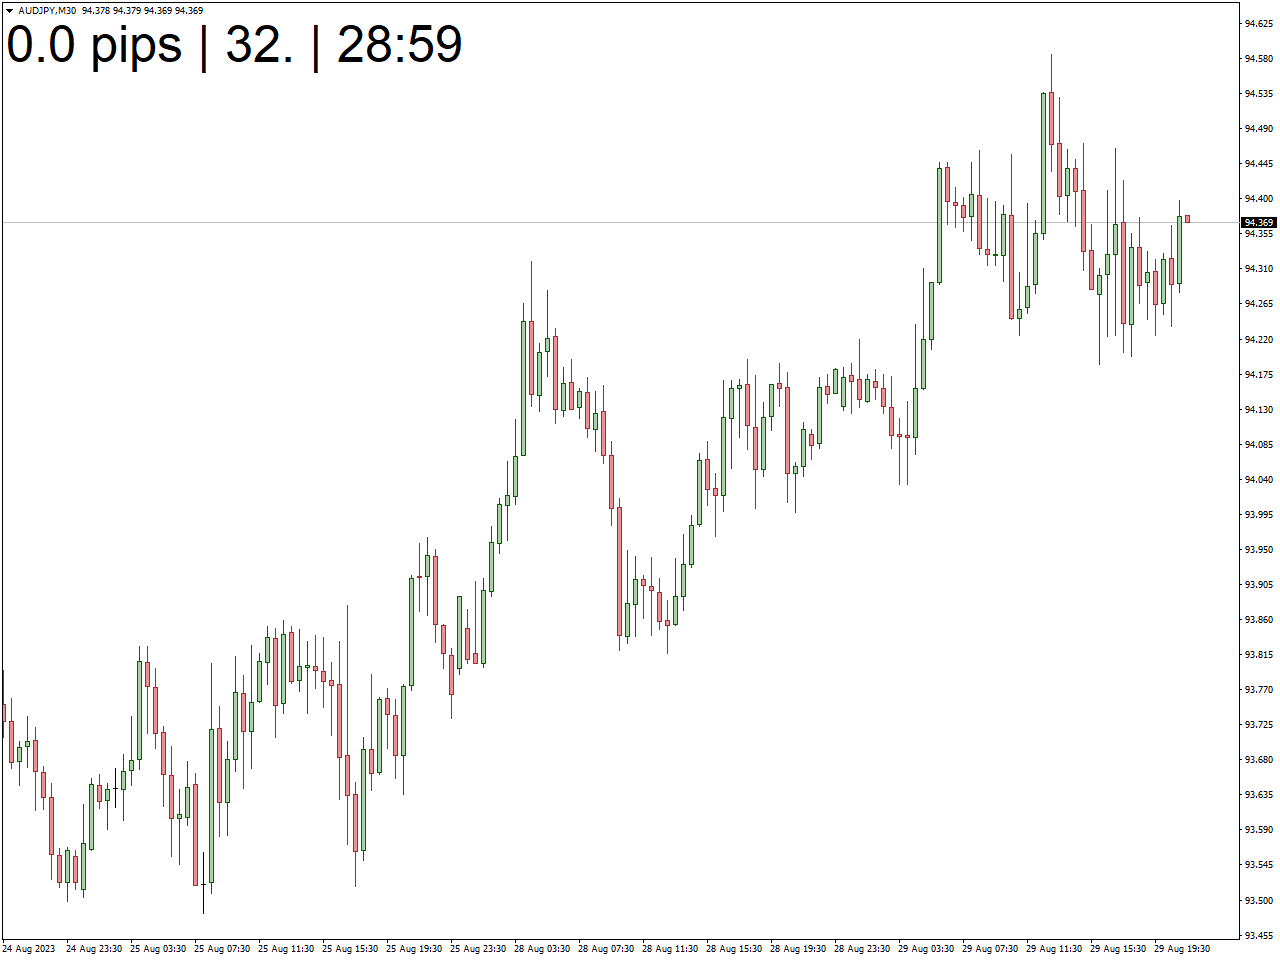
The Show Pips Indicator is a tool that displays the number of pips between two price points on a forex or trading chart.
Pips, abbreviated as “percentage in point” or “price interest point,” signify the tiniest price shift in a currency pair’s exchange rate. This indicator assists traders in swiftly gauging the space between prices, facilitating choices about establishing stop-loss and take-profit levels, and pinpointing potential entry and exit points for trades.
The “Show Pips Indicator” simplifies the process of measuring price movements in terms of pips, which is essential for risk management and trade strategy.
Qualitative Quantitative Estimation Indicator
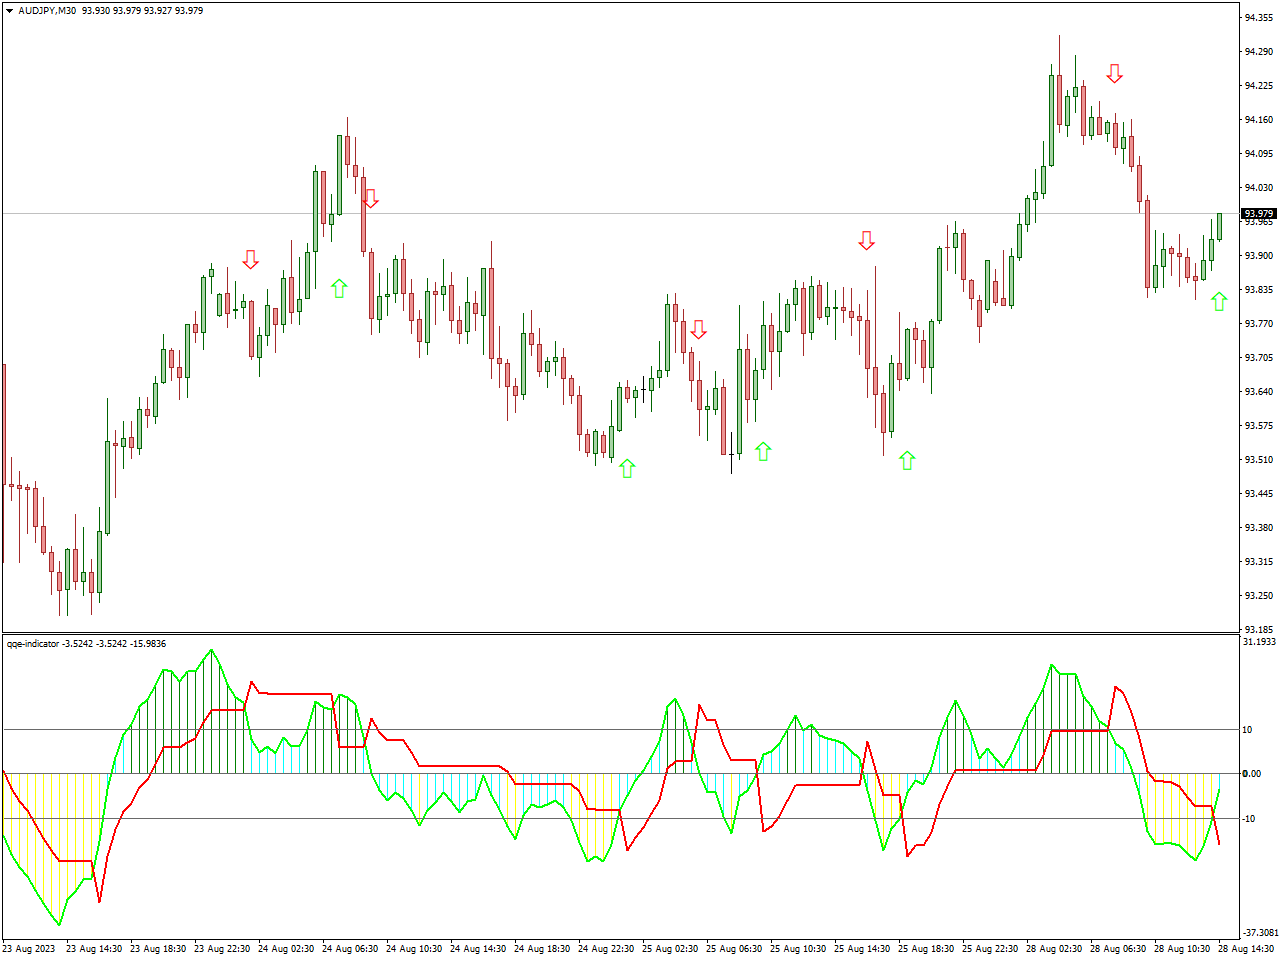
The Qualitative Quantitative Estimation (QQE) Indicator is a tool used by traders to assess both qualitative and quantitative aspects of price trends and momentum. When considering “long” trading positions, where traders anticipate upward price movements, the QQE Indicator can provide useful insights.
Crafted to merge qualitative and quantitative assessments of market trends, the QQE Indicator employs moving averages and smoothing techniques to gauge trend vigor and orientation, rendering it a versatile asset for traders.
When employing the QQE Indicator for “long” trades, traders may contemplate closing positions if the QQE line crosses beneath the signal line or if there are indications of a potential trend reversal. To secure gains as prices ascend, profit targets or trailing stop orders can also be enlisted.
Forex Reversal Indicator
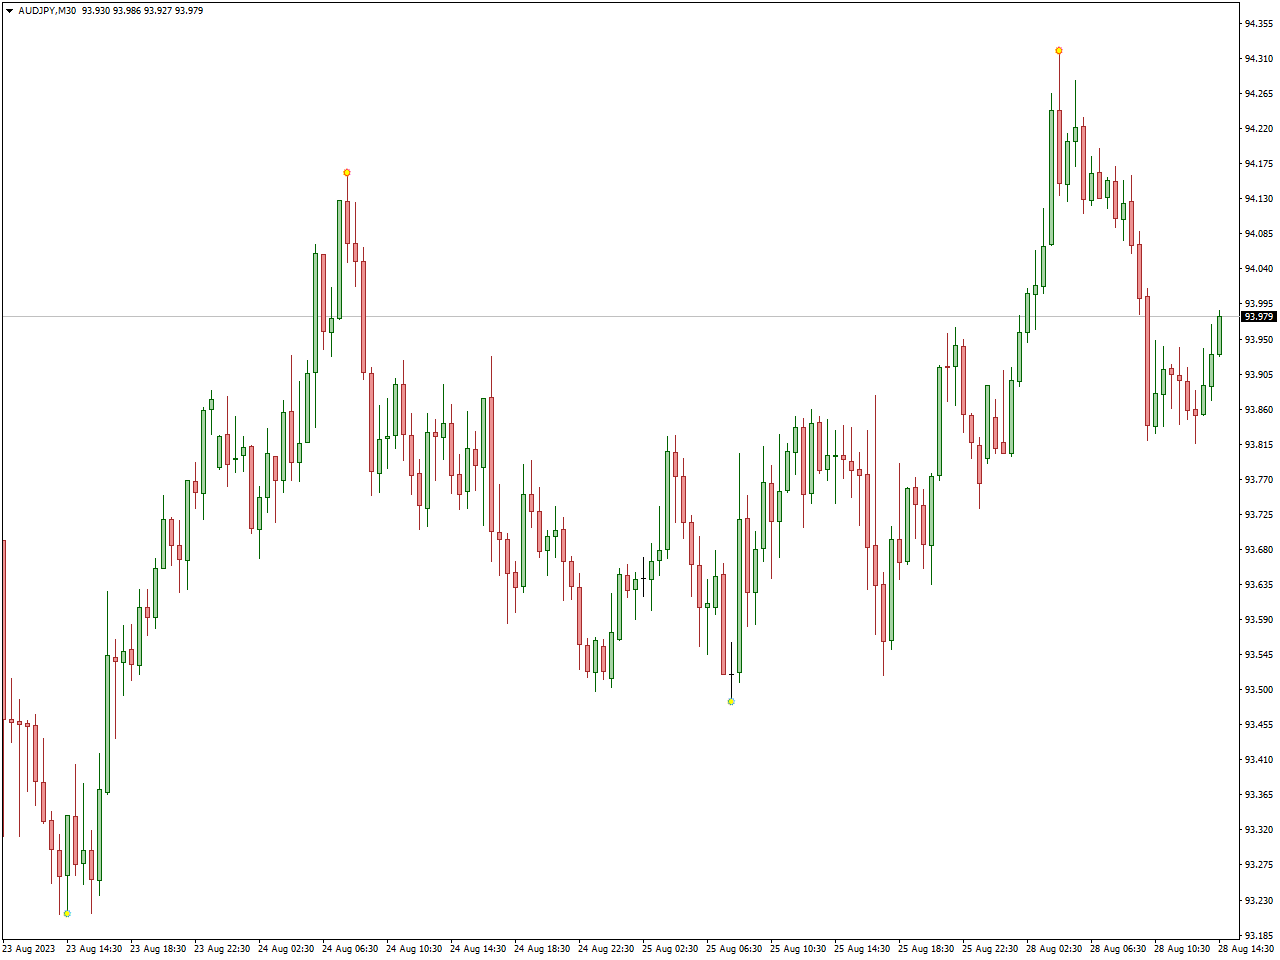
The Forex Reversal Indicator is a tool commonly employed by traders in the forex market to identify potential points where a prevailing trend might reverse its direction.
This indicator aims to highlight instances where an ongoing trend could potentially change, offering traders insights into potential reversal opportunities. It is utilized to assist in making trading decisions based on potential shifts in market sentiment and price direction.
Keep in mind that like any trading tool, the Forex Reversal Indicator should be used in conjunction with other indicators and analysis methods for a comprehensive trading strategy.
VWAP Bands Indicator
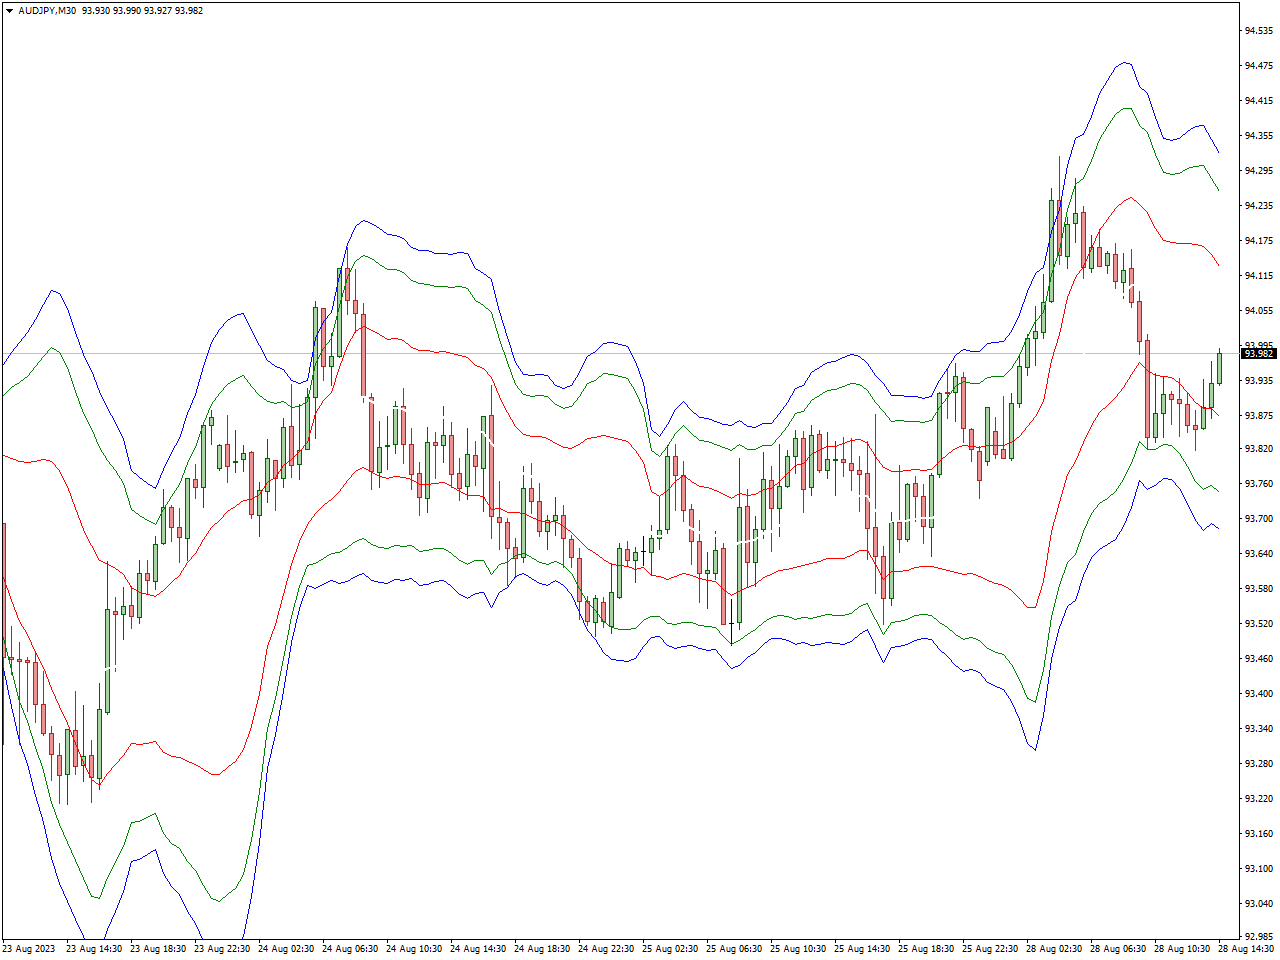
The VWAP Bands Indicator serves as a technical analysis instrument in traders’ arsenals, utilized to appraise the interplay between price and the Volume Weighted Average Price (VWAP). This indicator generates bands encircling the VWAP line, furnishing insights into plausible price levels where the market could encounter support or resistance.
Traders utilize the VWAP Bands Indicator to measure the potency of price shifts and pinpoint potential opportunities for buying or selling. It can emerge as a valuable asset for cultivating prudent trading judgments grounded in the interrelation of price, volume, and the VWAP.
Just like any other indicator, it’s crucial to evaluate it within the scope of a comprehensive trading strategy and to integrate diverse analytical approaches for signal validation.
Conlusion
The world of forex trading is enriched by an array of powerful indicators available on platforms like MetaTrader 4. These indicators offer traders an invaluable edge by providing insights into market trends, potential reversals, and entry and exit points. The best forex indicators are the ones that align with your trading strategy and complement your analytical approach.
Keep in mind that no single indicator is infallible, and prosperous trading encompasses more than just depending on technical tools. A comprehensive approach, including fundamental analysis, effective risk management, and staying informed about worldwide economic developments, is equally essential. By combining the potential of top forex indicators with a versatile strategy, traders can confidently and accurately navigate the intricate forex landscape.