

Embark on a journey to excel in day trading with our extensive guide on the most impactful indicators. In the dynamic landscape of day trading, maintaining a competitive edge necessitates a strategic approach, and these indicators serve as your gateway to well-informed decision-making. Whether you’re an experienced trader or a novice, this guide empowers you to navigate the markets with assurance and accuracy.
The foundation of prosperous day trading lies in indicators, offering valuable perspectives on market trends, volatility, and potential entry or exit points. Within this guide, we explore the premier indicators that can enhance your trading prowess, equipping you with the knowledge and tools essential for astute decision-making and profit maximization. Keep ahead of the curve with our expert insights and unlock the full potential of your trading endeavors.
Top 10 Day Trading Indicators
- TradingSessions Indicator
- Order Block Breaker Indicator
- Auto TrendLine Indicator
- Daily ATR Indicator
- Round Levels Indicator
- Spread Indicator
- Show Pips Indicator
- Volume Profile Indicator
- MA Crossover Alerts Indicator
- AO Divergence Indicator
TradingSessions Indicator
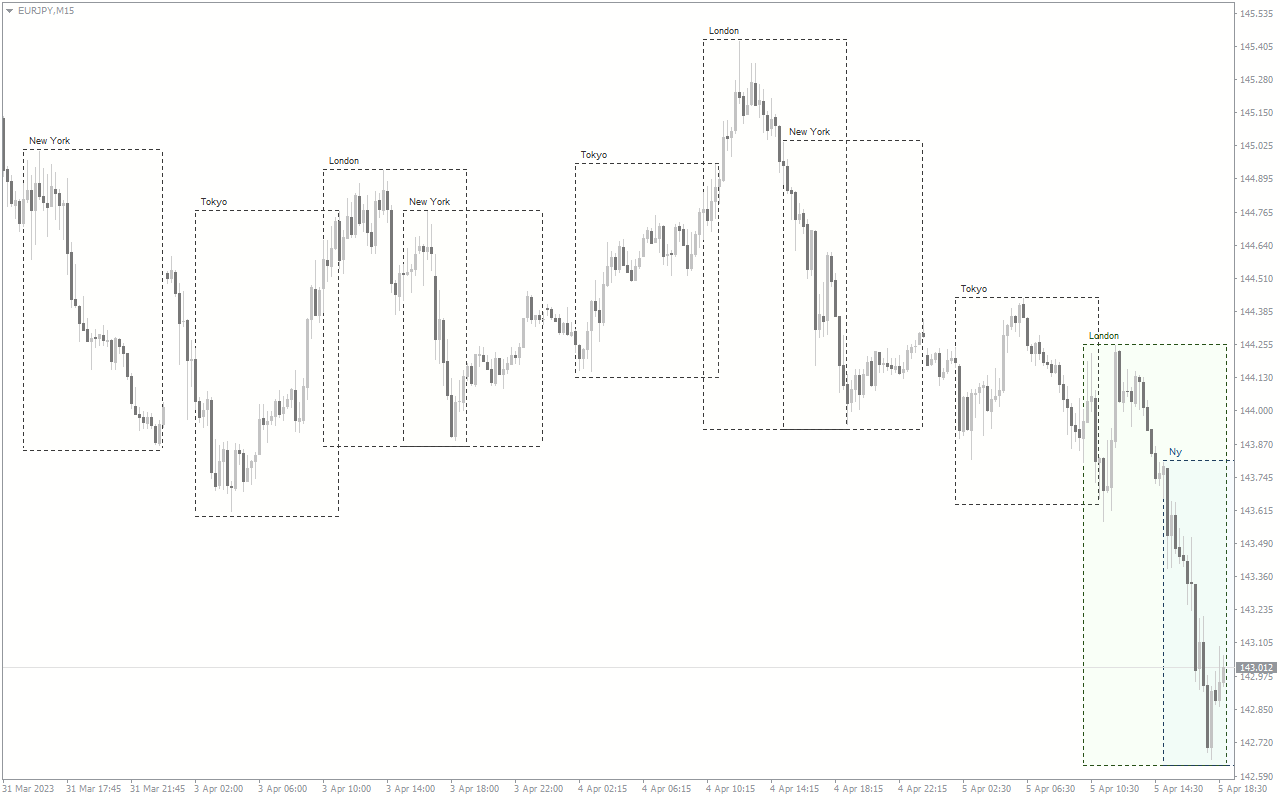
A commonly encountered feature in trading platforms, particularly within the Forex market context, is the TradingSessions indicator. This tool visually depicts the discrete trading sessions that unfold over a 24-hour period in the continuous operation of the Forex market. Despite its non-stop nature, the market is segmented into key sessions, such as Tokyo, London, and New York, and the indicator often employs color-coded or shaded overlays on price charts to delineate these sessions. This visual aid assists traders in pinpointing when specific financial centers actively participate in the market.
Commencing the daily trading cycle is the Tokyo Session, also recognized as the Asian session, commencing around 7:00 PM (EST). Following this, the London Session, or European session, takes the reins at approximately 3:00 AM (EST), succeeded by the New York Session, or North American session, which commences around 8:00 AM (EST). Recognizing the overlapping periods between these sessions becomes imperative for traders, as it aligns with heightened market activity and potential volatility. Armed with this knowledge, traders can optimize their strategies, making well-informed decisions based on the varying levels of liquidity and price fluctuations during distinct sessions.
For traders looking to integrate this indicator into their analytical toolkit, ensuring compatibility with their chosen trading platform is essential. Numerous platforms, including MetaTrader 4 (MT4) or MetaTrader 5 (MT5), provide either built-in or downloadable TradingSessions indicators. These indicators serve to heighten traders’ awareness of market dynamics, empowering them to synchronize their trading activities with the most opportune sessions for their preferred currency pairs.
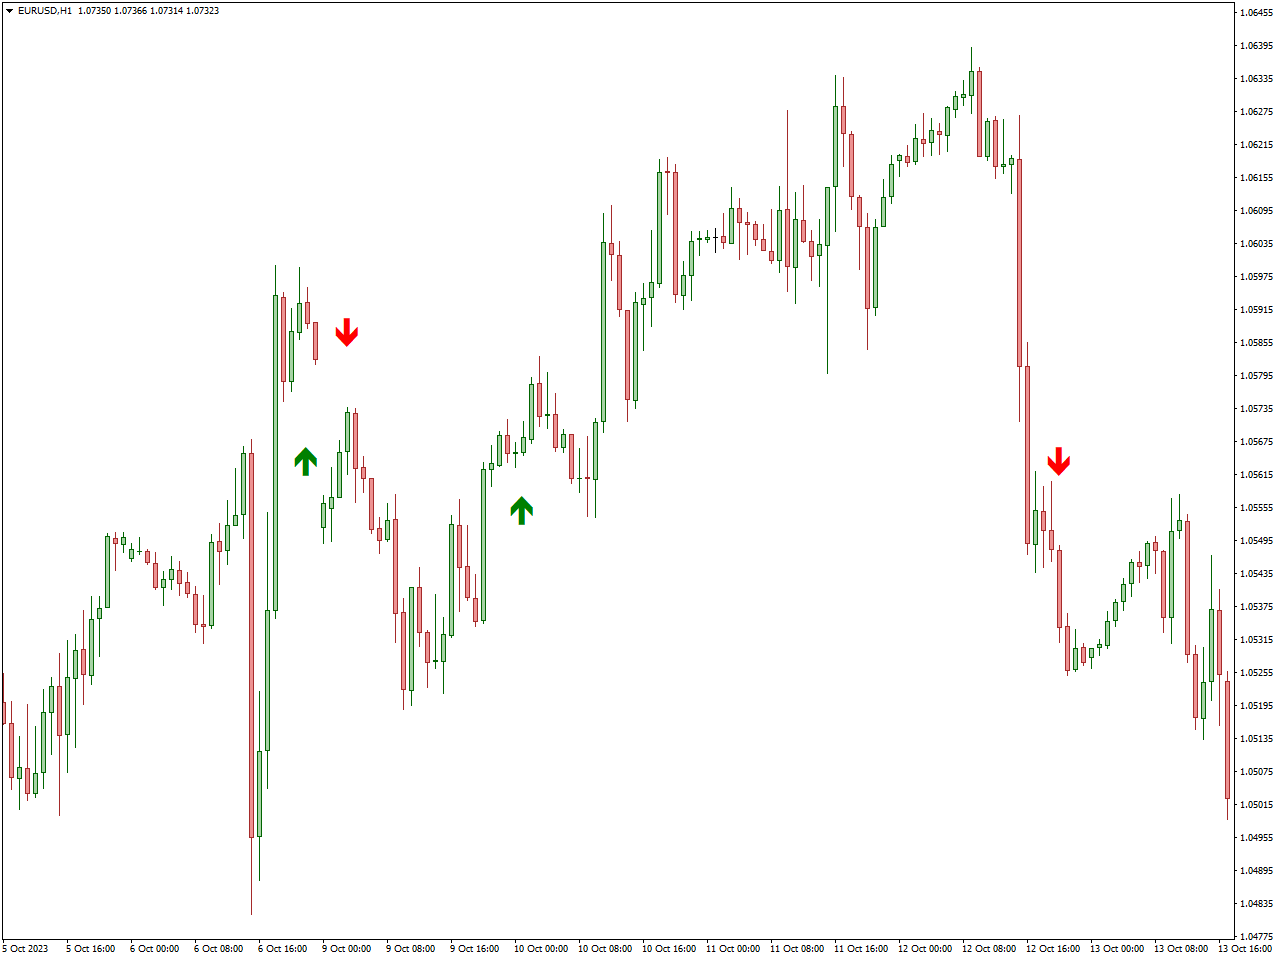
Order Block Breaker Indicator
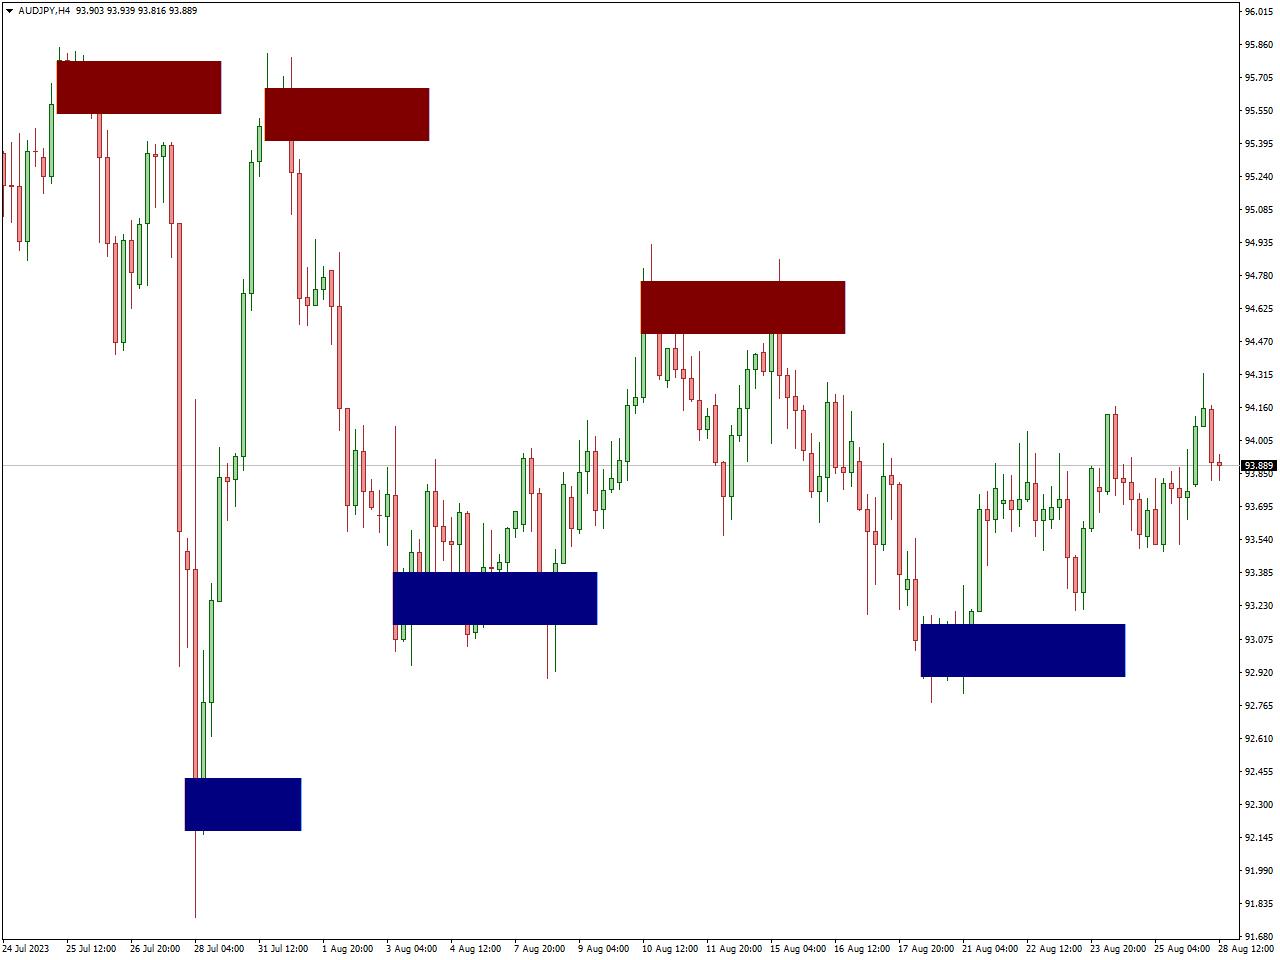
The “Order Block Breaker” indicator is a commonly employed tool on trading platforms, aiding traders in the identification and interpretation of potential reversal points in the market known as order blocks. Order blocks represent areas on a price chart where significant buying or selling activity has occurred, often leaving distinctive imprints. The primary objective of the Order Block Breaker indicator is to draw attention to these zones and indicate potential breakout opportunities.
When a market price nears or breaches an order block, it signifies a noteworthy event, suggesting a possible shift in market sentiment. The Order Block Breaker indicator typically employs visual signals, such as changes in color or specific patterns, to notify traders about these crucial areas. Traders can leverage this information to make well-informed decisions regarding entering or exiting trades based on the perceived strength or weakness associated with breaking through an order block.a
Auto TrendLine Indicator
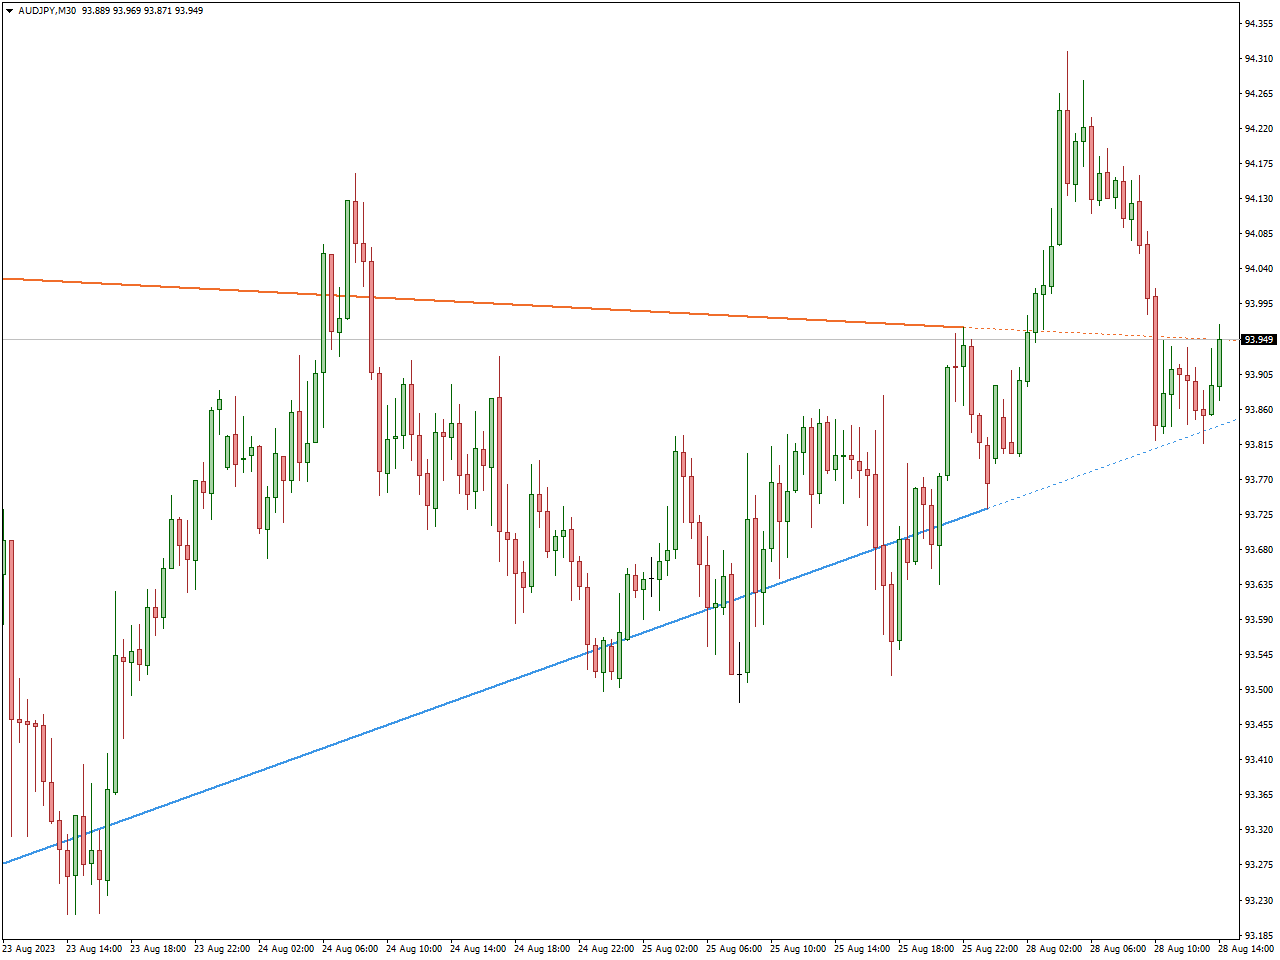
The “Auto TrendLine” indicator is a commonly integrated feature in trading platforms designed to aid traders in automatically identifying and visualizing trends in financial markets. Trendlines, which represent the prevailing direction of price movement by connecting significant highs or lows on a price chart, are automatically plotted by the Auto TrendLine indicator. The goal is to simplify the trend identification process by employing specific criteria or algorithms.
As market conditions evolve, the Auto TrendLine indicator dynamically adjusts to reflect changes in the trend. This adaptability renders it a valuable tool for traders aiming to spot potential trend reversals or confirm the continuation of existing trends. Visual elements like lines or color-coded features are often incorporated into the indicator to enhance accessibility for traders conducting trend analysis.
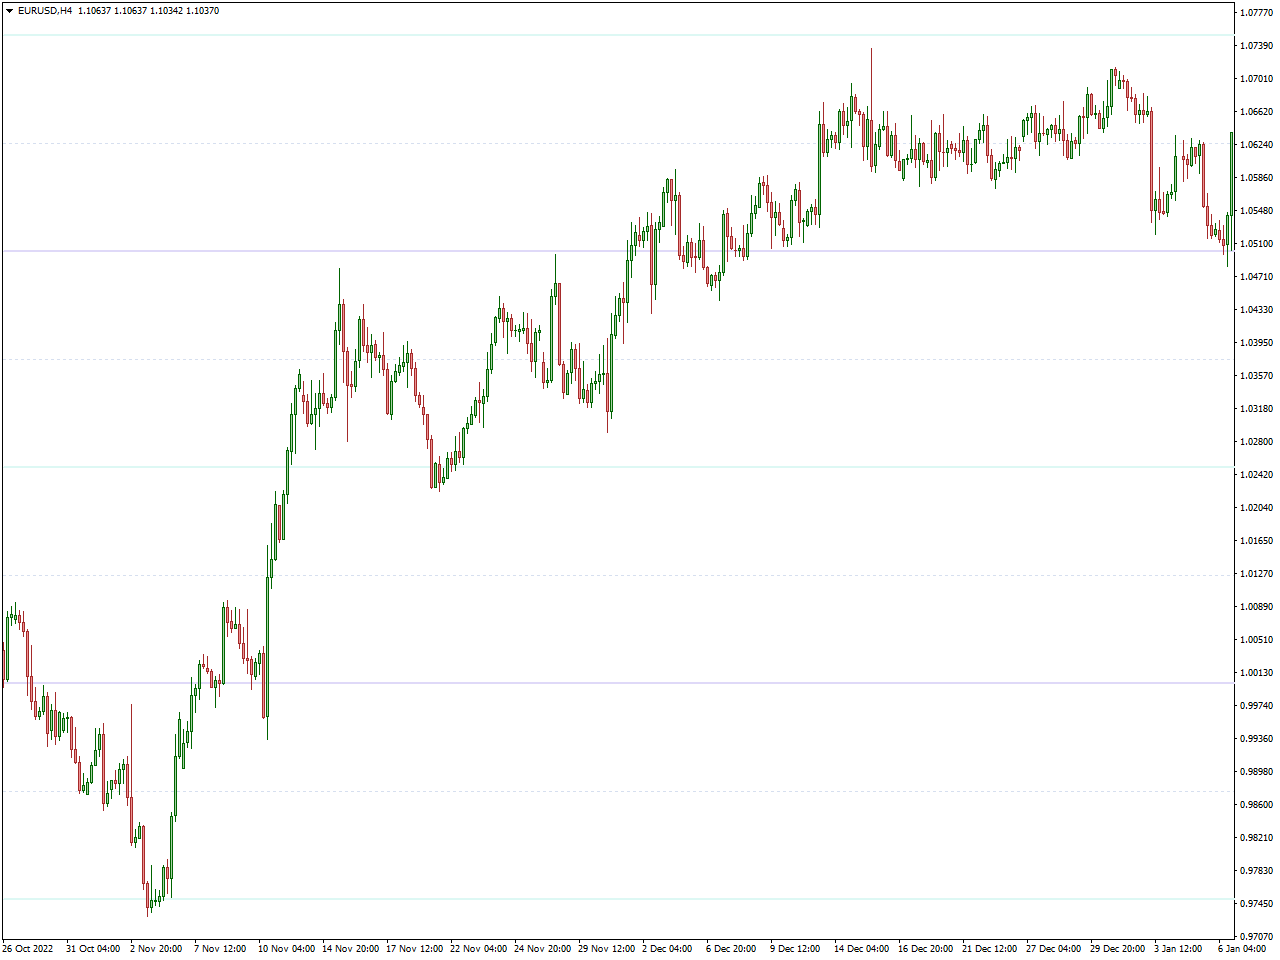
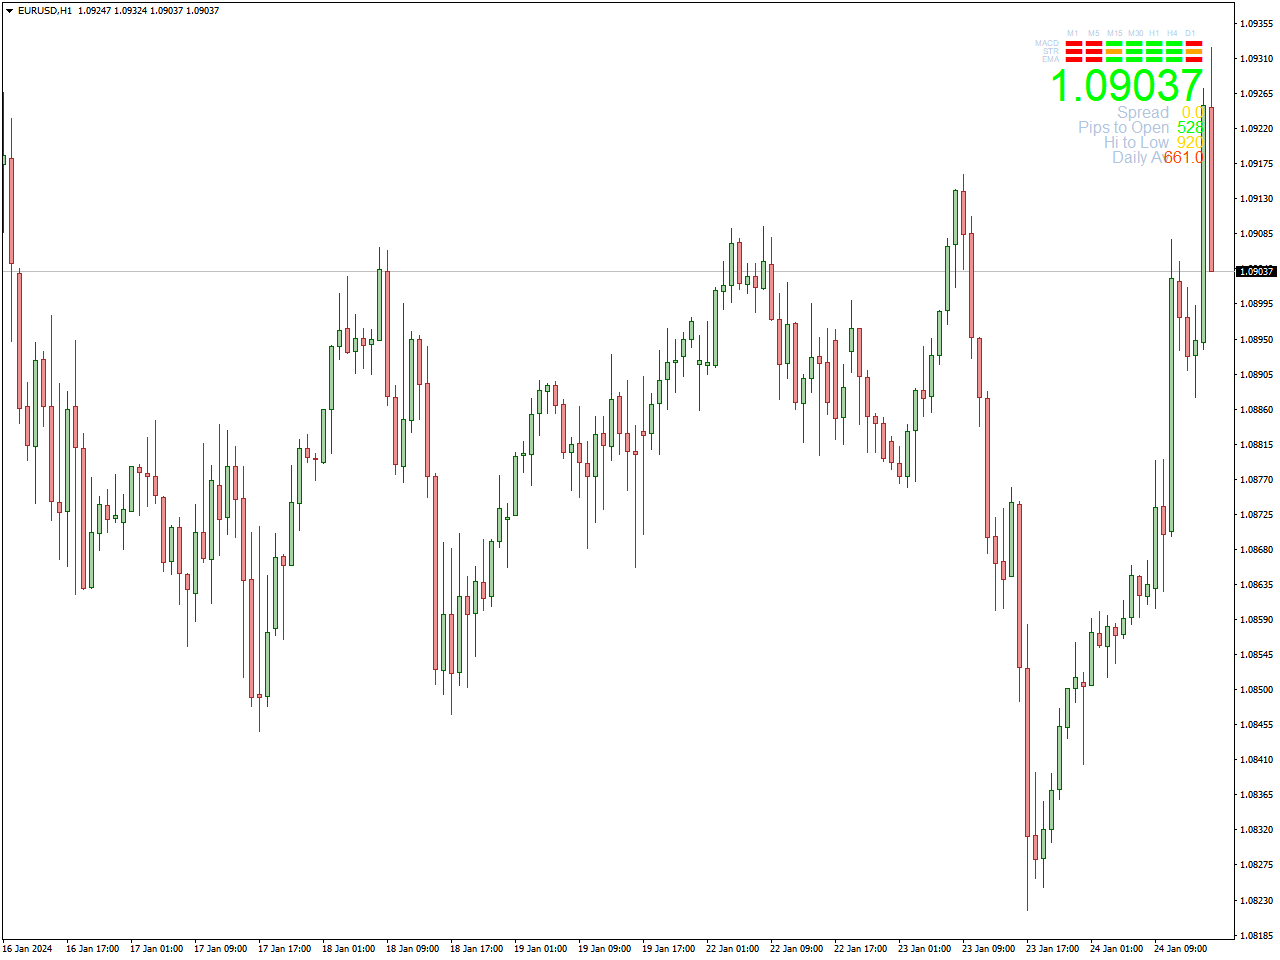
Daily ATR Indicator
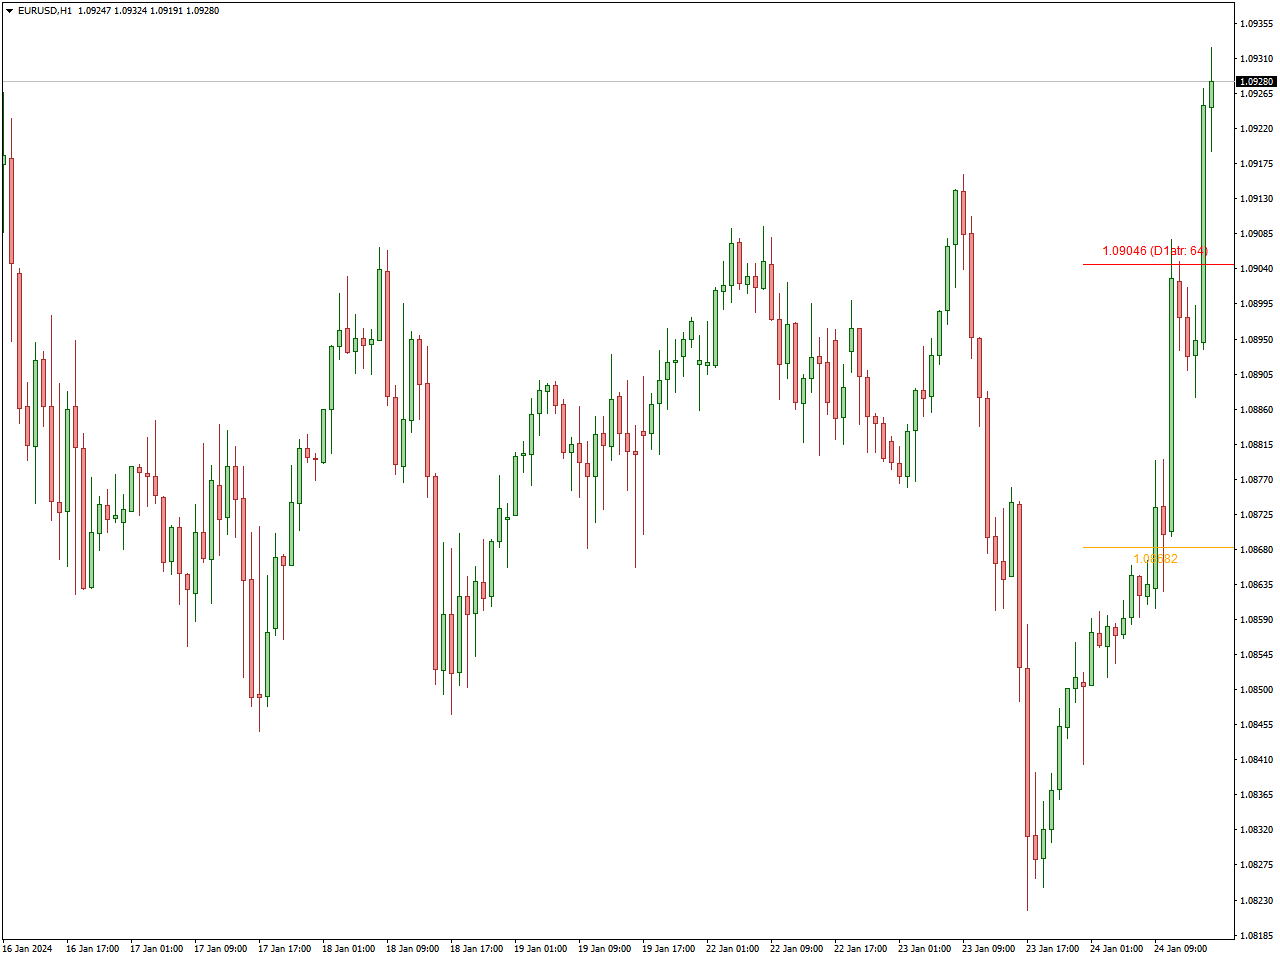
The “Daily ATR” indicator is a commonly employed tool in financial trading, serving as a means to assess market volatility. ATR, which stands for Average True Range, is a technical indicator specifically designed to calculate the range on a daily basis. This metric quantifies market volatility by examining the average distance between the high and low prices of an asset over a defined period.
Traders and investors find the Daily ATR indicator particularly valuable when aiming to gauge expected price movements within a single trading day. By monitoring the Daily ATR values, market participants can glean insights into the potential range in which an asset’s price may fluctuate during a given trading session. This information proves beneficial for setting stop-loss levels, determining position sizes, and adjusting trading strategies to align with current market conditions.
When integrated into trading platforms, the Daily ATR indicator typically manifests as a numerical value representing the average true range for a specific asset on a daily basis. Traders frequently leverage this information to make well-informed decisions grounded in volatility considerations, thereby improving risk management practices and optimizing trade setups. A thorough understanding of the specific settings and parameters of the Daily ATR indicator is essential for traders to interpret its values within the broader context of their overall trading strategy.
Round Levels Indicator
The “Round Levels” indicator is a frequently employed tool in financial trading designed to emphasize significant price levels concluding with round numbers. These rounded figures often hold significance as both psychological and technical points of interest for traders and investors. The Round Levels indicator automates the process of identifying and marking these crucial levels on a price chart, ensuring they are easily visible and available for analysis.
Round numbers, particularly those ending in 0 or 5, tend to capture attention due to their perception as essential psychological levels in the market. Traders frequently monitor these levels for potential support, resistance, or breakout indications. The Round Levels indicator aids traders by visually highlighting the locations of these important price levels, facilitating decision-making processes.
Upon integration into trading platforms, the Round Levels indicator typically exhibits lines or markings on the chart at price points featuring round numbers. Traders can leverage this information to establish price targets, implement stop-loss orders, or identify potential zones of market reversal. To effectively incorporate the Round Levels indicator into their trading strategy, traders must comprehend its settings and parameters.
The utilization of the Round Levels indicator can enhance a trader’s market navigation skills by providing a clear visual representation of crucial price levels, allowing for more informed decision-making. However, as with any technical analysis tool, it is advisable to combine the Round Levels indicator with other analysis techniques within the framework of a comprehensive trading strategy.
Spread Indicator
A commonly employed tool in financial trading, the “Spread Indicator” serves the purpose of furnishing information about the disparity between two crucial prices: the bid price (reflecting what buyers are willing to pay) and the ask price (representing what sellers are requesting). This spread is indicative of the transaction cost and liquidity associated with a financial instrument. The Spread Indicator is crafted to visually present this spread data, aiding traders in evaluating market conditions and facilitating informed decision-making.
Traders frequently keep a close eye on the spread as a pivotal metric due to its influence on the overall expenses associated with entering or exiting a trade. A narrow spread (indicating a minimal price difference between bid and ask) is generally seen as advantageous, signifying higher liquidity and reduced transaction costs. Conversely, a wide spread (indicating a larger price difference) may suggest lower liquidity and the potential for heightened transaction costs.
Displayed on a trading platform as either a numerical value or a visual representation on a price chart, the Spread Indicator highlights the ongoing spread. Traders leverage this information to evaluate the market environment, particularly during volatile periods when spreads may widen. A comprehensive understanding of the spread is imperative for optimizing trade execution and effectively managing risk.
Show Pips Indicator
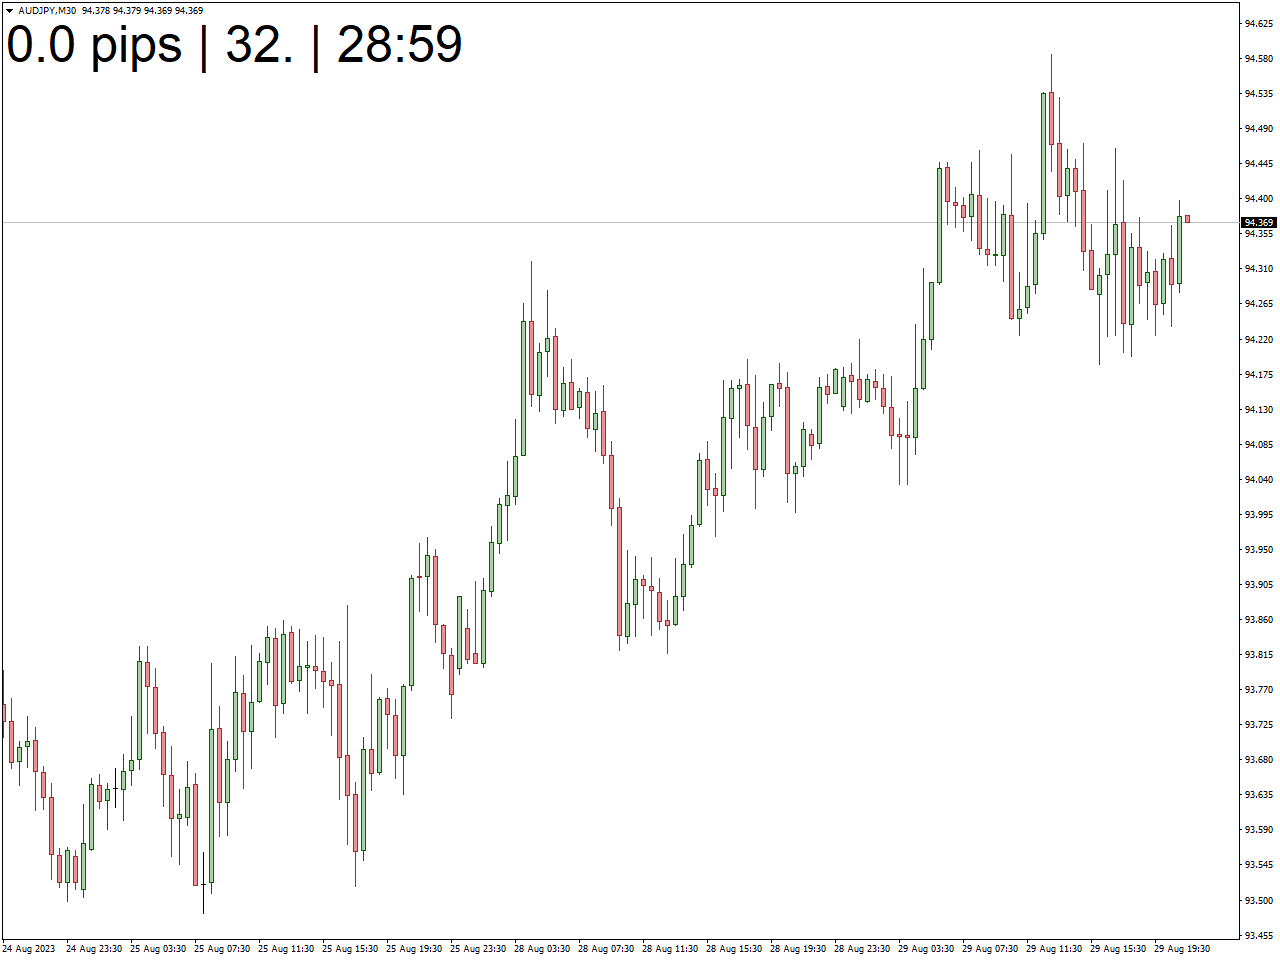
The “Show Pips Indicator” is a frequently used tool in financial trading that visually represents the pip movement or price variations within a currency pair. Pips, an acronym for “percentage in point” or “price interest point,” serve as standard units of measurement in the Forex market, denoting the smallest price movement.
Crafted to offer traders a clear and succinct display of price changes in pips on a trading platform, the Show Pips Indicator proves invaluable for those seeking a rapid assessment of price movements and overall market volatility. Typically, the indicator presents this information either numerically or graphically on the trading chart, facilitating easy accessibility for analysis.
Traders often leverage the Show Pips Indicator for tasks such as establishing stop-loss and take-profit levels and determining position sizes based on their desired risk-reward ratio. A comprehensive understanding of the pip distance between these levels is critical for effective risk management and strategic trade planning.
Volume Profile Indicator
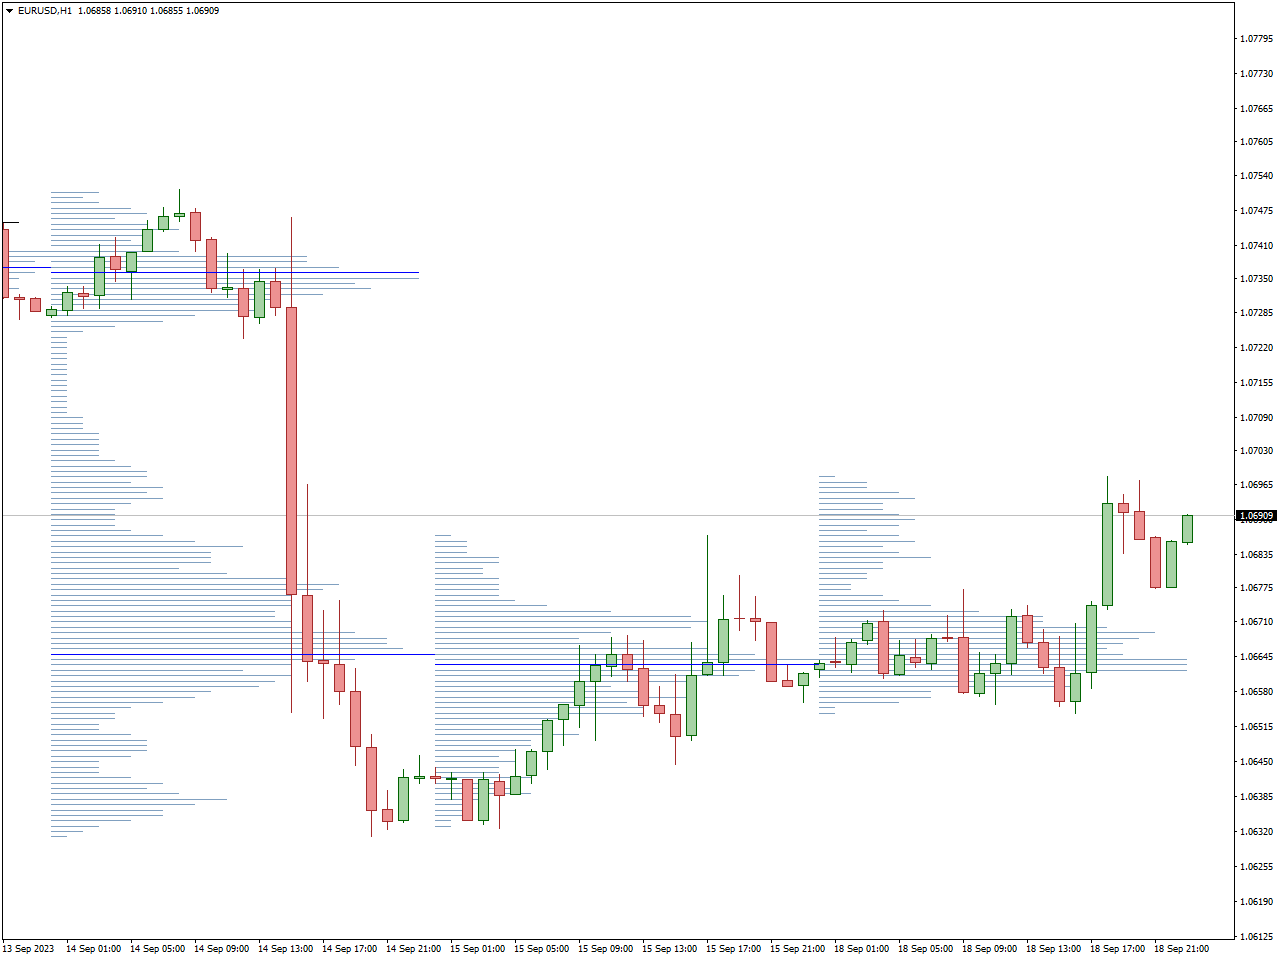
The “Volume Profile Indicator” is a commonly utilized tool in financial trading designed to offer insights into the distribution of trading volume across various price levels. By facilitating the visualization and analysis of trading activity concentrations at different price points, this indicator assists traders in pinpointing significant support and resistance levels.
The Volume Profile presents a histogram on the price chart, wherein each bar represents the trading volume at a specific price level within a chosen time period. The height of the bars corresponds to the volume traded at each price, enabling traders to identify areas of heightened or diminished activity. Peaks in the Volume Profile can signal notable levels of interest or potential market turning points.
Traders frequently leverage the Volume Profile Indicator to pinpoint price levels associated with substantial buying or selling activity. This information proves valuable for making informed decisions regarding entry and exit points, while also contributing to a comprehensive understanding of overall market sentiment.
When integrated into trading platforms, the Volume Profile Indicator may offer additional features, such as the option to customize the time period for volume analysis or to display the Volume Profile in the form of a horizontal histogram. To effectively incorporate this indicator into their trading strategies, traders should acquaint themselves with its specific settings and functionalities.
MA Crossover Alerts Indicator
The “MA Crossover Alerts Indicator” is a widely utilized tool in financial trading, serving to identify occurrences of moving average crossovers and deliver alerts to traders. Moving averages, as technical indicators, are instrumental in smoothing out price data, providing insight into the underlying trend. A crossover transpires when two moving averages with different periods intersect on a price chart, signifying a possible shift in trend direction.
This indicator, designed for the automatic detection of such crossovers, promptly notifies traders through alerts, which can manifest as pop-ups, emails, or notifications on trading platforms. These alerts play a crucial role in updating traders about crossover events, which are often regarded as significant occurrences indicating potential shifts in market sentiment or the initiation of a new trend.
Traders frequently leverage moving average crossovers as signals for trade entry or exit decisions. For example, a bullish crossover (where a shorter-term moving average crosses above a longer-term moving average) may be interpreted as a buy signal, hinting at a potential upward trend. Conversely, a bearish crossover (shorter-term moving average crossing below a longer-term moving average) may serve as a sell signal, suggesting a possible downward trend.
AO Divergence Indicator
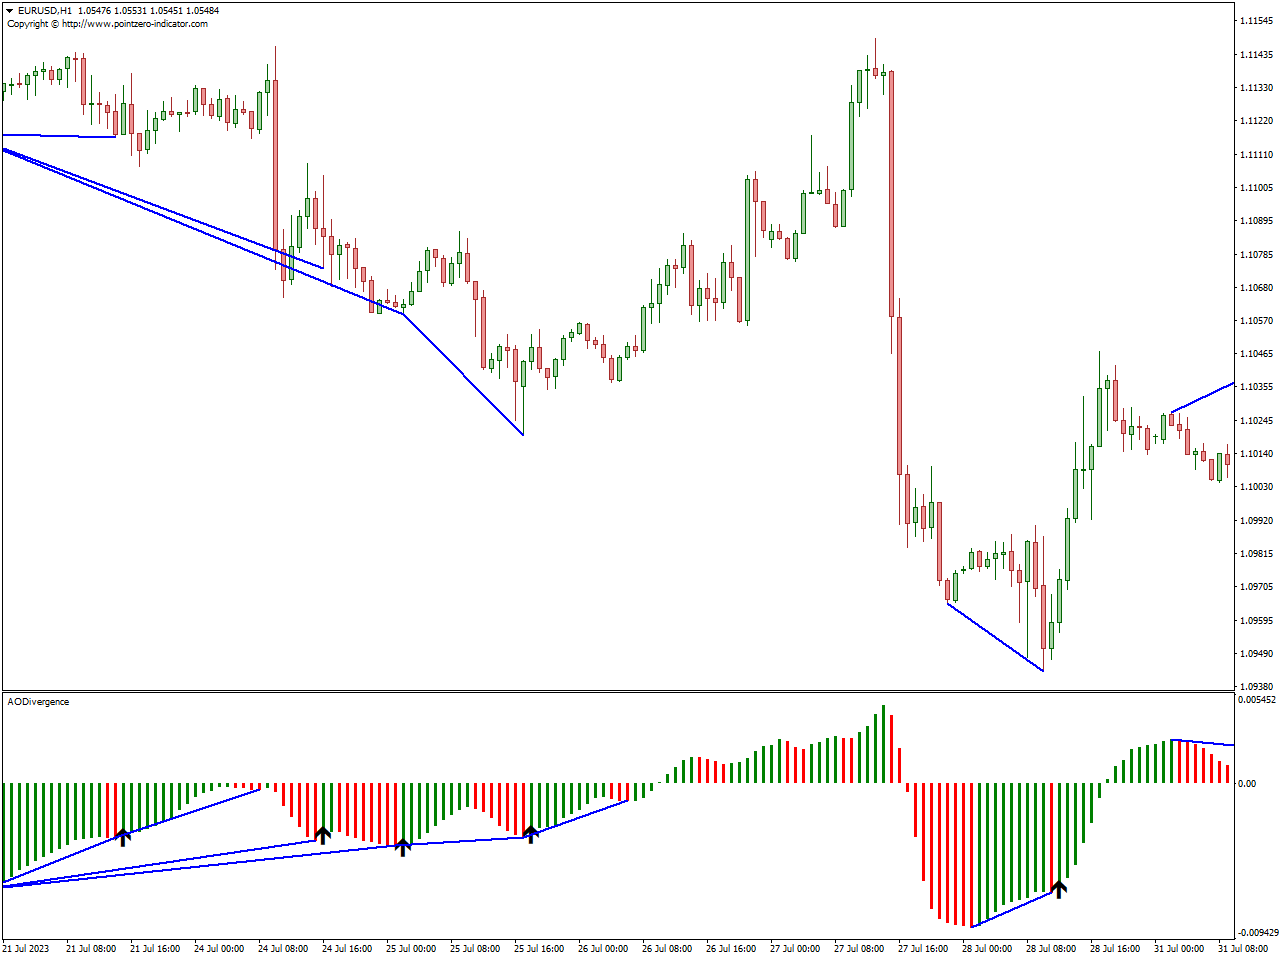
The “AO Divergence Indicator” is a frequently utilized tool in financial trading, aimed at recognizing divergence patterns within the Awesome Oscillator (AO). The Awesome Oscillator functions as a technical indicator, revealing the disparity between a 34-period and a 5-period Simple Moving Average (SMA) on a price chart. Divergence manifests when the price action and the Awesome Oscillator exhibit opposing movements, potentially indicating a shift in the prevailing trend.
Specifically crafted for this purpose, the AO Divergence Indicator identifies instances where the price of an asset and the Awesome Oscillator display divergence. This divergence can take on a bullish or bearish nature, offering traders potential signals of upcoming reversals or continuations in the market.
Upon integration into trading platforms, the AO Divergence Indicator typically employs visual cues like lines or color changes on the chart to emphasize divergence patterns. Traders can utilize this information to make well-informed decisions regarding entry and exit points, thereby adjusting their trading strategies accordingly.
Conclusion
Well done! You’ve just revealed the key to mastering day trading through the utilization of potent indicators. Integrating these tools into your strategy will elevate your capacity to interpret the market, spot trends, and execute timely trades. Keep in mind, successful day trading is an ongoing learning journey, and staying informed is your pathway to consistent profitability. Now, equipped with this knowledge, venture forth and confidently conquer the financial markets.