

Welcome to the ultimate guide on overbought and oversold indicators! In the dynamic realm of trading, grasping the significance of these crucial indicators can serve as a pivotal factor in your success. Whether you’re a seasoned trader or a novice, this thorough examination of the Top 10 Overbought and Oversold Indicators will provide you with the expertise to maneuver through markets, spot potential reversals, and make well-informed decisions to optimize your profits.
Top 10 Overbought and Oversold Indicators
- Overbought and Oversold Indicator
- RSI Heatmap Indicator
- StochRSI Indicator
- RSI Overbought Oversold Indicator
- FXSSI.OpenInterest
- MACD 2 Line Indicator
- Commodity Channel Index (CCI) Indicator
- Bollinger Bands Indicator
- Money Flow Index Indicator (MFI)
- FXSSI.Ratios
Overbought and Oversold Indicator
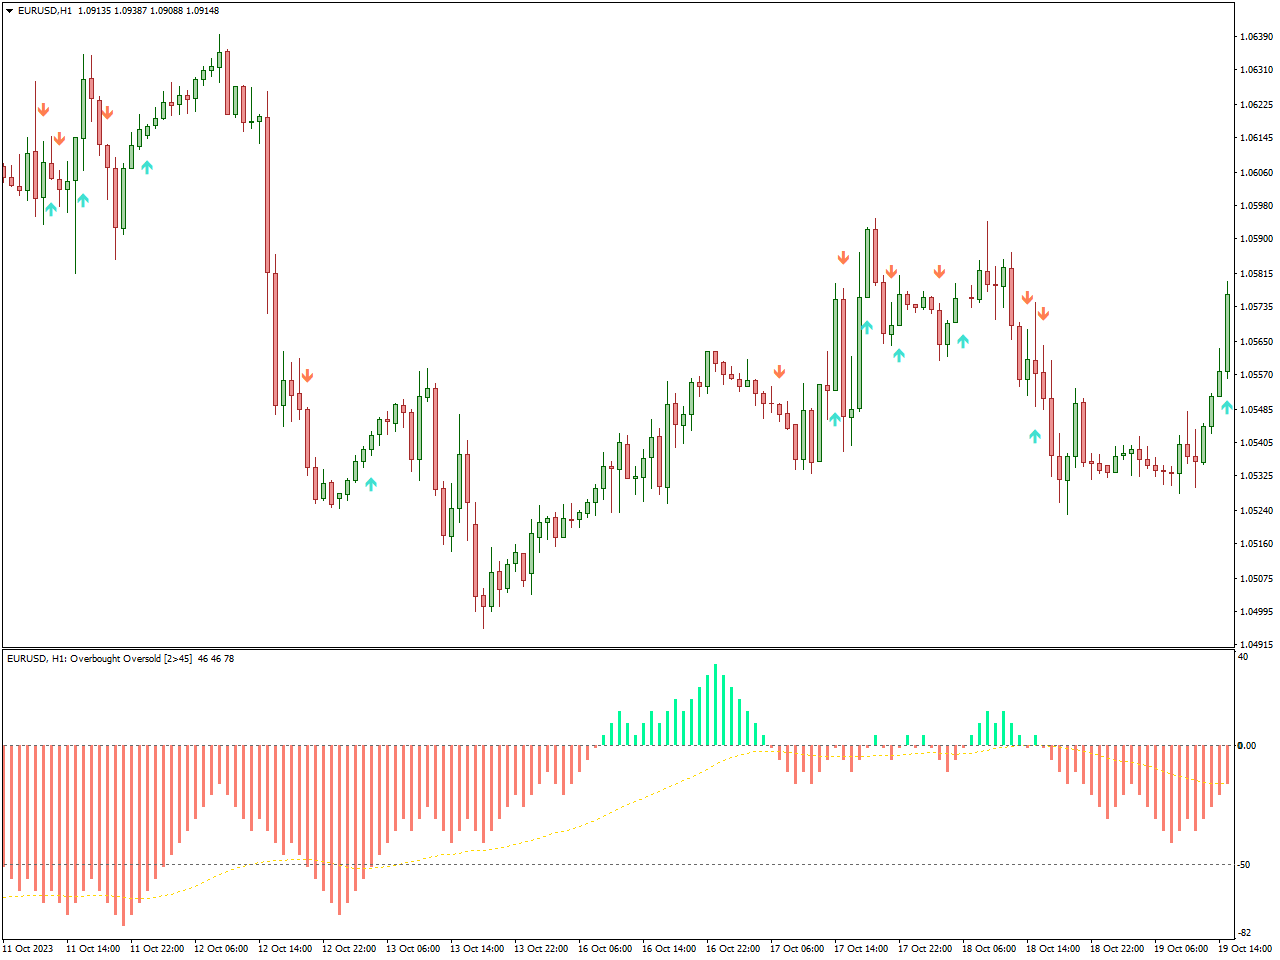
The Overbought and Oversold indicator on MT4 generates arrow-based signals for forex trading displayed on the price chart. It also offers signals through a histogram in a separate window, allowing technical forex traders to combine both indicators for more comprehensive trading decisions.
The entry signal is determined by two key parameters: the arrow signal on the chart and the color of the histogram. When the histogram bars are GREEN, indicating a BULLISH market trend, forex traders are advised to initiate a BUY trade upon observing a GREEN arrow signal on the price chart. It is important to note that trading sell signals is discouraged when the histogram is GREEN. Additionally, exiting the trade can be based on signals from the opposite arrow.
Conversely, a RED histogram signals a BEARISH price trend. Technical traders should consider entering the market with a SELL position upon encountering a SELL arrow signal on the chart. Exiting the trade is recommended when receiving an opposite arrow signal. Moreover, trading BUY arrow signals is not recommended when the histogram is RED. This approach enables traders to make well-informed decisions by incorporating both arrow and histogram signals for a comprehensive trading strategy.
RSI Heatmap Indicator
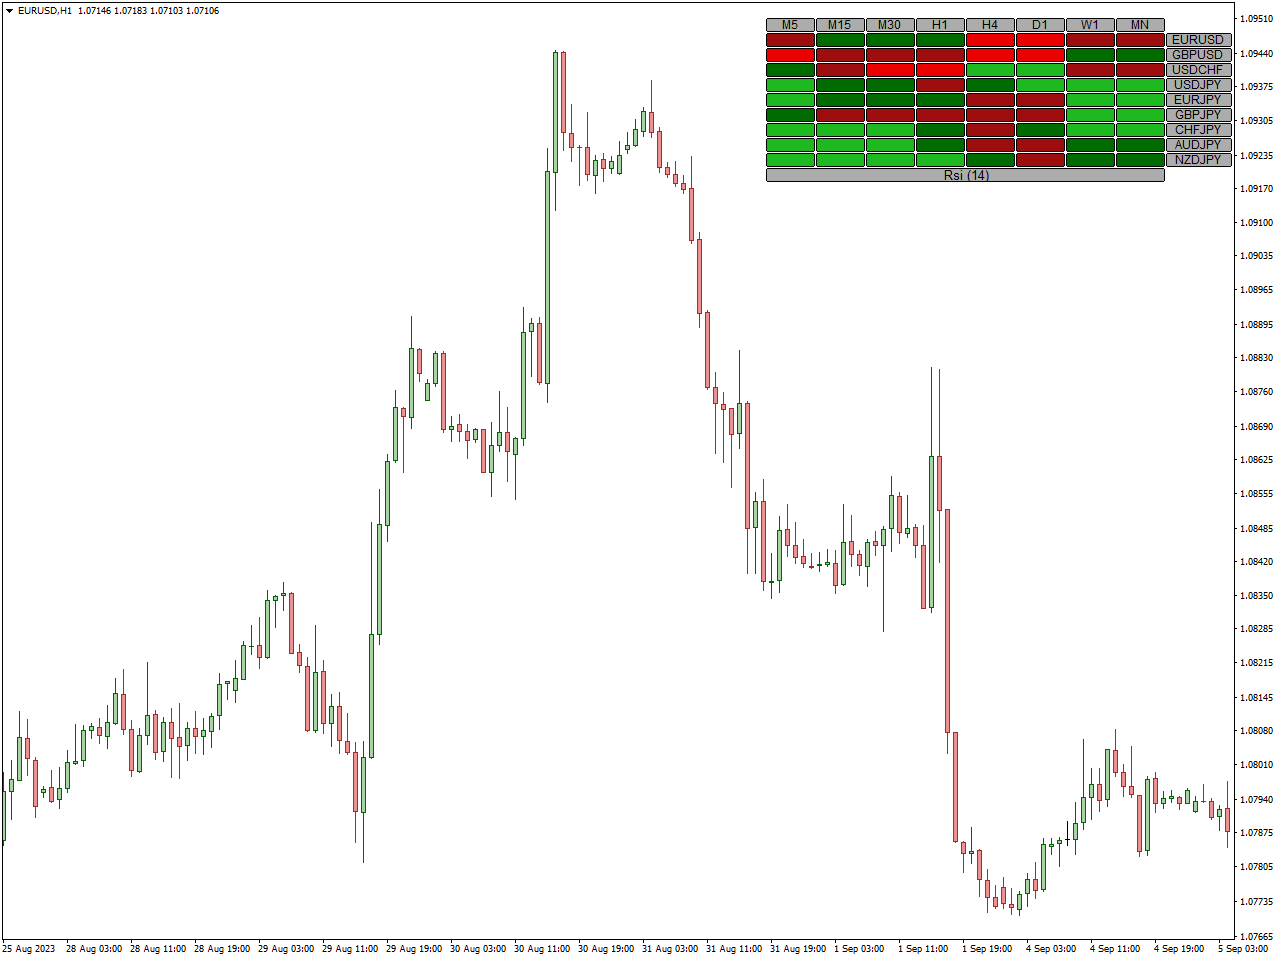
The Relative Strength Index (RSI) serves as a momentum oscillator, gauging the pace and magnitude of price movements. Beyond its intrinsic value in technical analysis, an RSI-based heatmap offers supplementary insights into a financial instrument’s strength or weakness.
Constructing an RSI heatmap entails mapping RSI values onto a color-coded grid or chart across diverse timeframes. This visualization aids traders and analysts in promptly identifying overbought or oversold conditions spanning various time periods. Crafting an RSI heatmap involves selecting multiple timeframes for RSI calculation and defining color codes to signify different RSI levels.
The heatmap grid showcases RSI values for each timeframe with cells colored according to the specified code. Traders analyze the heatmap to swiftly pinpoint potential areas of concern or opportunity. For example, a cluster of red cells across diverse timeframes may indicate a potential overbought condition.
Customization of the heatmap is possible, allowing adjustment of RSI periods, color codes, or integration of additional technical indicators, aligning with individual preferences and trading strategies. It is imperative to integrate heatmap insights with other technical analysis tools and market context for a comprehensive evaluation. Moreover, rigorous backtesting is crucial to validate the heatmap’s effectiveness under varied market conditions before relying on it for trading decisions.
StochRSI Indicator
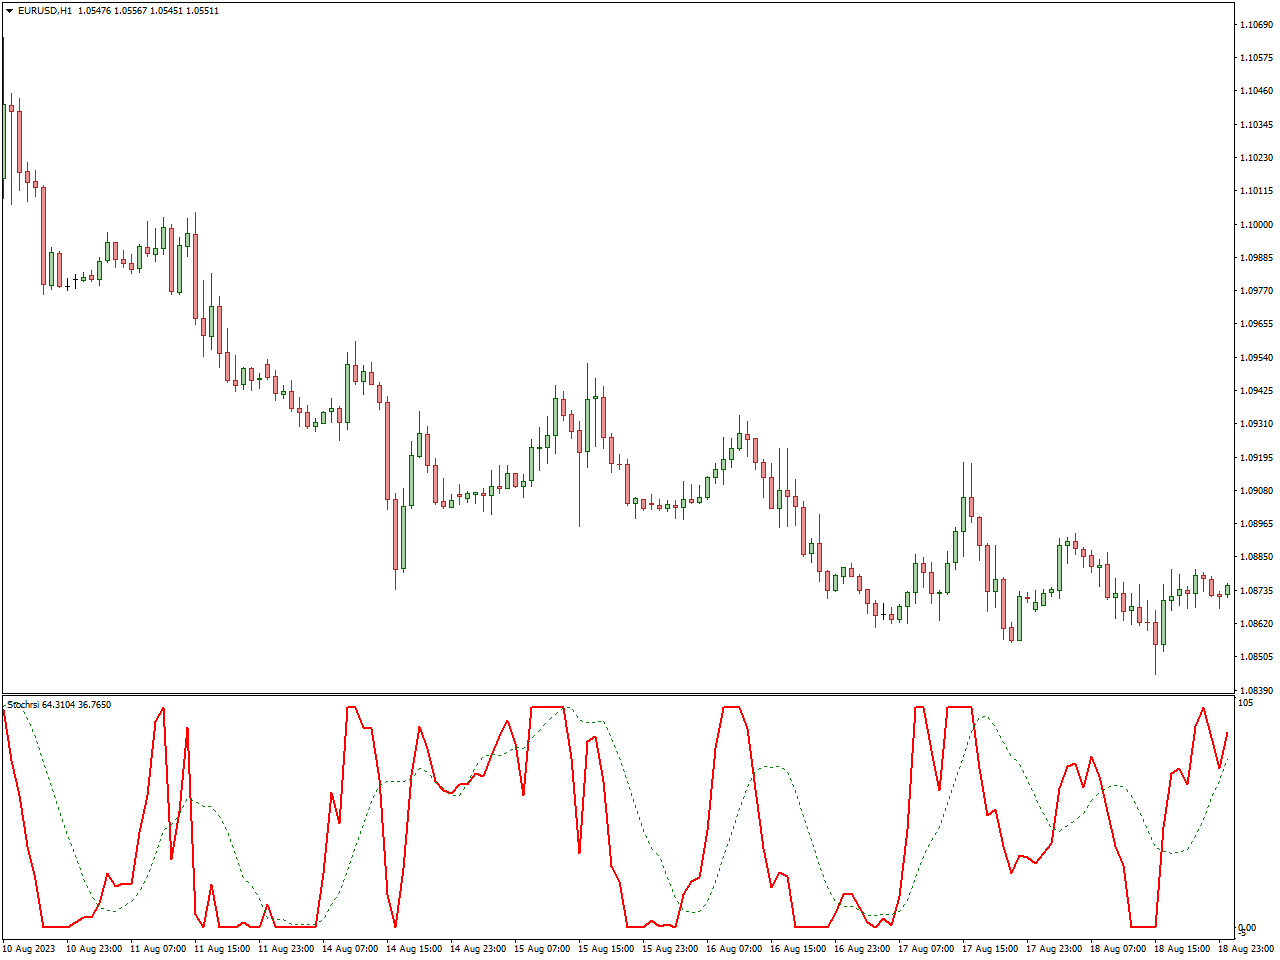
The Stochastic Relative Strength Index (StochRSI) is a technical indicator that blends features from both the Relative Strength Index (RSI) and the Stochastic Oscillator. Its purpose is to offer a more nuanced and responsive evaluation of overbought or oversold conditions in a market.
To calculate the StochRSI, the Stochastic Oscillator formula is applied to RSI values instead of price. The process involves computing the RSI for a specified number of periods (e.g., 14 periods) to measure the speed and magnitude of price movements. Then, the Stochastic Oscillator formula is implemented on the RSI values, deviating from the conventional use with closing prices. This formula calculates the %K and %D values.
The result is a StochRSI indicator that oscillates between 0 and 100, akin to the RSI. Commonly, values exceeding 80 suggest overbought conditions, while values below 20 indicate oversold conditions.
The StochRSI is valuable for identifying potential shifts in trends or continuation patterns and for confirming overbought or oversold conditions that may not be as evident when relying solely on the RSI. Traders often look for StochRSI crossovers, divergences, and extreme values as key indicators for making informed trading decisions.
RSI Overbought Oversold Indicator
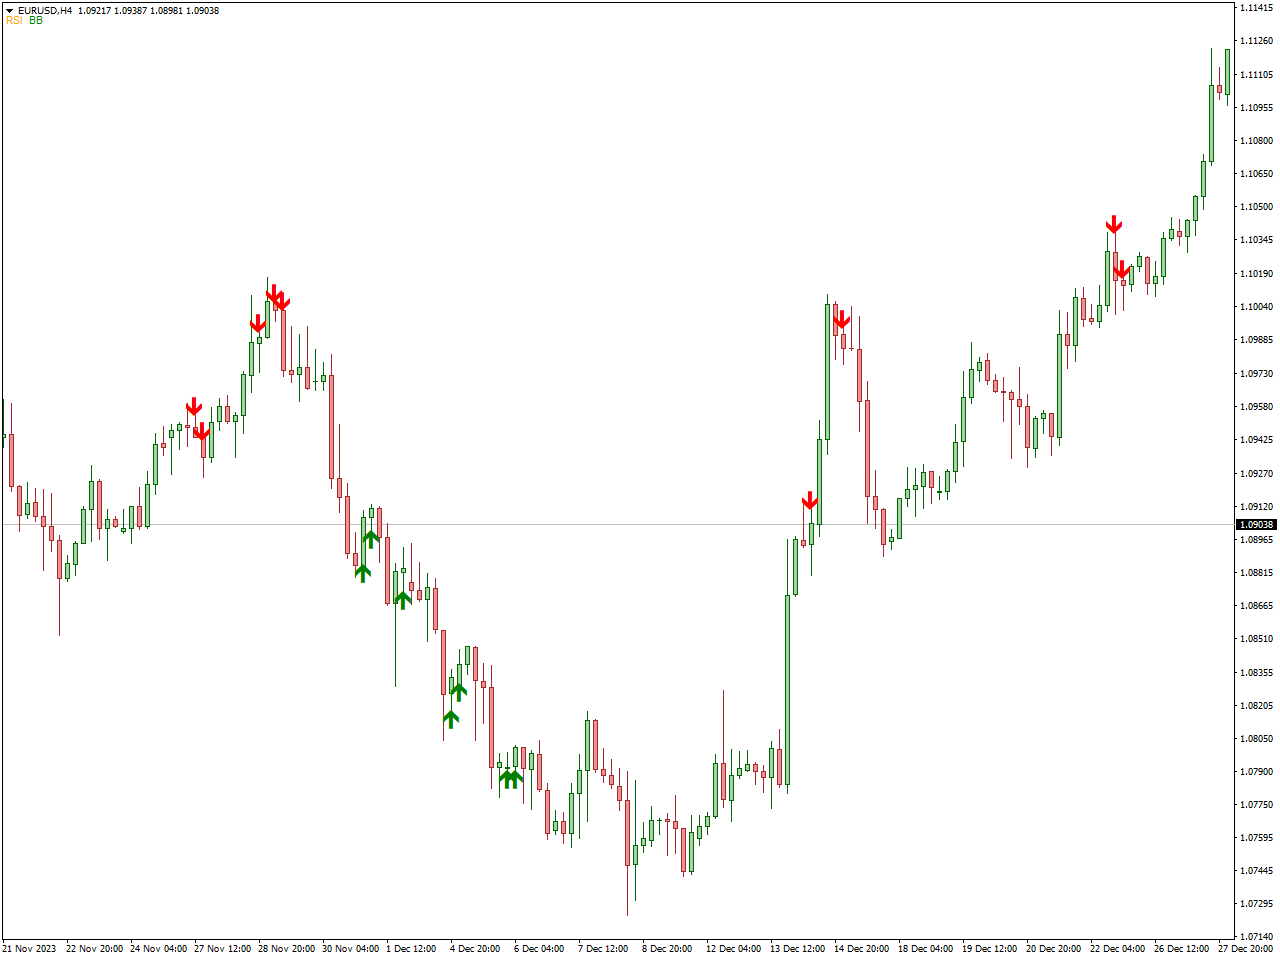
The Relative Strength Index (RSI) Overbought/Oversold indicator is a widely embraced tool in technical analysis, aiding traders in pinpointing potential reversal points in a financial instrument’s price dynamics. RSI, functioning as a momentum oscillator, gauges the speed and alteration of price movements, with Overbought and Oversold thresholds conventionally set at 70 and 30.
In Overbought Conditions, when the RSI value surpasses the 70 threshold, it signifies the asset entering the overbought zone. This implies a potential overvaluation, suggesting the likelihood of a price correction or a reversal to the downside.
Conversely, in Oversold Conditions, when the RSI value descends below the 30 threshold, it denotes the asset being in the oversold zone. This suggests a potential undervaluation, indicating the possibility of a price correction or a reversal to the upside.
Traders often leverage these Overbought/Oversold signals as a foundation for their trading decisions. For instance, if the RSI crosses above 70, some traders may interpret it as a signal to sell or take profits, anticipating a potential decline in price. On the other hand, if the RSI crosses below 30, some traders may perceive it as a signal to buy, expecting a potential rebound in price.
FXSSI.OpenInterest
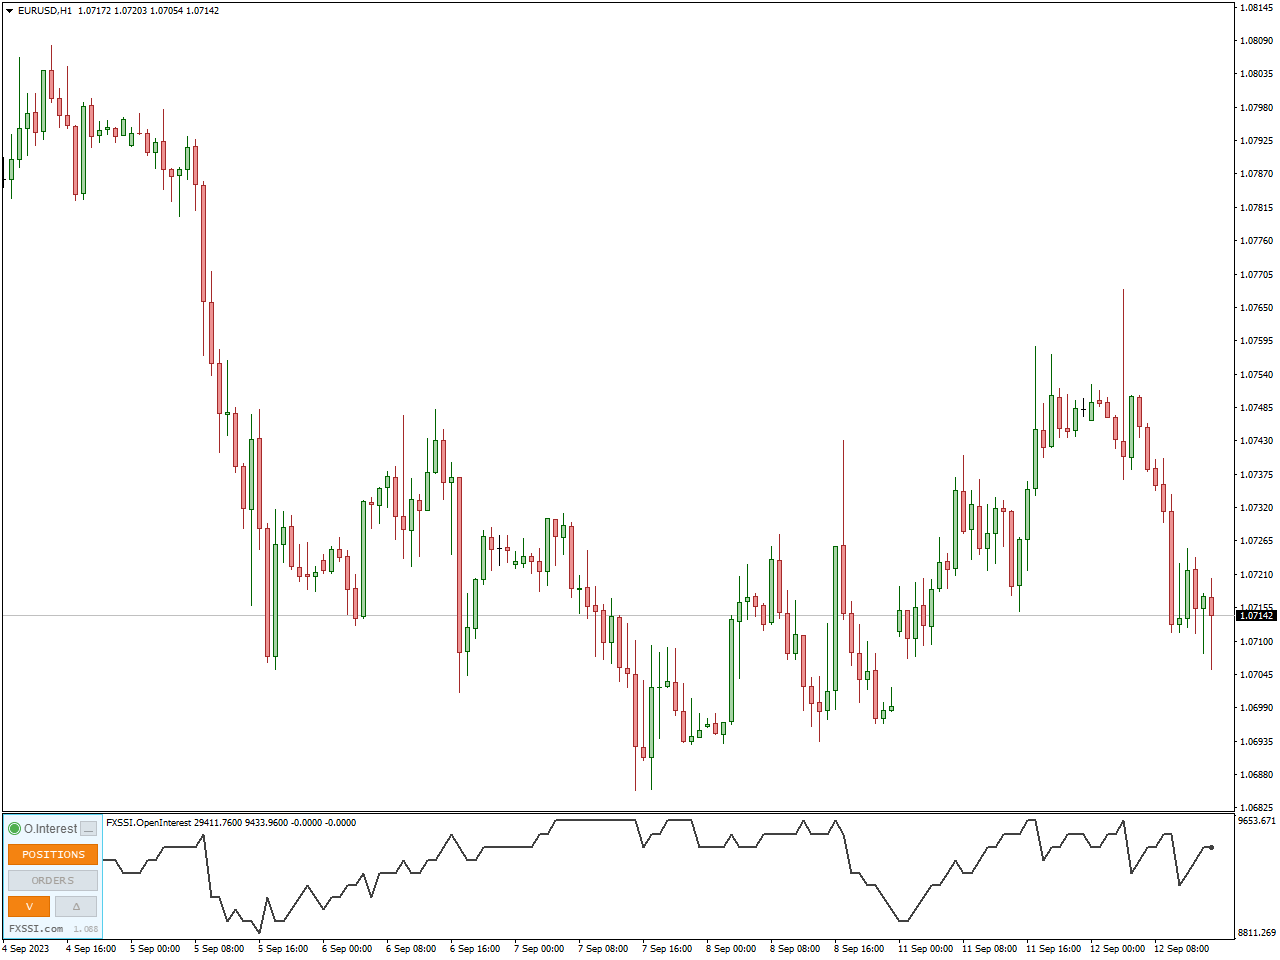
The FXSSI.OpenInterest Indicator, designed for use in MT4/5 technical analysis, serves as a tool for traders to observe and analyze open interest data within the Forex market. Open interest reflects the total active positions held by traders for a specific financial instrument. By scrutinizing this data, traders can glean insights into market sentiment and potential price movements, enabling them to make well-informed decisions and adjust their trading strategies accordingly.
Functioning by aggregating open interest data from diverse sources, including exchange-traded derivatives and over-the-counter markets, the indicator then presents the open interest data in a separate window below the price chart. This visual representation aids traders in interpreting market sentiment.
The FXSSI.OpenInterest Indicator is a valuable tool for traders, providing insights that empower them to make informed decisions and adjust their trading strategies accordingly. The following guidelines outline how to interpret the indicator:
Bullish Signal: A surge in open interest coupled with rising prices indicates robust bullish sentiment, suggesting a potential buying opportunity.
Bearish Signal: An increase in open interest alongside falling prices signals strong bearish sentiment, indicating a potential selling opportunity.
MACD 2 Line Indicator
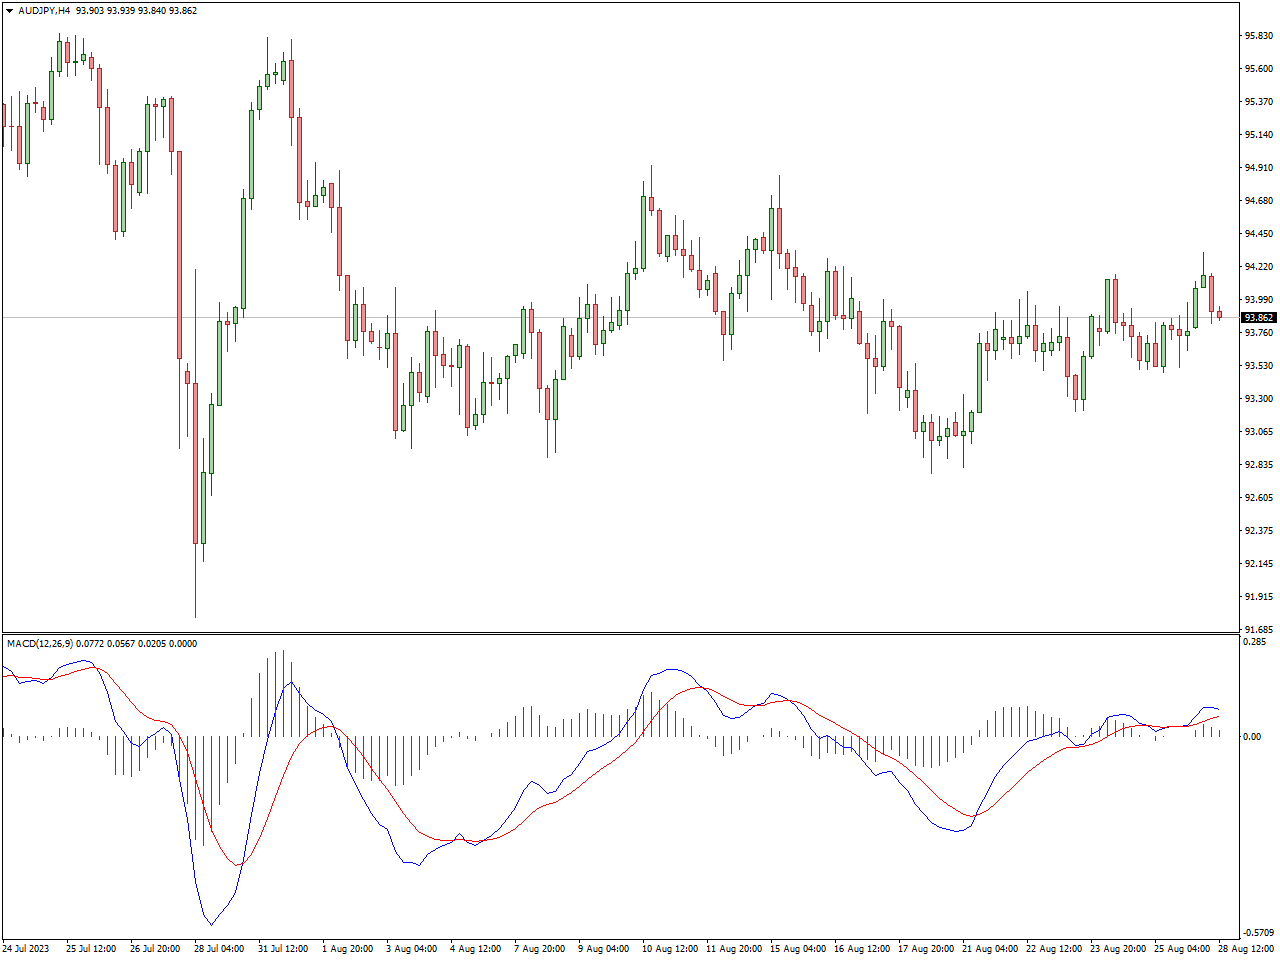
The MACD 2-Line Indicator is a widely utilized tool in technical analysis, offering insights into the interaction between two moving averages of an asset’s price. Comprising the MACD line and the signal line, it consists of a fast line (MACD line) representing the difference between short-term and long-term exponential moving averages, and a slow line (signal line) typically a 9-period exponential moving average of the MACD line. This configuration allows for the identification of potential buy or sell opportunities through crossovers and divergence patterns. Traders leverage the MACD 2-Line Indicator to gauge momentum, confirm trend direction, and generate signals for making informed trading decisions. Some traders also explore histogram variations of the MACD for a more nuanced analysis of market trends and potential reversals. As with any technical indicator, it is imperative to use the MACD 2-Line Indicator in conjunction with other analytical tools for a comprehensive assessment of market conditions.
Commodity Channel Index (CCI) Indicator
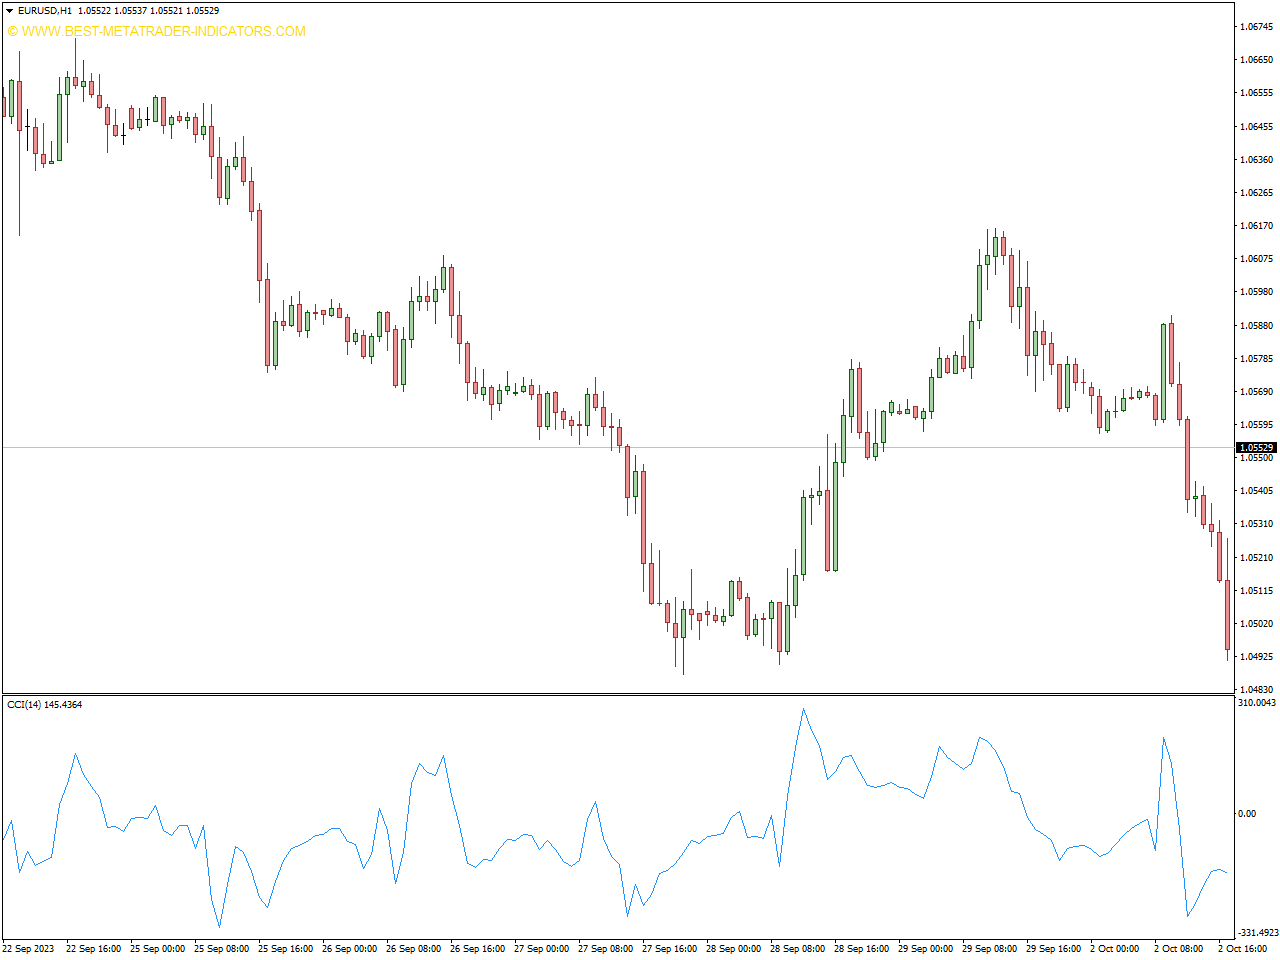
The Commodity Channel Index (CCI) is a widely used technical indicator in financial analysis, designed by Donald Lambert to help traders assess the momentum and potential trend reversals of various financial instruments. Although initially developed for analyzing commodities, the CCI has found applications in diverse markets, including stocks, currencies, and futures.
The calculation of the CCI involves determining the typical price by averaging the high, low, and close prices over a specified period. Subsequently, the simple moving average (SMA) of the typical price is computed for the chosen period. The mean deviation, representing the average absolute deviation of the typical price from the SMA, is then measured. The CCI itself is derived using a formula that incorporates these values.
The resulting CCI value oscillates around a centerline, typically set at zero, and its interpretation includes identifying overbought conditions when the CCI is above 100, suggesting the price surpasses its statistically determined average. Conversely, oversold conditions are indicated when the CCI is below -100, signaling that the price falls below its statistically determined average. Divergence between the price and CCI, where new highs or lows are not mirrored by the CCI, may indicate a potential reversal or weakening of the prevailing trend.
Traders commonly use the CCI Indicator to discern potential trend reversals, identify overbought or oversold conditions, and validate existing trends. However, like any technical indicator, it is essential to incorporate the CCI into a broader analytical framework, considering other tools and market conditions for more accurate assessments.
Bollinger Bands Indicator
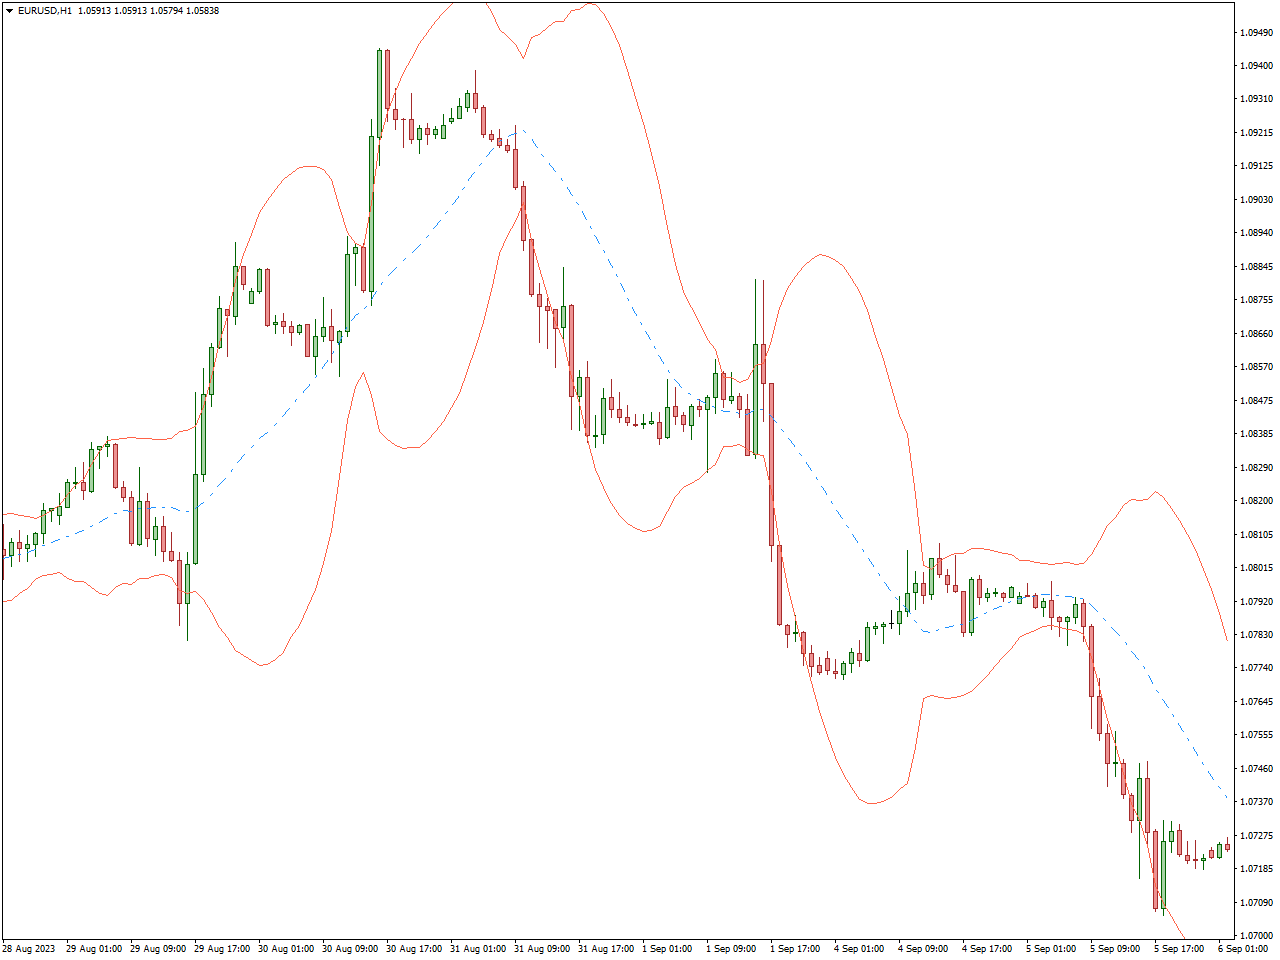
The Bollinger Bands Indicator, developed by John Bollinger, is a widely utilized tool in technical analysis. It assists traders in assessing volatility, recognizing potential trend reversals, and evaluating price levels relative to historical norms.
Comprising three main elements, the indicator includes a middle band, typically a simple or exponential moving average, serving as the baseline. The upper band, calculated by adding a specified number of standard deviations to the middle band, indicates the upper boundary of expected price movement, while the lower band, derived by subtracting standard deviations, represents the lower boundary.
Bollinger Bands are dynamic, expanding during periods of higher volatility and contracting during lower volatility. When prices touch or surpass the upper band, it may signal overbought conditions, whereas touching or falling below the lower band suggests oversold conditions. Reversion to the mean, where prices return to the middle band after touching the upper or lower band, is often interpreted as a potential reversal signal.
This indicator’s versatility allows application across various timeframes and financial instruments. It provides a visual representation of price volatility and potential turning points, aiding traders in making informed decisions about market entry or exit. Traders commonly use Bollinger Bands in conjunction with other technical indicators to enhance their overall analysis.
Money Flow Index Indicator (MFI)
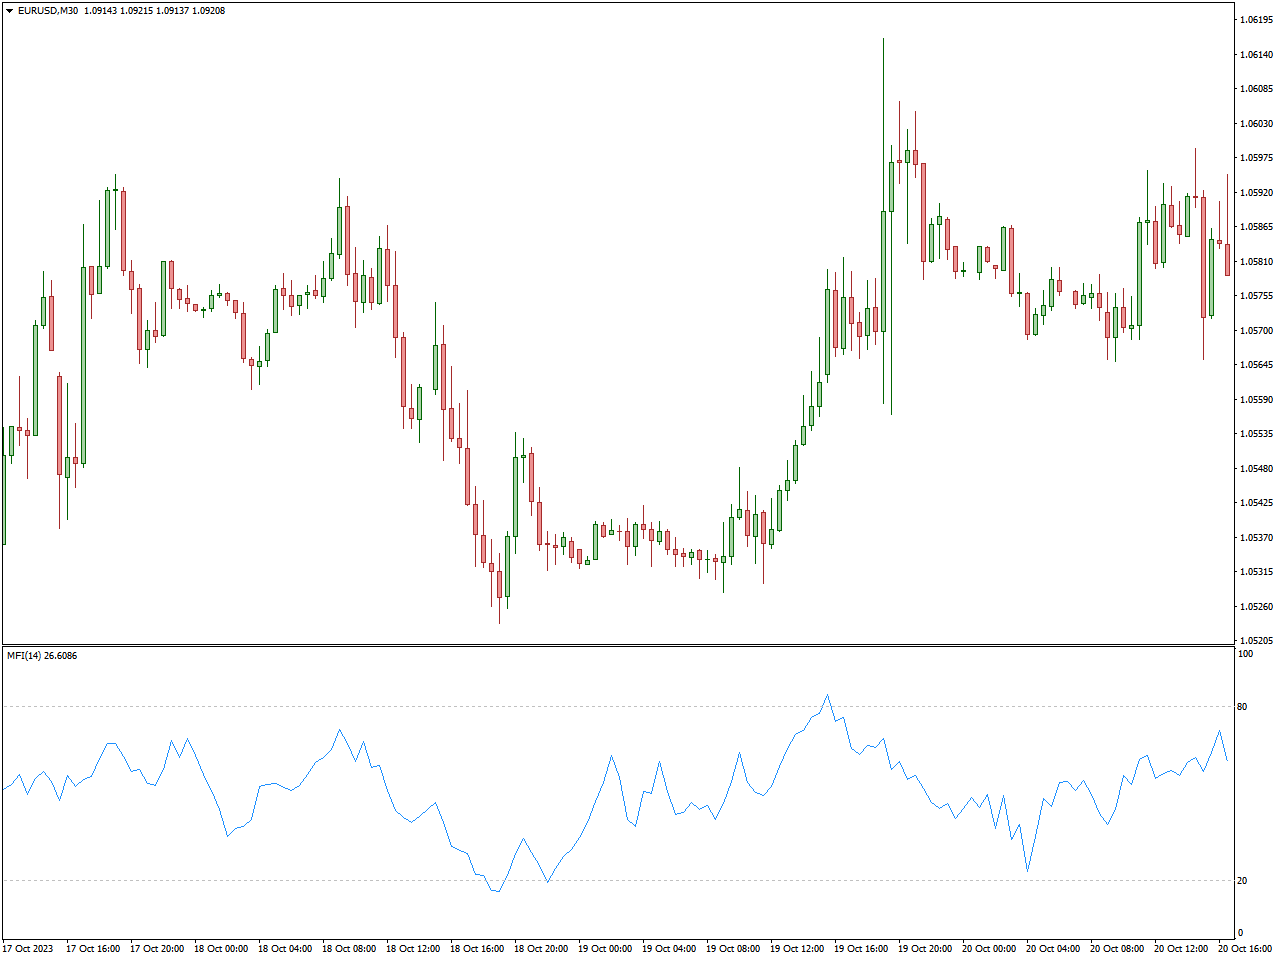
The Money Flow Index (MFI) is a widely used technical indicator in financial analysis, designed by Gene Quong and Avrum Soudack. It evaluates the strength and potential reversals in a price trend by incorporating both price and volume data.
Rather than focusing solely on price movements, the MFI considers the flow of money into and out of a security. Its functioning involves calculating the typical price for a specified period, determining positive and negative money flow based on price movements, and then deriving the money ratio. The MFI value, ranging from 0 to 100, is calculated using this ratio.
Interpretations of MFI values include identifying overbought conditions (MFI above 80), suggesting a potential price reversal to the downside, and oversold conditions (MFI below 20), indicating a potential price reversal to the upside.
FXSSI.Ratios
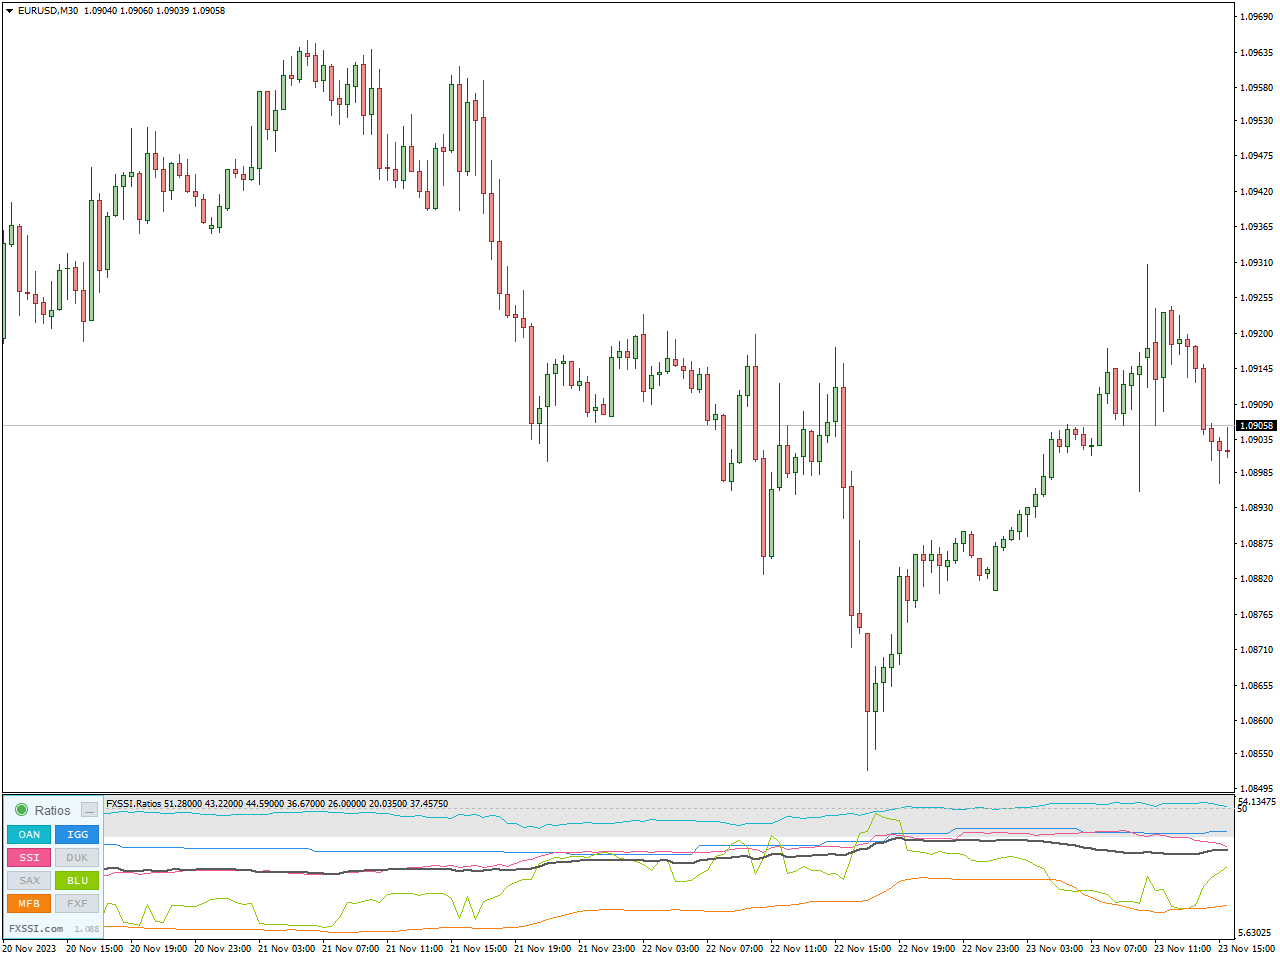
The FXSSI.Ratios Indicator, functioning as a technical analysis tool, gauges the balance between buyers and sellers in the market, presenting traders with a comprehensive view of market sentiment. Through a comparison of buyer and seller numbers, this indicator assists traders in recognizing potential reversals, overbought or oversold conditions, and validating trends, ultimately contributing to the formulation of more educated trading strategies.
A substantial proportion of buyers may signal robust bullish sentiment, while a heightened percentage of sellers could indicate pronounced bearish sentiment. By scrutinizing these ratios, traders can obtain insights into market sentiment and leverage this information to make more well-informed trading decisions.
The FXSSI.Ratios Indicator designed for MT4/5 proves to be an insightful tool, empowering traders to assess market sentiment through an analysis of the buyer and seller proportions in the market.
Conclusion
In summary, acquiring proficiency in overbought and oversold indicators is a crucial competency for traders looking to excel in the ever-changing financial environment. The valuable insights derived from these indicators enable you to predict market shifts, manage risks effectively, and capitalize on lucrative opportunities. By incorporating these Top 10 indicators into your trading strategy, you enhance your ability to attain steady success and elevate your overall trading expertise.