

Step into the realm of dynamic trading strategies! This extensive guide explores the craft of employing MACD (Moving Average Convergence Divergence) for both swing and intraday trading. As we navigate the nuances of MACD settings, you’ll uncover the techniques to refine this potent indicator, elevating your decision-making, optimizing profits, and mitigating risks in the constantly evolving financial markets.
How MACD works?
The Moving Average Convergence Divergence (MACD) serves as a trend-following momentum indicator, guiding traders in recognizing shifts in trend strength, direction, and momentum in a financial instrument’s price. Calculated from two exponential moving averages (EMAs), typically a 12-day and a 26-day EMA, the MACD line represents their difference. To enhance clarity, a signal line (often a 9-day EMA) smoothens the MACD line, creating the MACD histogram, which illustrates the gap between the two lines.
In interpretation, crossovers between the MACD line and signal line signal potential uptrends (bullish) or downtrends (bearish). Histogram peaks and troughs signify the strength of the current trend, with rising peaks indicating uptrend momentum and falling troughs pointing to downtrend momentum. Zero line crossings also provide insights into potential trend shifts.
Furthermore, MACD divergence, where the indicator’s direction contradicts price movement, offers signals for potential reversals. Bullish divergence suggests an upward reversal when prices hit new lows, but the MACD does not follow suit. Conversely, bearish divergence indicates a potential downward reversal when prices reach new highs, but the MACD does not.
To summarize, MACD is a versatile tool guiding traders in understanding momentum and trend direction, aiding in identifying entry and exit points for various trading styles, including trend following, momentum trading, and reversal strategies.
Best MACD settings for swing trading
For swing trading, optimizing MACD settings involves tailoring the indicator to identify medium-term trends and potential reversals. Here’s a recommended set of MACD settings for swing trading:
- Time Frame: Daily and Weekly Charts (for broader trends)
- Fast EMA (Exponential Moving Average): 12
- Slow EMA: 26
- Signal EMA: 9
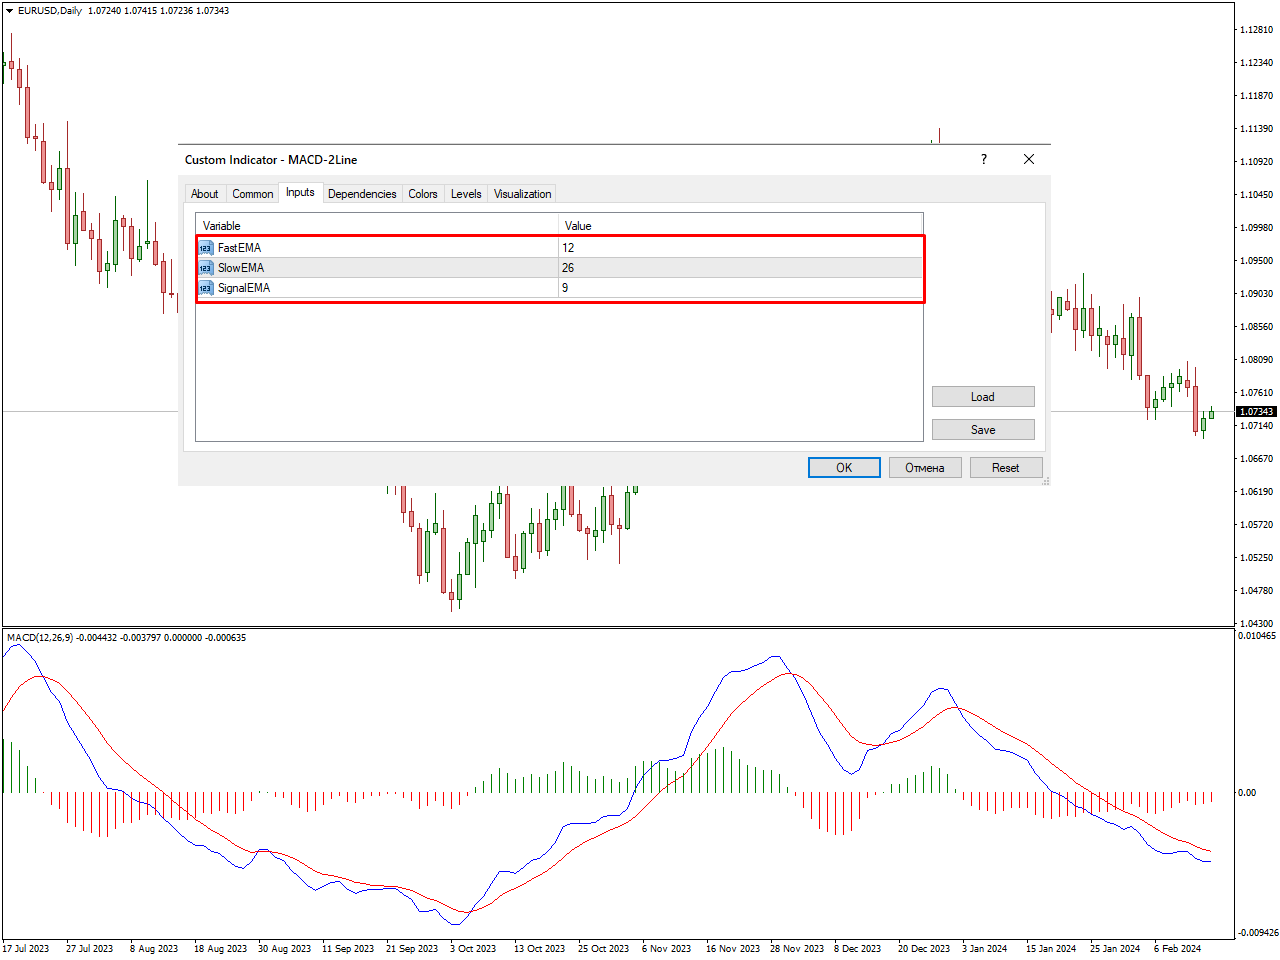
These settings strike a balance between responsiveness to medium-term price movements and smoothing out short-term noise. However, remember that the effectiveness of MACD settings can vary depending on market conditions and individual preferences.
- Time Frame: 1 hour chart
- Fast EMA: 12
- Slow EMA: 26
- Signal EMA: 9
These settings provide a standard configuration that works well for many traders on shorter timeframes. However, it’s important to note that there is no one-size-fits-all solution, and you may need to experiment and adjust based on your trading strategy, market conditions, and personal preferences. Always backtest your chosen settings on historical data to assess their performance before applying them in real-time trading.
- Time Frame: 4 hour chart
- Fast EMA: 9
- Slow EMA: 21
- Signal EMA: 3
Optimal for the 4-hour timeframe, these parameters strike a harmonious balance between detecting noteworthy price shifts and delivering signals responsive to medium-term trends. The 12-period Fast EMA ensures adaptability to short-term fluctuations, the 26-period Slow EMA mitigates noise, and the 9-period Signal EMA acts as a decisive trigger line. Tailored for traders seeking to pinpoint trends and potential entry or exit points within a span of a few days, it is crucial to assess these settings in alignment with your trading strategy and prevailing market conditions.
Best MACD settings for intraday trading
For intraday trading, where quick and precise decisions are crucial, you’ll want to adjust MACD settings to capture shorter-term price movements. Here’s a suggested set of MACD settings for intraday trading:
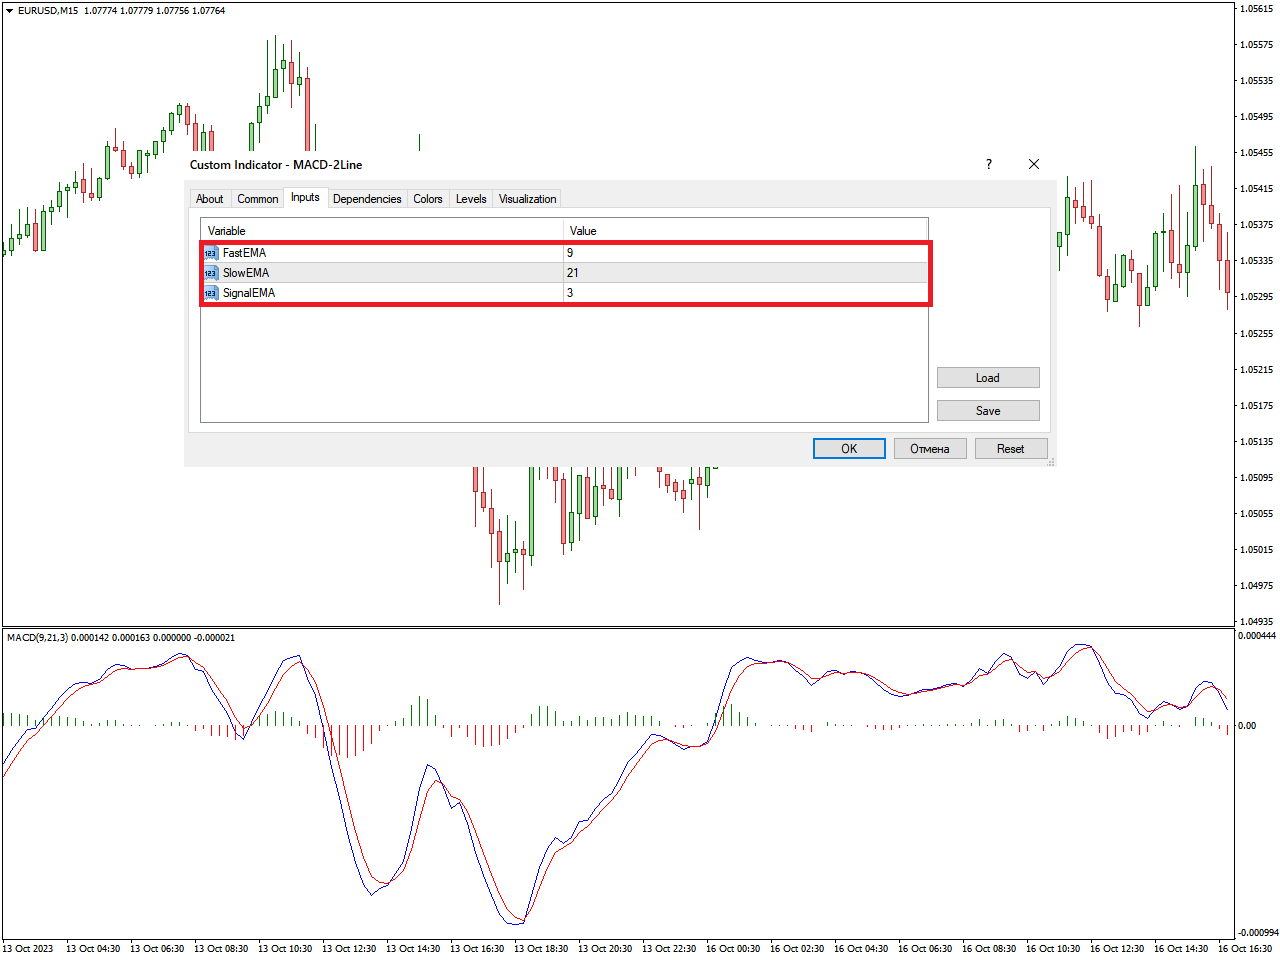
- Time Frame: 15-minute chart
- Fast EMA (Exponential Moving Average): 9
- Slow EMA: 21
- Signal EMA: 3
These settings are designed to be more sensitive to short-term price changes, making them suitable for capturing intraday trends and reversals. However, keep in mind that optimal settings can vary based on your specific trading preferences and the characteristics of the assets you are trading. Always backtest your chosen settings on historical data to evaluate their effectiveness before implementing them in real-time trading.
- Time Frame: 5-minute chart
- Fast EMA (Exponential Moving Average): 5
- Slow EMA: 13
- Signal EMA: 3
These settings are designed to be more responsive to short-term price fluctuations, making them suitable for capturing quick intraday trends and reversals. However, as always, the effectiveness of MACD settings can vary, and it’s important to backtest them on historical data to assess their performance before using them in live trading. Adjust the settings based on your trading strategy and market conditions if needed.
Most used MACD strategies
The Moving Average Convergence Divergence (MACD) is a versatile indicator used in various trading strategies. Here are some common MACD trading strategies:
Crossover Strategy:
- Signal: Buy when the MACD line crosses above the Signal line. Sell when the MACD line crosses below the Signal line.
- Rationale: Indicates potential trend reversals or the beginning of a new trend.
Divergence Strategy:
- Signal: Look for divergences between the price and MACD histogram.
- Rationale: Divergences can signal a potential reversal in the current trend.
Zero Line Crossover:
- Signal: Buy when MACD crosses above the zero line. Sell when MACD crosses below the zero line.
- Rationale: Indicates a potential shift from a bearish to a bullish trend or vice versa.
Histogram Analysis:
- Signal: Buy when the histogram bars turn positive and sell when they turn negative.
- Rationale: Provides a visual representation of the difference between the MACD line and Signal line.
Combination with Other Indicators:
- Signal: Use MACD in conjunction with other indicators, such as RSI or Fibonacci retracement levels.
- Rationale: Provides additional confirmation and filters out potential false signals.
Remember, while these strategies can be effective, no strategy is foolproof. It’s essential to consider risk management, backtest strategies on historical data, and adapt them based on changing market conditions. Additionally, combining MACD with other indicators and tools can enhance overall trading decision-making.
Conclusion
To sum up, unlocking the complete capabilities of MACD settings holds the potential to unlock success in both swing and intraday trading. With the knowledge gained from this article, you possess the tools to refine your strategy, adjust to market changes, and adeptly handle the intricacies of trading. Keep in mind, the path to profitable trading involves continuous learning and improvement – stay informed, maintain discipline, and allow optimized MACD settings to serve as your guiding light in the ever-changing terrain of financial markets.