
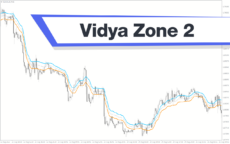
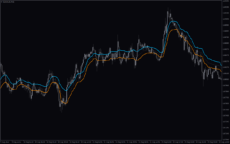
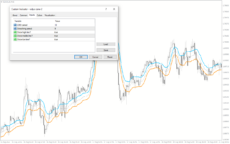
The Vidya Zone 2 Indicator is a free and popular forex indicator for the MT4 platform. It is useful to both beginner and experienced traders, as it can be used to identify potential trading opportunities in the forex market. The indicator uses a combination of moving averages and oscillators to generate buy and sell signals, which can be used to enter and exit trades. The indicator also displays the current trend, making it easier to determine when to enter and exit a trade. The Vidya Zone 2 Indicator is easy to use and can be quickly set up on any MT4 chart. It is also customizable, allowing traders to adjust the settings to suit their trading style. The indicator can be used to identify potential trade setups in any timeframe, from 1 minute to 1 month. It also includes a range of features such as alerts, which can be used to notify traders when a potential trade setup has been identified. The indicator can be used to identify potential trading opportunities in the forex market and can be customized to suit any trading style.

MT4


Vidya Zone 2
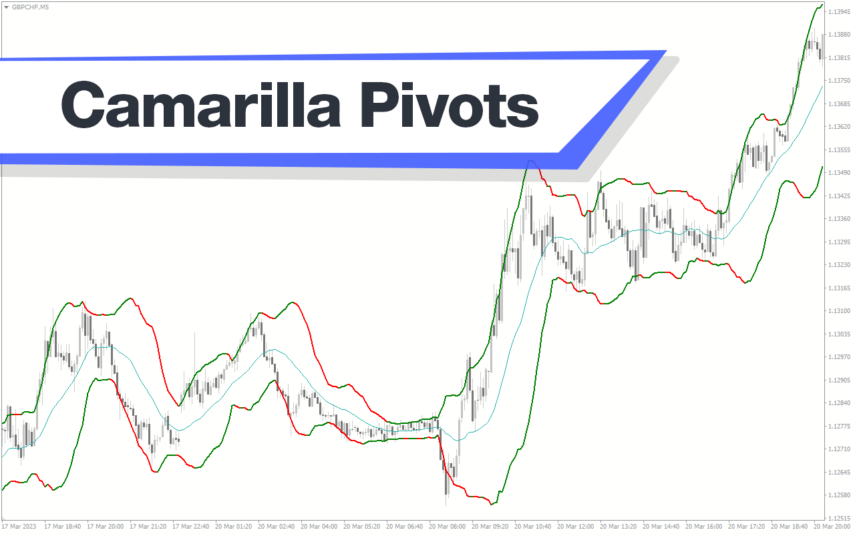
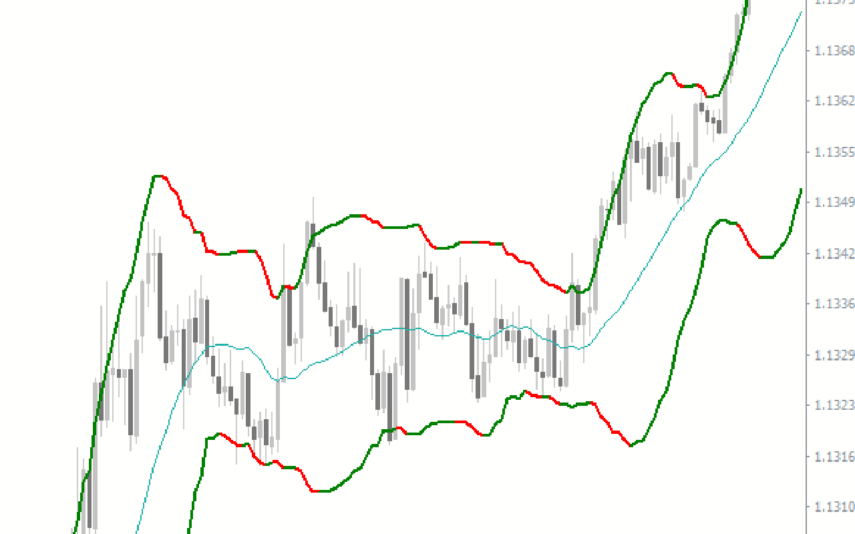
Vidya Zone 2 Indicator is a useful and popular free Forex indicator for MetaTrader 4 (MT4). The indicator displays a colored line on the chart, which is used to identify the trend direction and potential entry points. Vidya Zone 2 Indicator is a great tool for any trader who wants to maximize their profits in the Forex market.
| Trading Style | |
|---|---|
| Indicator Type | |
| Timeframe | |
| Platform |
0
People watching this product now!
Downloads - 8
Description
Reviews (0)
How to Install
Related products
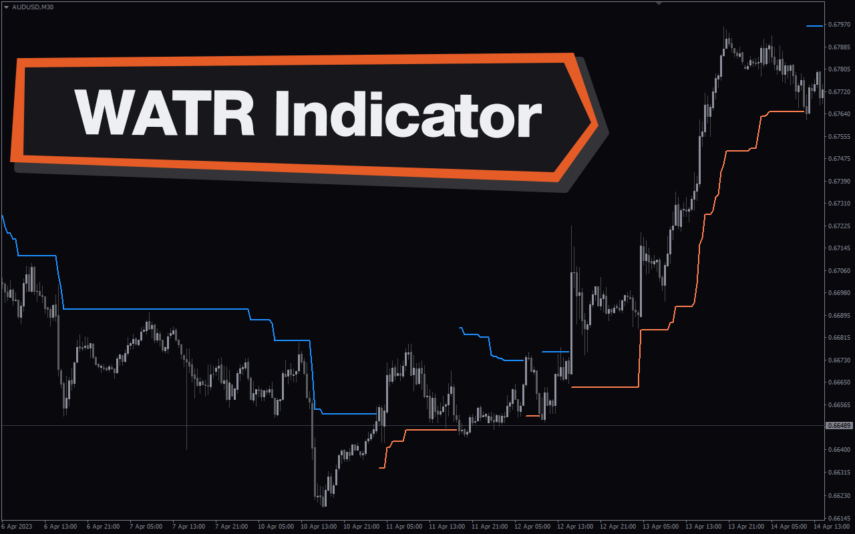
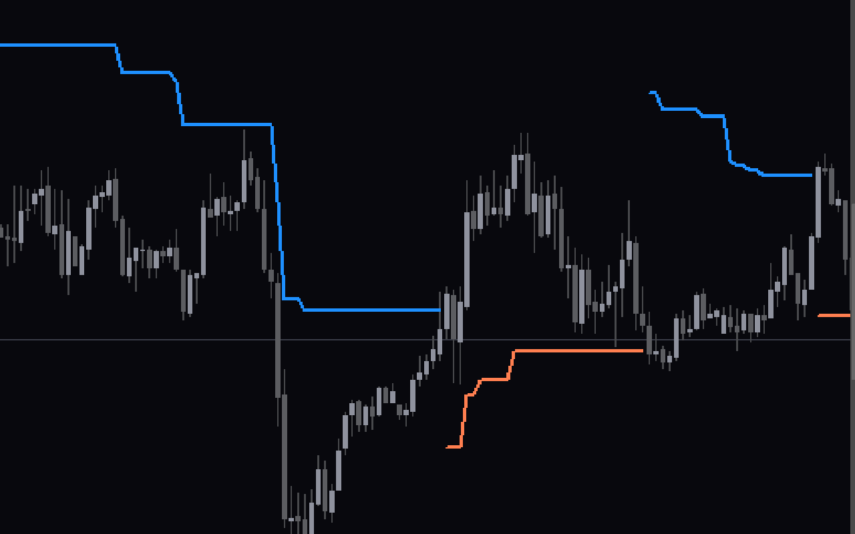
WATR Indicator
The WATR forex indicator is a popular and free MT4 indicator used by many traders. It can be used to identify trends, support and resistance levels, and other market conditions. It also offers a variety of features such as customizable alert settings, trend lines, and a wide range of indicators. It is also useful for scalping and day trading. The indicator is free to use and is popular among traders due to its accuracy and reliability.
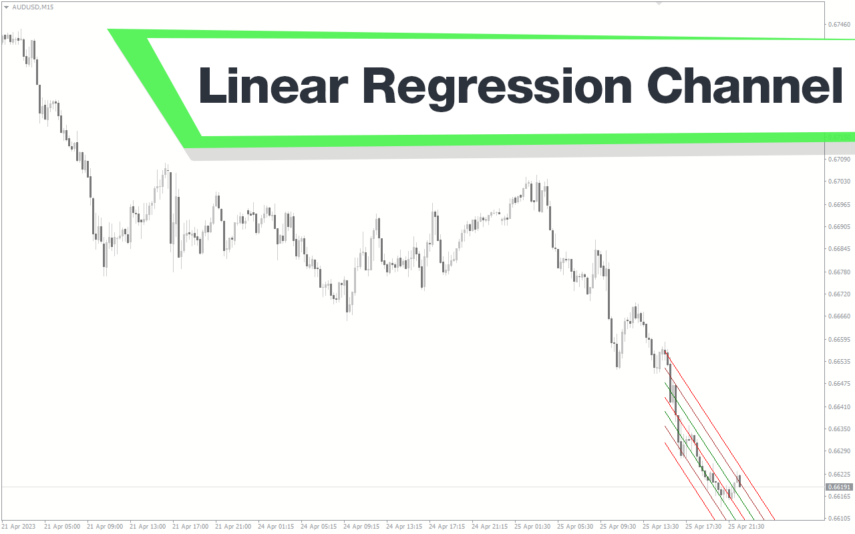
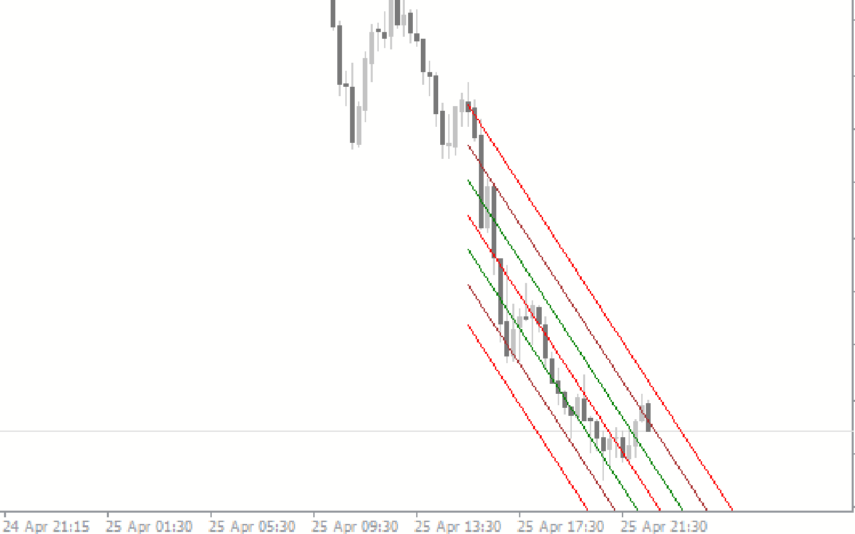
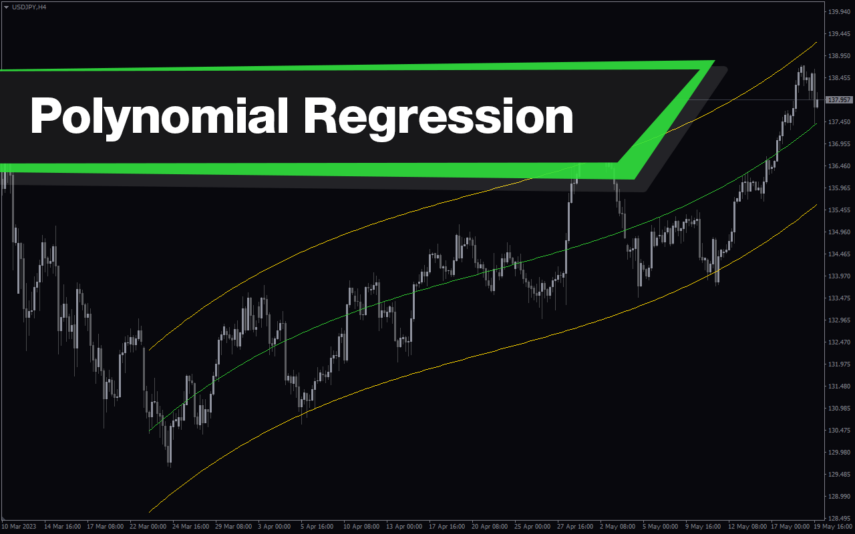
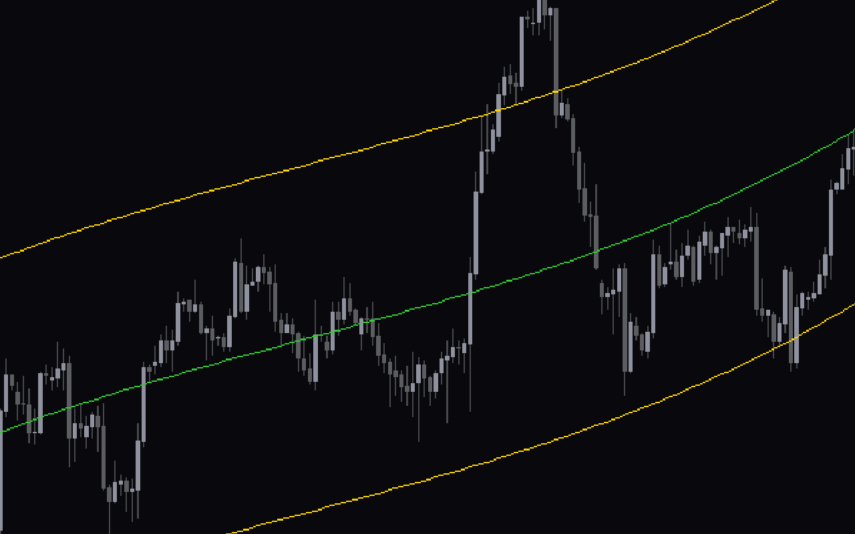
Polynomial Regression Channel
The Polynomial Regression Channel Indicator is a useful and popular free Forex indicator for MT4 (MetaTrader 4) that helps traders to identify trends and potential entry and exit points. It works by creating a channel around the price movements of an asset, which is determined by the polynomial regression line. The indicator then plots lines above and below the regression line to form the channel. With the Polynomial Regression Channel Indicator, traders can easily identify trends and potential entry and exit points, making it a popular and useful free Forex indicator for MT4.
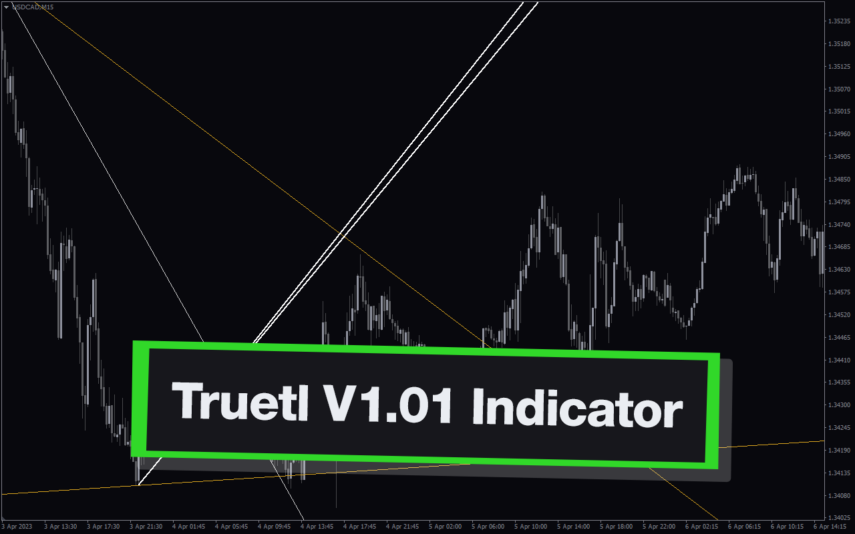
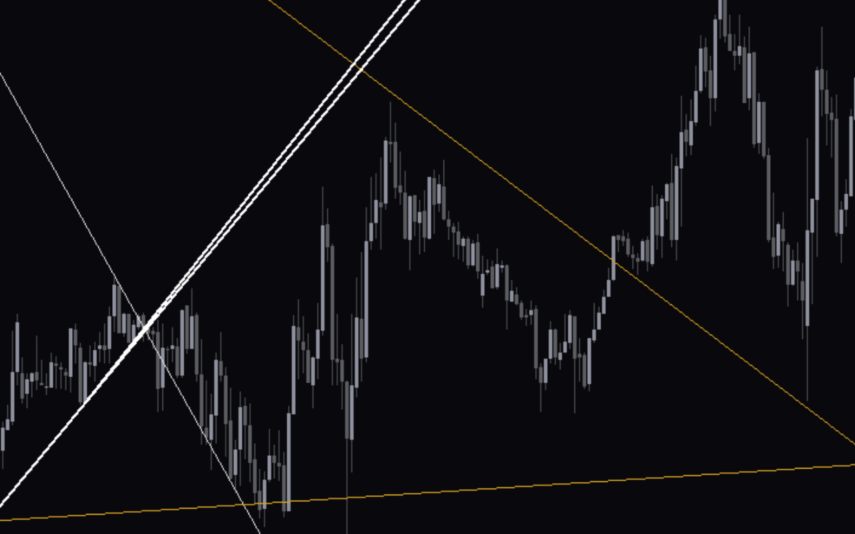
Truetl V1 01
The TrueTL v1.01 Forex Indicator is a useful and popular MT4 indicator that is free to use. The indicator works by automatically analyzing the market and providing buy and sell signals that are based on multiple technical indicators. The indicator also includes a trailing stop loss and take profit feature that helps to ensure that the trader is able to maximize their profits. Forex Indicator is a great tool for any trader who wants to make more informed trading decisions.
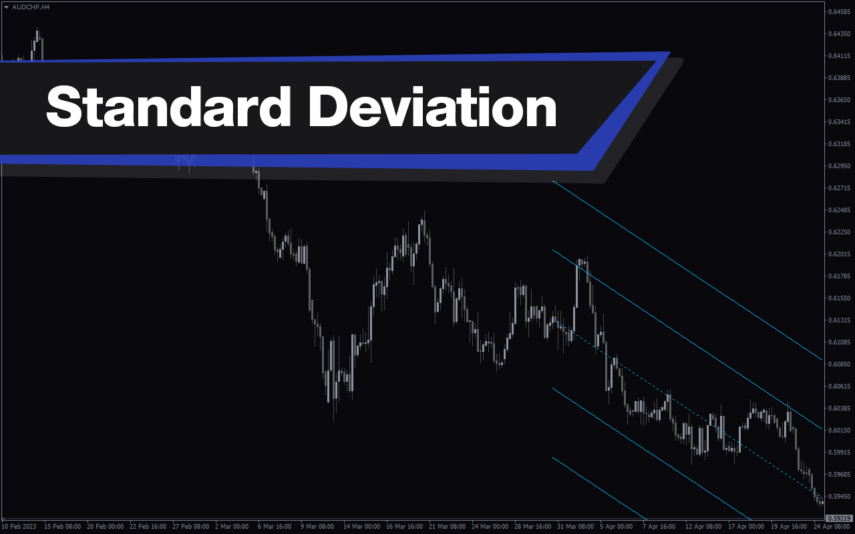
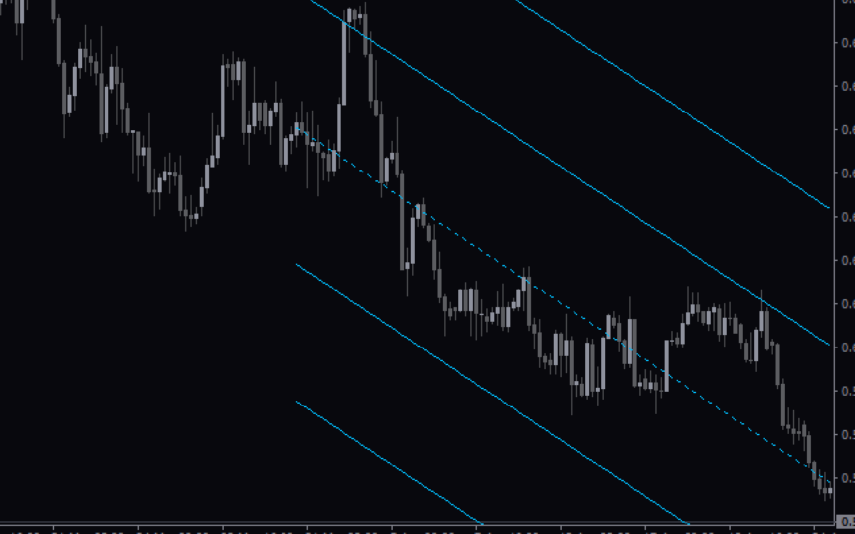
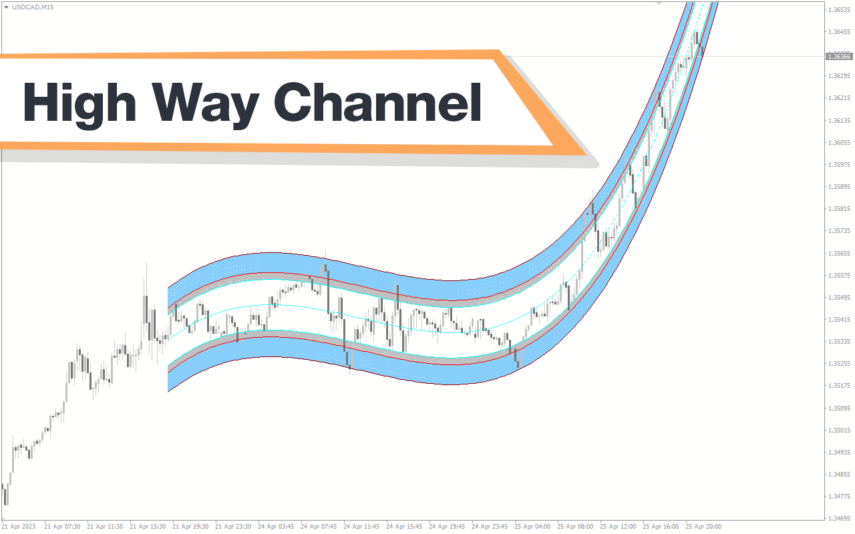
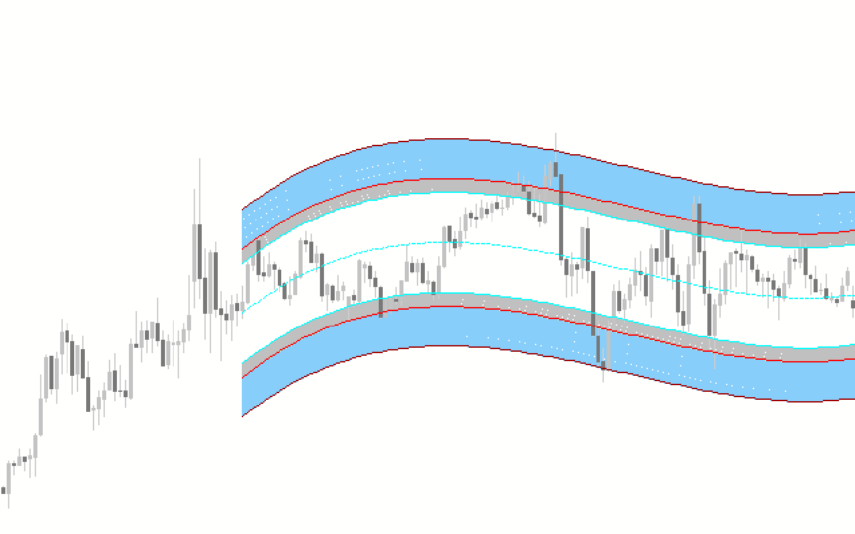
Standard Deviation Channel
The Standard Deviation Channel Indicator is a powerful and useful tool for Forex traders. It is a popular indicator for MT4 that is free to use and can be easily installed. The two lines represent the upper and lower bounds of the standard deviation, and they act as support and resistance levels. Traders can use these lines to identify potential entry and exit points when trading. This makes it an invaluable tool for traders who want to make informed and profitable trades.
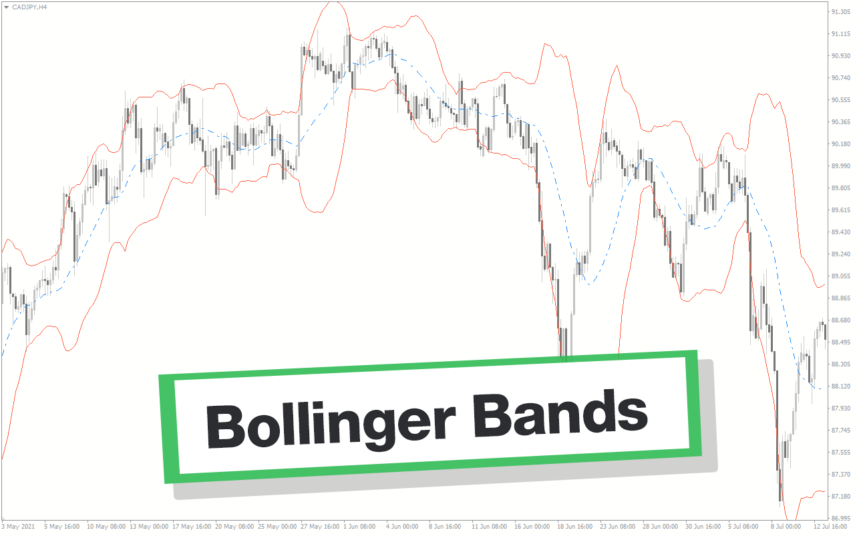
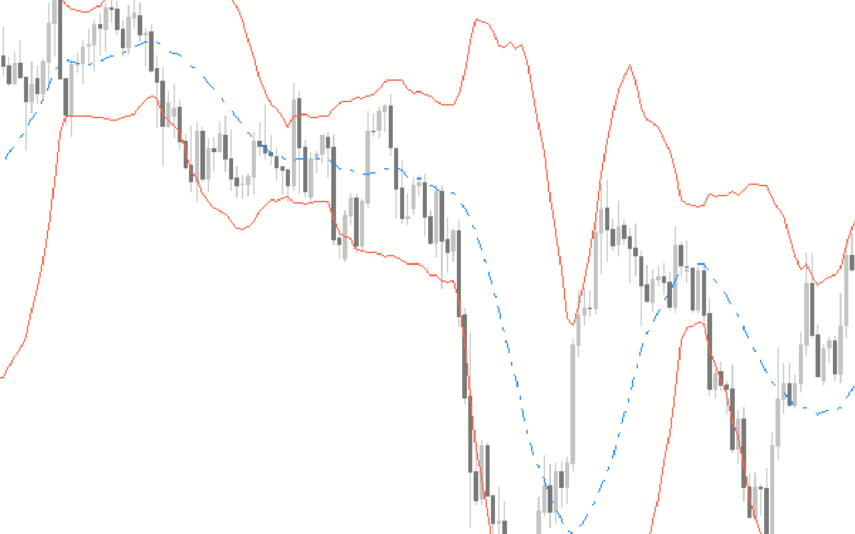
Bollinger Bands
The Bollinger Bands Indicator is a popular and useful Forex indicator for MT4 traders. It is a free indicator that helps traders to identify potential market entry and exit points. This indicator uses a combination of three moving averages to create upper and lower bands that can be used to identify price movements and trends. The bands are adjusted according to the market volatility and can be used to identify overbought and oversold conditions. The indicator is easy to use, and traders can customize the settings to suit their trading style. This indicator is a great tool for any trader looking to gain an edge in the Forex market.
Bollinger Bands Bicolor
The Bollinger Bands Bicolor Indicator is a popular and free Forex indicator for the MT4 platform. This useful indicator is used to identify potential reversals and breakouts in the Forex market. It works by plotting two different Bollinger Bands, one in a red color and one in a blue color, on the same chart. The red band indicates a potential bearish reversal, while the blue band indicates a potential bullish reversal. By using the Bollinger Bands Bicolor Indicator, traders can easily identify potential entry and exit points in the Forex market.

Reviews
There are no reviews yet.