
Swing trading is a popular trading strategy used in financial markets, including stocks, forex, cryptocurrencies, and commodities. It involves taking advantage of price “swings” or short- to medium-term price movements within a given trading range. Swing traders aim to profit from the price volatility that occurs over several days or weeks, as opposed to day traders who make many trades within a single day or long-term investors who hold assets for an extended period.
Top 20 indicators for swing trading
- FXSSI.StopLossClusters
- Trend Strength Indicator
- Adx Buy Sell Indicator
- AO Divergence Indicator
- Swing Point Highs and Lows Indicator
- Auto Channel Indicator
- Auto Fibonacci Retracement Indicator
- Ultimate Trend Signals Indicator
- BB Alert Arrows Indicator
- FXSSI.OpenInterest
- Breakout Zones Indicator
- Butterfly Pattern Indicator
- Candlestick Pattern Detector Indicator
- Donchian Channel Indicator
- Forex Reversal Indicator
- Fractal Support and Resistance Indicator
- FX Sniper Indicator
- A-Gimat Reversal Indicator
- Pullback Factor Indicator
- 3 Bars High Low Indicator
FXSSI.StopLossClusters
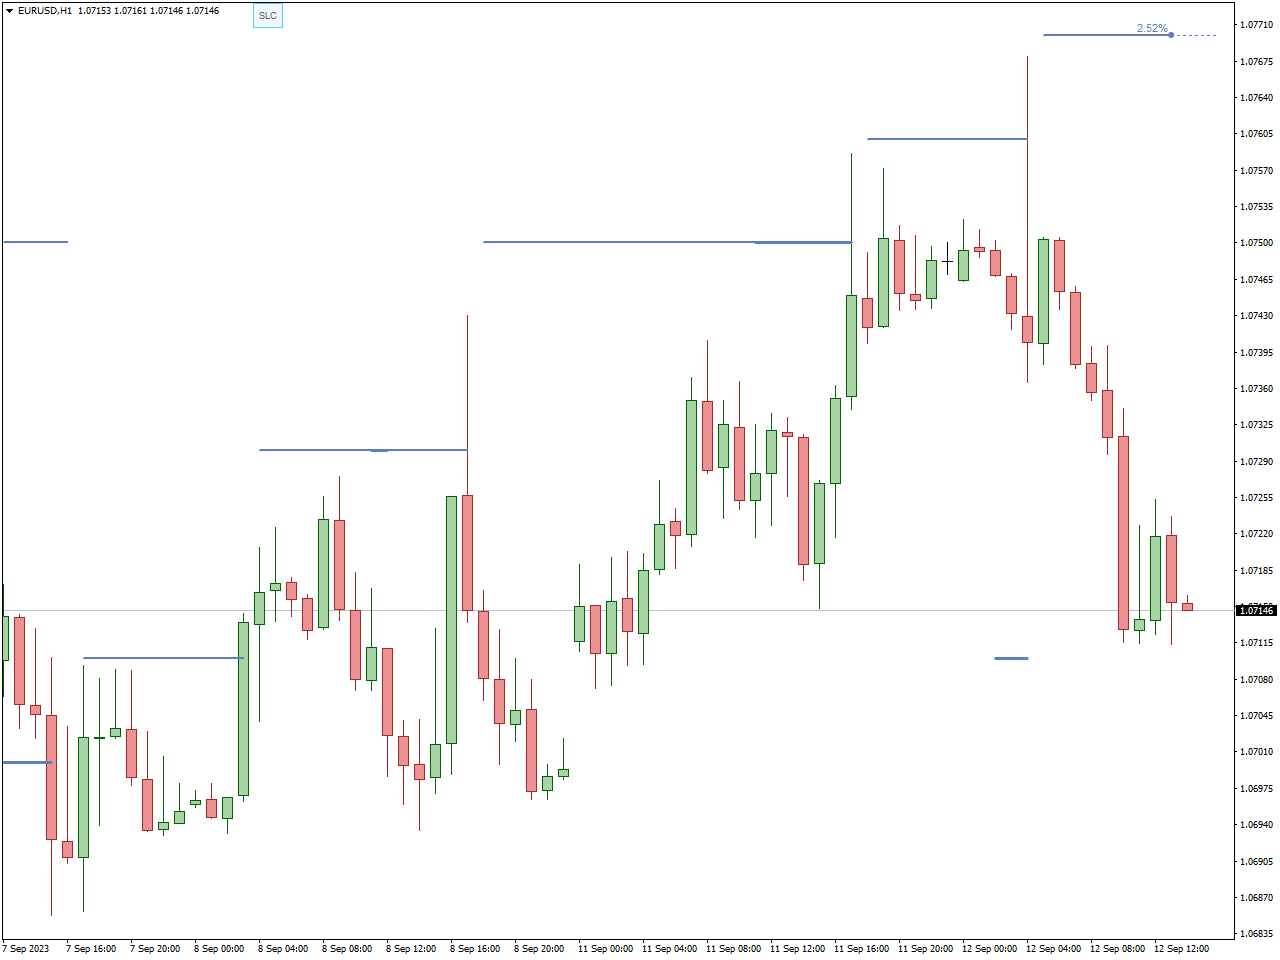
StopLossClusters is an indicator which shows a significant number of stop-loss orders from various traders or investors cluster around a specific price level. These clusters of stop-loss orders can have a notable impact on market dynamics because when the price approaches or reaches that level, a large number of market orders may get triggered as these stop-loss orders are executed. This can lead to increased volatility or a rapid price movement as traders attempt to exit their positions
Traders and analysts often pay attention to these stop-loss clusters as they can serve as potential support or resistance levels on price charts. If a cluster of stop-loss orders is below the current market price, it may act as a support level, and if it’s above the current market price, it may act as resistance.
Traders may use this information as part of their technical analysis to make more informed trading decisions. For example, if they see a significant stop-loss cluster just below a support level, they might be cautious about shorting the asset, as there could be a strong bounce when those orders are triggered.
Trend Strength Indicator
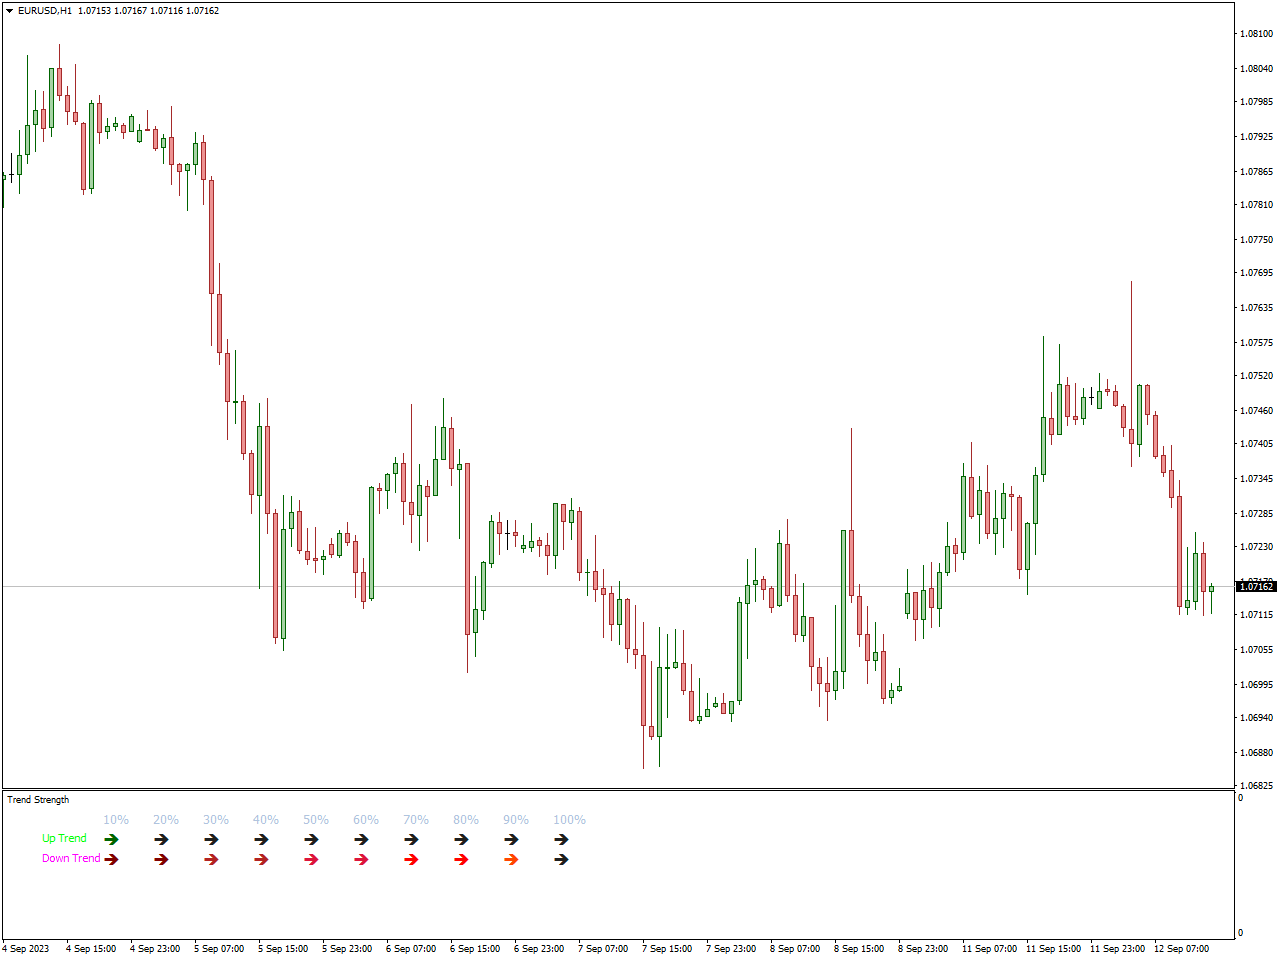
A Trend Strength Indicator is a technical analysis tool used by traders and investors to assess the strength or intensity of a price trend in a financial asset, such as a stock, currency pair, commodity, or cryptocurrency. The primary purpose of such indicator is to help traders identify the strength of a trend and potentially make more informed trading decisions.
You can utilize the trend strength indicator independently or integrate it with other technical indicators to enhance your trading strategies. It presents trend direction and strength through green and red bar charts.
Adx Buy Sell Indicator
The ADXBuySell Indicator is a technical analysis tool used in trading to help identify potential buy and sell signals based on the Average Directional Index (ADX). This indicator typically plots buy and sell signals on a price chart based on specific conditions related to the ADX.
The ADXBuySell Indicator may generate buy signals when the ADX crosses above a certain threshold or when it shows an uptrend in strength. Conversely, sell signals may be generated when the ADX crosses below a threshold or exhibits a weakening trend.
AO Divergence Indicator
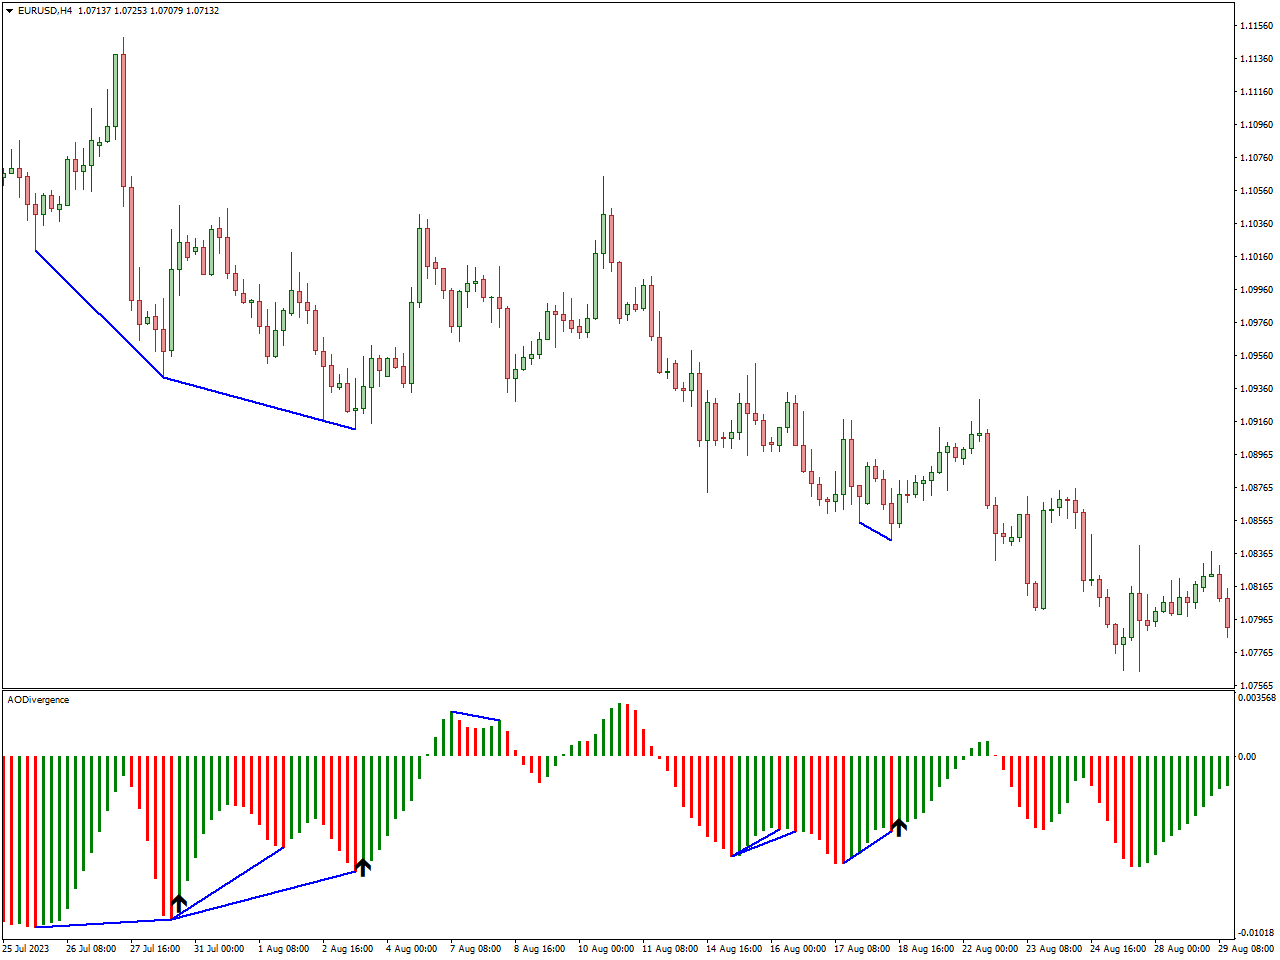
The AO Divergence Indicator is a technical analysis tool used in trading to identify divergence patterns on the Awesome Oscillator (AO) indicator. The Awesome Oscillator is a momentum oscillator that helps traders gauge the market’s momentum based on the relationship between two moving averages of the price.
Divergence occurs when the price of an asset moves in a different direction than the indicator, suggesting a potential shift in momentum or trend reversal. The AO Divergence Indicator is designed to spot these divergence patterns between the Awesome Oscillator and the price chart.
Bullish Divergence occurs when the price of the asset forms lower lows, but the Awesome Oscillator indicator forms higher lows. It may signal a potential bullish reversal, suggesting that selling momentum is weakening, and buyers may step in.Conversely, bearish divergence happens when the price forms higher highs while the Awesome Oscillator forms lower highs. This may indicate a potential bearish reversal, suggesting that buying momentum is waning, and sellers could become more active.
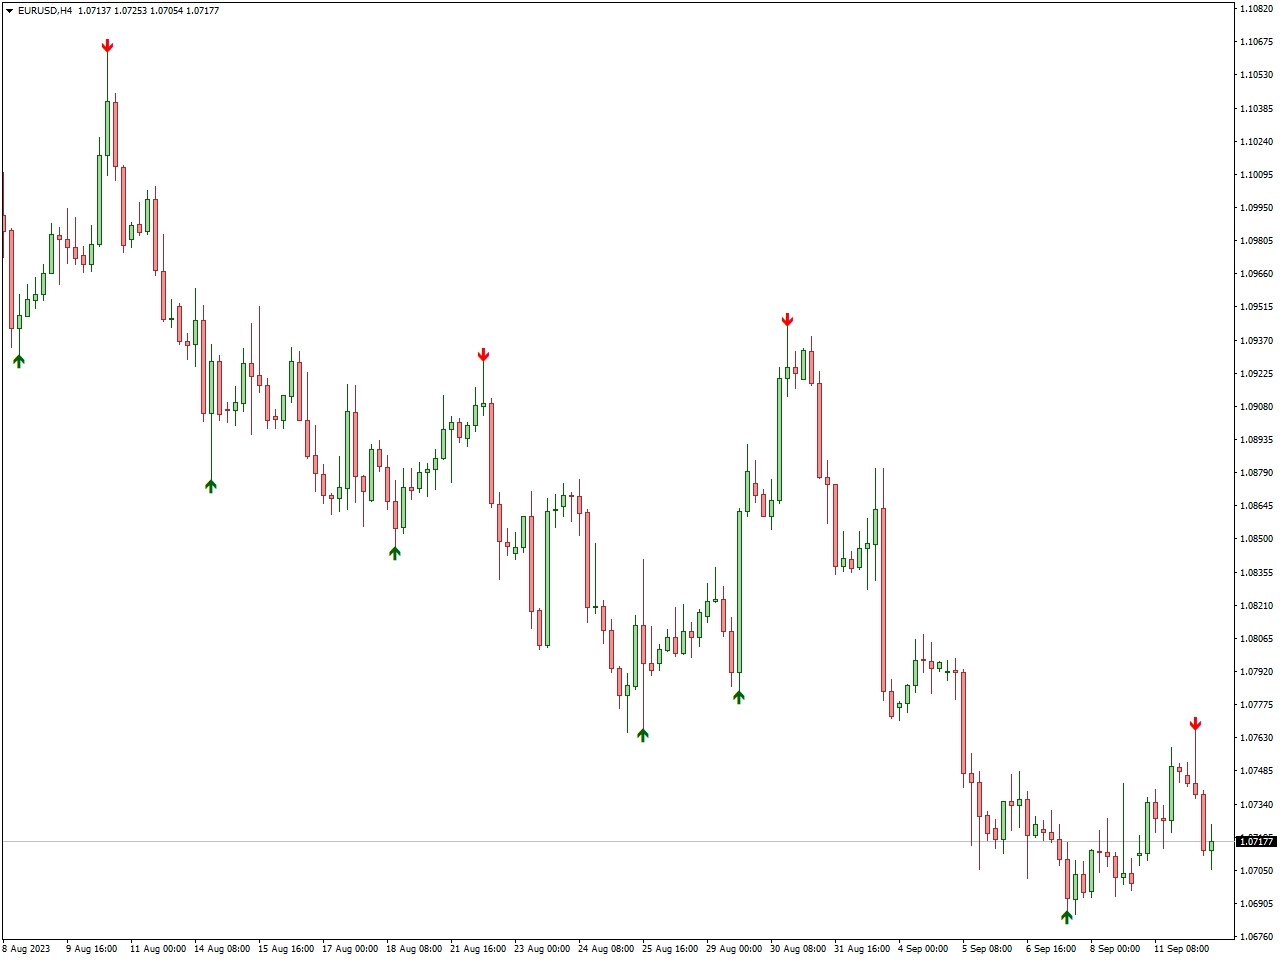
Swing Point Highs and Lows Indicator
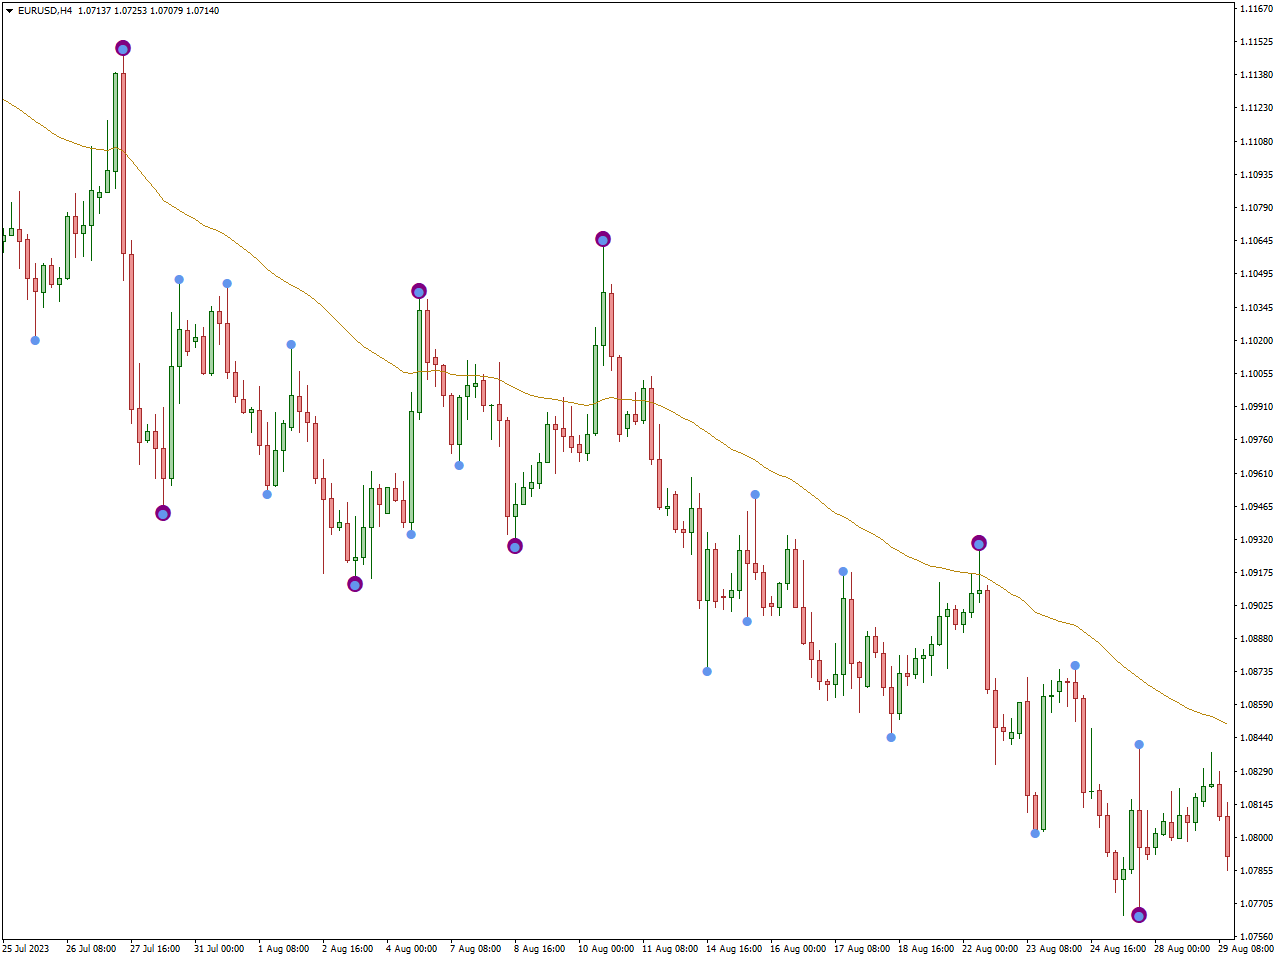
The Swing Point Highs and Lows Indicator is a technical analysis tool used in trading to identify significant turning points or reversals in price trends. It focuses on pinpointing key levels in a price chart where the market has made notable changes in direction, marking both swing highs and swing lows.
A swing high occurs when the price of an asset reaches a point that is higher than the prices immediately before and after it. It represents a potential resistance level where the market might reverse from an upward trend to a downward trend.Conversely, a swing low happens when the price of an asset reaches a point that is lower than the prices immediately before and after it. It represents a potential support level where the market might reverse from a downward trend to an upward trend.
The Swing Point Highs and Lows Indicator helps traders identify these critical points on a price chart. These points are often used to draw trendlines or assess potential areas of support and resistance. Traders may use them to make decisions about entering or exiting positions or to set stop-loss and take-profit levels.
Auto Channel Indicator
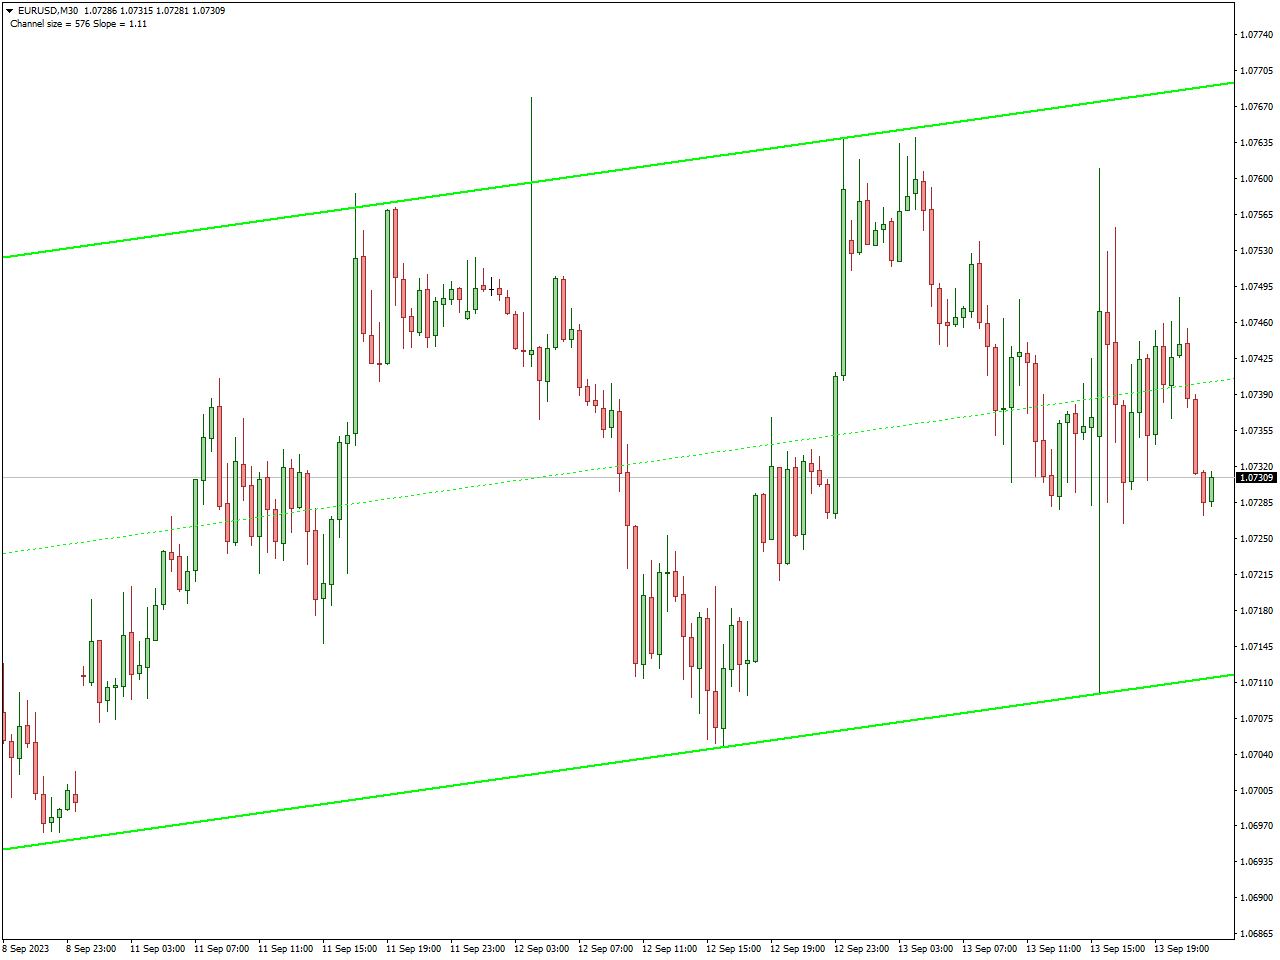
The Auto Channel Indicator is a technical analysis tool used in trading to automatically draw trend channels on price charts. Trend channels consist of two parallel lines that encompass price movement within a specific trend. They help traders identify potential support and resistance levels, as well as the direction and strength of a trend.
The indicator automatically identifies recent price highs and lows or other relevant points on the price chart to draw trend channels. These channels are typically plotted parallel to each other, with one line connecting recent highs (upper channel line) and the other connecting recent lows (lower channel line).
The upper channel line often acts as a resistance level, while the lower channel line acts as a support level. Traders look for price interactions with these lines to make trading decisions.
The orientation of the channel lines (whether they are sloping up, down, or horizontal) can indicate the direction of the prevailing trend. An ascending channel suggests an uptrend, a descending channel suggests a downtrend, and a horizontal channel suggests a range-bound or consolidating market.
Auto Fibonacci Retracement Indicator
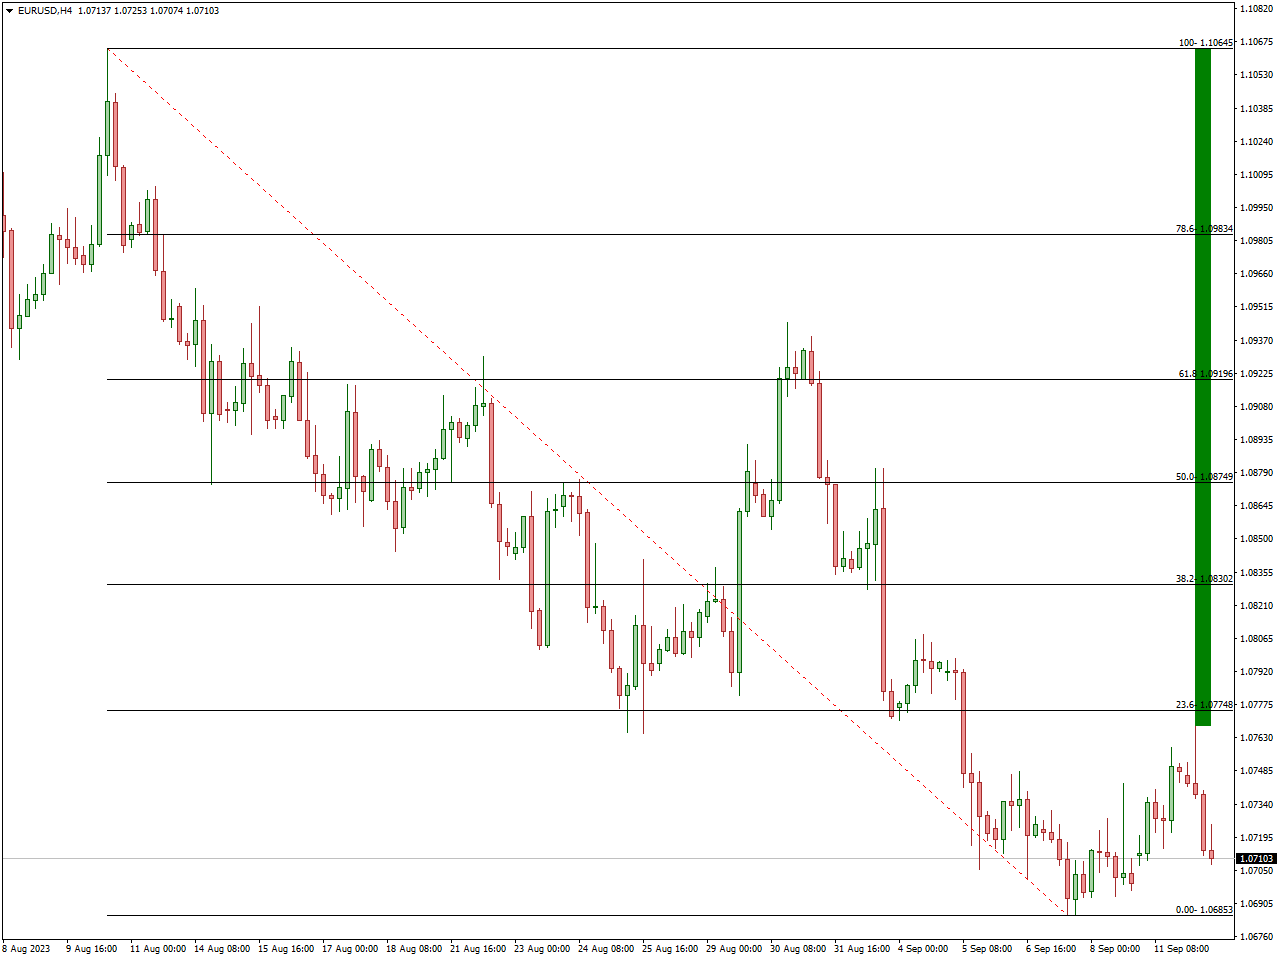
The Auto Fibonacci Retracement Indicator is a technical analysis tool used in trading to automatically plot Fibonacci retracement levels on a price chart. Fibonacci retracement levels are horizontal lines that represent potential support and resistance levels based on Fibonacci ratios. Traders use these levels to identify potential reversal points or areas of interest in a price trend.
This indicator automatically identifies a significant swing low and a significant swing high on the price chart. These two points are used as reference points to calculate and plot Fibonacci retracement levels.
Traders use these Fibonacci retracement levels as potential support when the price is in an uptrend or as resistance when the price is in a downtrend. They look for price reactions or reversals near these levels.The Auto Fibonacci Retracement Indicator can help traders make decisions about entering or exiting positions, setting stop-loss orders, and identifying potential price targets.
Ultimate Trend Signals Indicator
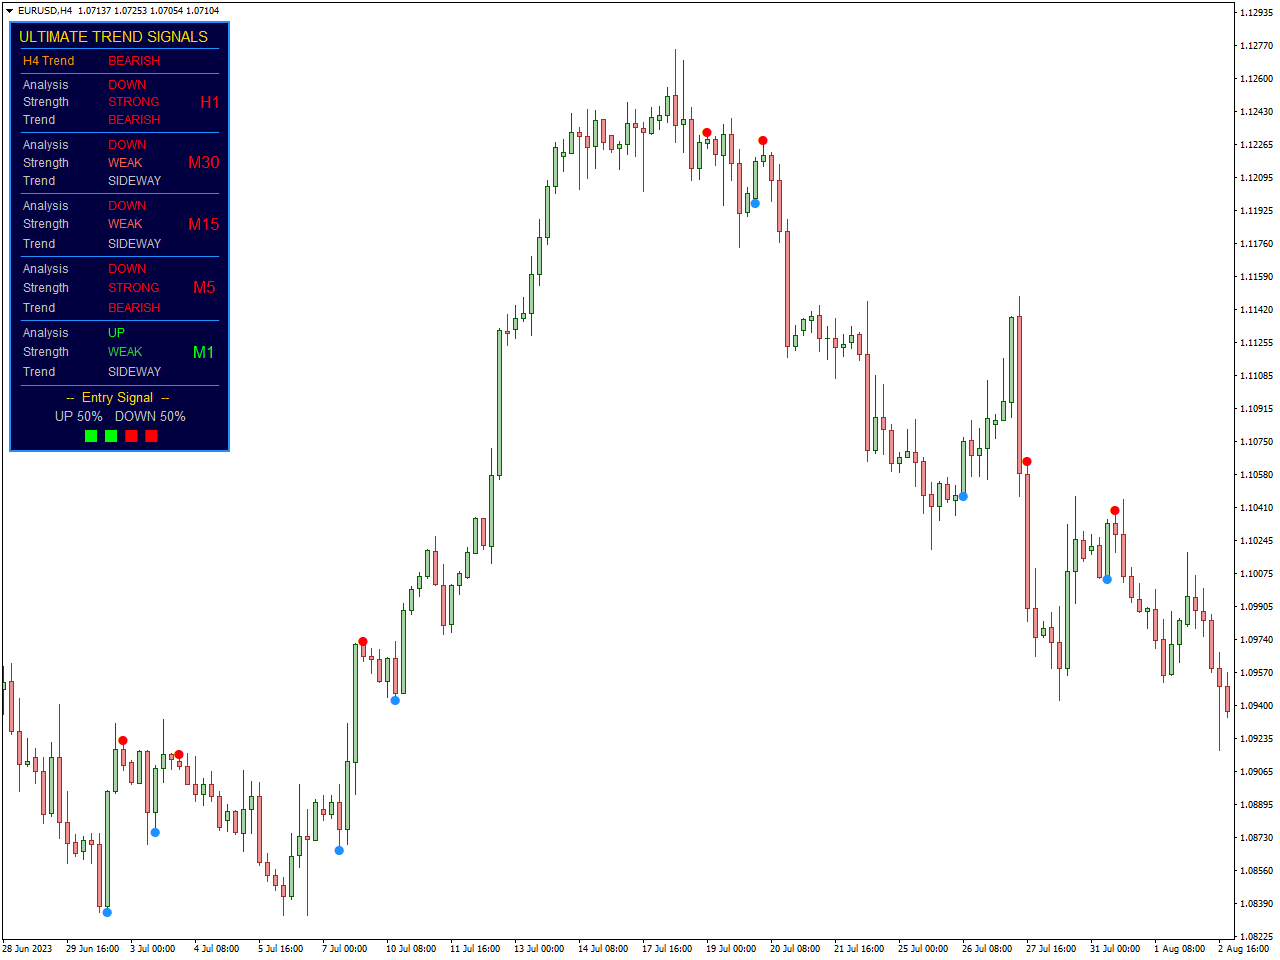
The Ultimate Trend Signals V2 indicator in MT4 generates arrow signals for both buying and selling, utilizing ADX and pivot levels as its basis. Additionally, it provides valuable information on trend direction, strength, and trade recommendations for separate price charts.
Furthermore, it presents trade recommendation to either buy or sell, representing this crucial information through arrow signals directly on the chart. Consequently, forex traders can conveniently track these trading signals and execute their buy or sell orders accordingly.
When the indicator displays a BLUE arrow signal on the price chart, it signifies the initiation of an upward or BULLISH price trend. As a result, forex traders may consider entering a BUY position, placing their stop loss order just below the most recent swing low. Likewise, the optimal take profit level is often set at the point where the opposite trading signal appears. This approach aims to capture potential gains as the bullish trend unfolds while managing risk with the stop loss order.
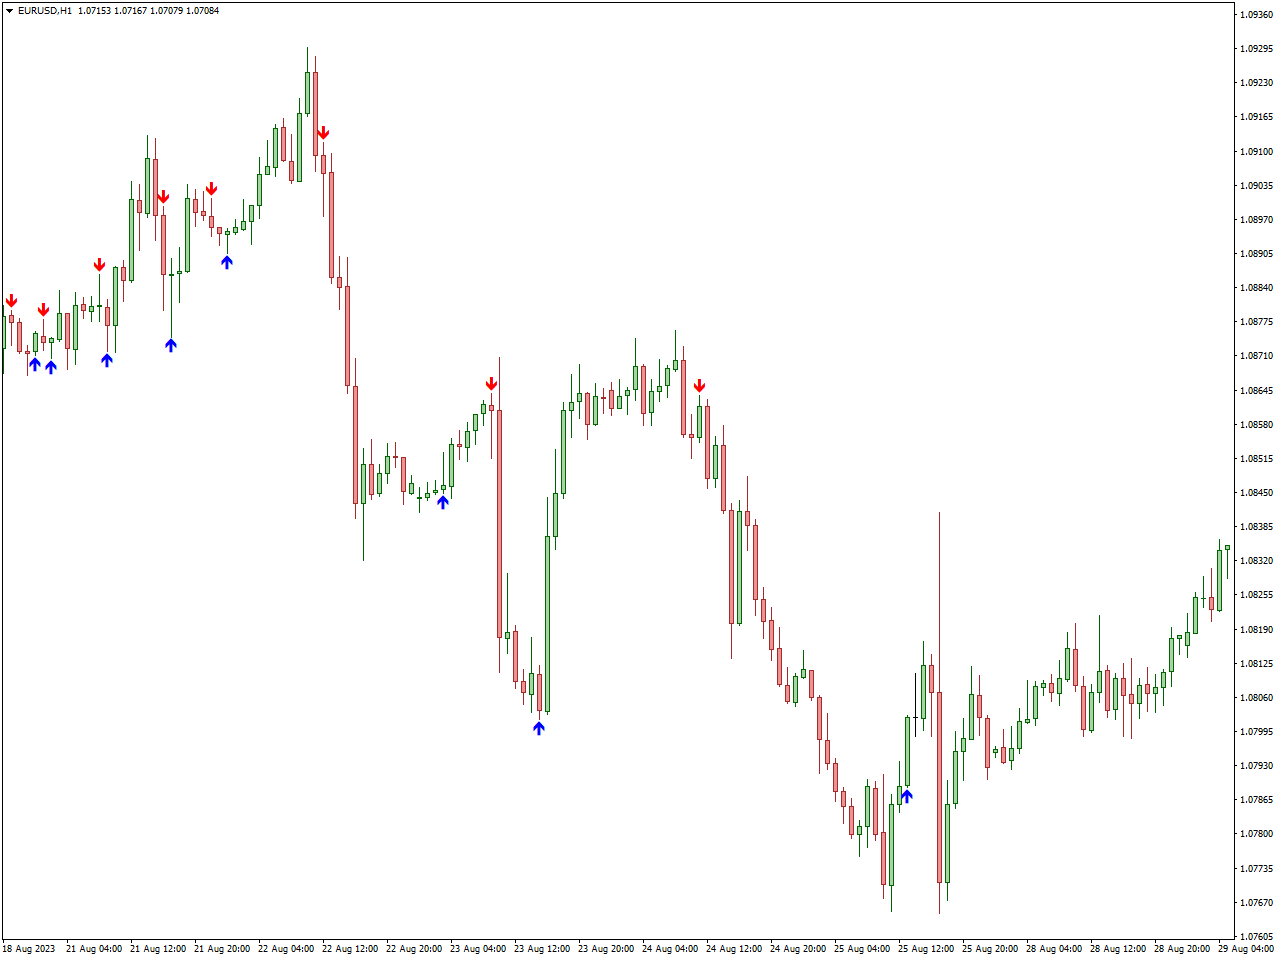
BB Alert Arrows Indicator
The “BB Alert Arrows” is a trading indicator used in technical analysis, primarily in the field of forex trading and other financial markets. This indicator is often associated with Bollinger Bands (BB), a popular volatility indicator created by John Bollinger. The BB Alert Arrows indicator is designed to provide signals or alerts based on price movements in relation to the Bollinger Bands.
A buy (or long) signal is usually indicated by an arrow pointing up. It suggests that the price has moved lower and touched or breached the lower Bollinger Band, potentially signaling an oversold condition and a buying opportunity.A sell (or short) signal is typically indicated by an arrow pointing down. It suggests that the price has moved higher and touched or breached the upper Bollinger Band, potentially signaling an overbought condition and a selling opportunity.
Traders often use the “BB Alert Arrows” indicator to help identify potential reversal points or overextended price conditions.
FXSSI.OpenInterest
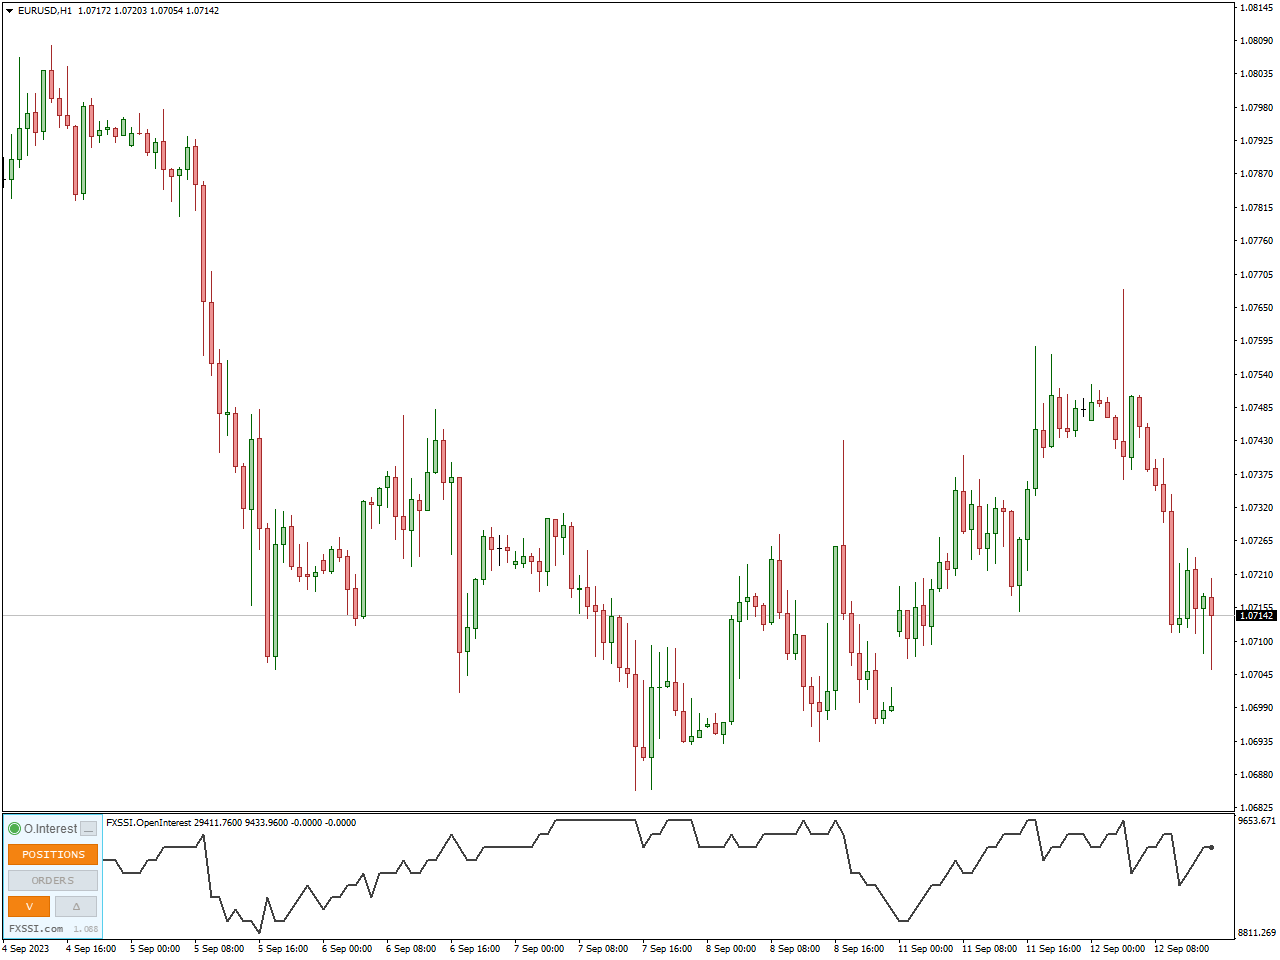
The FXSSI Open Interest Indicator is a tool used in forex (foreign exchange) trading to analyze and gauge market sentiment. Open interest refers to the total number of outstanding or open positions in a particular currency pair or forex instrument. It provides insights into how traders are positioned in the market and can help traders make more informed decisions.
The indicator usually collects data from various forex brokers or platforms to determine the open interest in different currency pairs.It often presents the open interest data in the form of a chart or graph. This chart can show open interest changes over time.
Traders can use the open interest information to complement their trading strategies. For example, if open interest is rising along with a price uptrend, it may provide additional confidence in the bullish trend.Understanding open interest can also be valuable for risk management. High open interest can indicate crowded trades, potentially increasing the risk of sudden reversals.
Breakout Zones Indicator
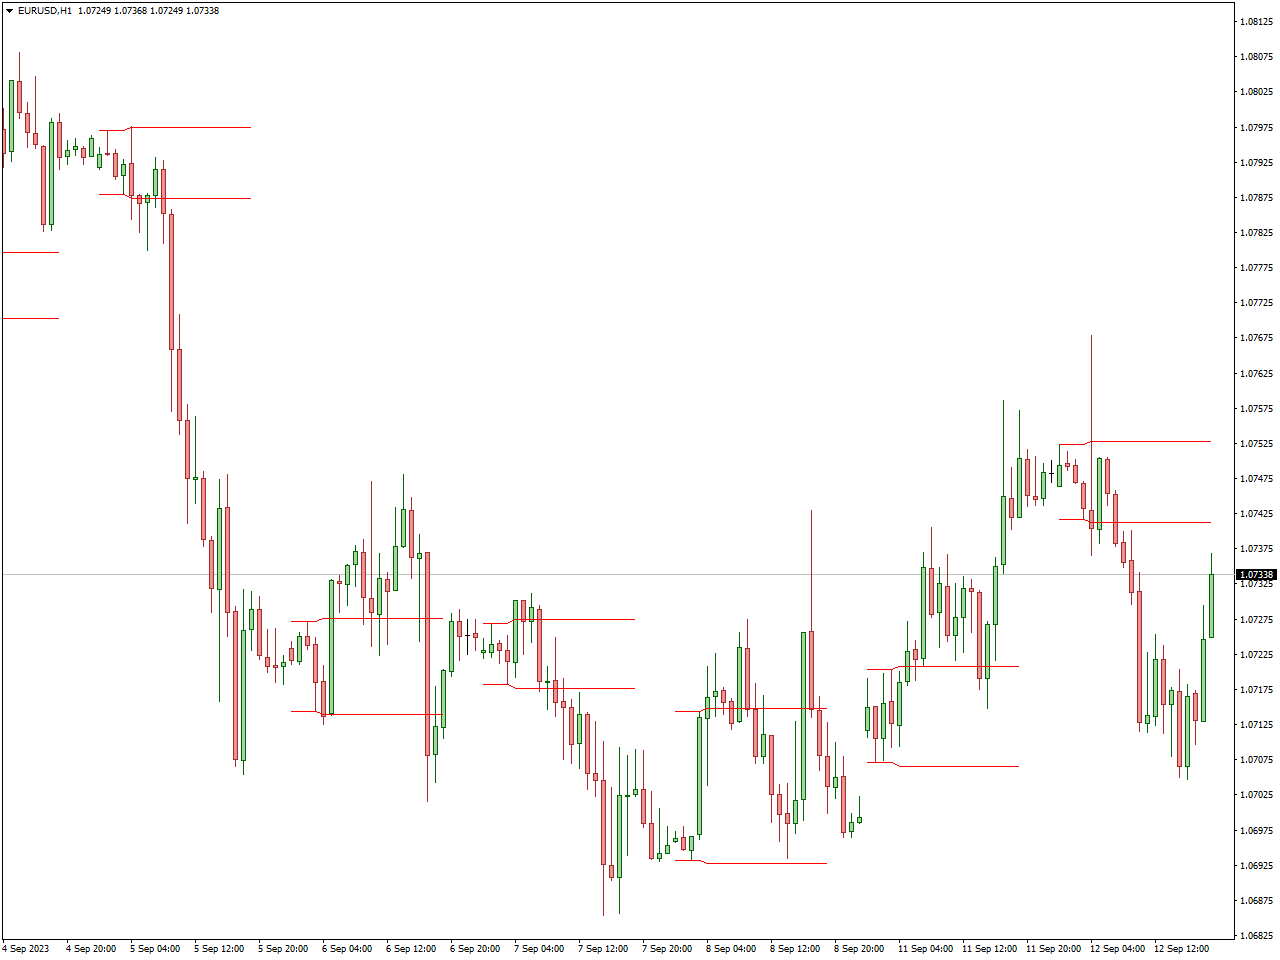
The Breakout Zones Indicator is a valuable tool in the world of technical analysis for trading various financial markets, including Forex. This indicator is designed to identify key price levels where significant breakout movements are likely to occur. Traders use it to spot potential trading opportunities and make more informed decisions.
The Breakout Zones Indicator identifies specific price ranges or zones on a price chart where significant consolidation or congestion has occurred. These zones often represent areas of potential price breakouts.When the price approaches or touches these identified zones, the indicator generates signals.
Traders often use additional technical analysis tools and confirmatory signals to validate the breakout before entering a trade. This can include using oscillators, moving averages, or candlestick patterns.
Butterfly Pattern Indicator
The Butterfly Pattern Indicator is a technical analysis tool used by traders, primarily in the realm of forex and stock trading, to identify potential reversal points in price trends. This indicator is based on the Fibonacci retracement levels and is used to spot specific price patterns on a chart.
If the indicator suggests a completed butterfly pattern and other confirmatory signals align, traders may consider entering a trade. The direction of the trade depends on whether it’s a bullish or bearish butterfly pattern.
The Butterfly Pattern Indicator can be a valuable tool for traders who employ harmonic pattern trading strategies. It helps identify potential reversal or trend continuation points in the market, providing a structured approach to trading.
Candlestick Pattern Detector Indicator
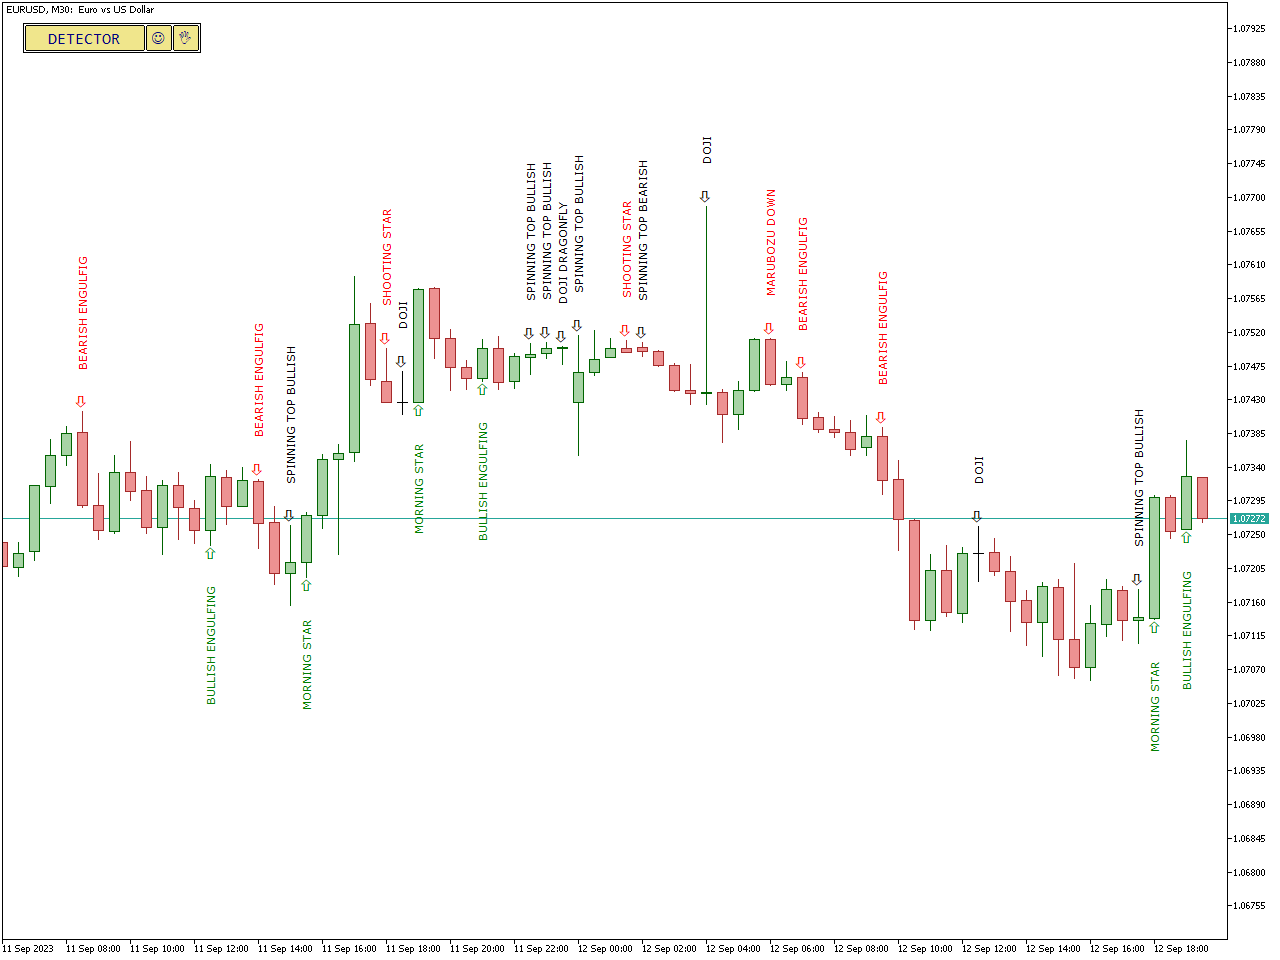
A Candlestick Pattern Detector Indicator is a technical analysis tool used in financial markets, including Forex, to automatically identify and highlight specific candlestick patterns on price charts. Candlestick patterns are a visual representation of price movements and are used by traders to make predictions about future price movements. These patterns can provide insights into market sentiment and potential trading opportunities.
The indicator scans the historical price data on a chart, looking for specific candlestick patterns. Candlestick patterns are formed by a series of one or more candlesticks with distinct shapes and configurations, such as doji, engulfing, hammer, shooting star, and many others.When the indicator identifies a relevant candlestick pattern, it marks it on the price chart.
Depending on the trading strategy and risk tolerance, the indicator may generate buy, sell, or hold signals based on the presence and direction of the identified candlestick patterns.
Candlestick patterns can be valuable tools for traders as they can provide insights into market sentiment and potential reversals or continuation of trends. A Candlestick Pattern Detector Indicator streamlines the process of identifying these patterns, making it easier for traders to spot potential opportunities in the market.
Donchian Channel Indicator
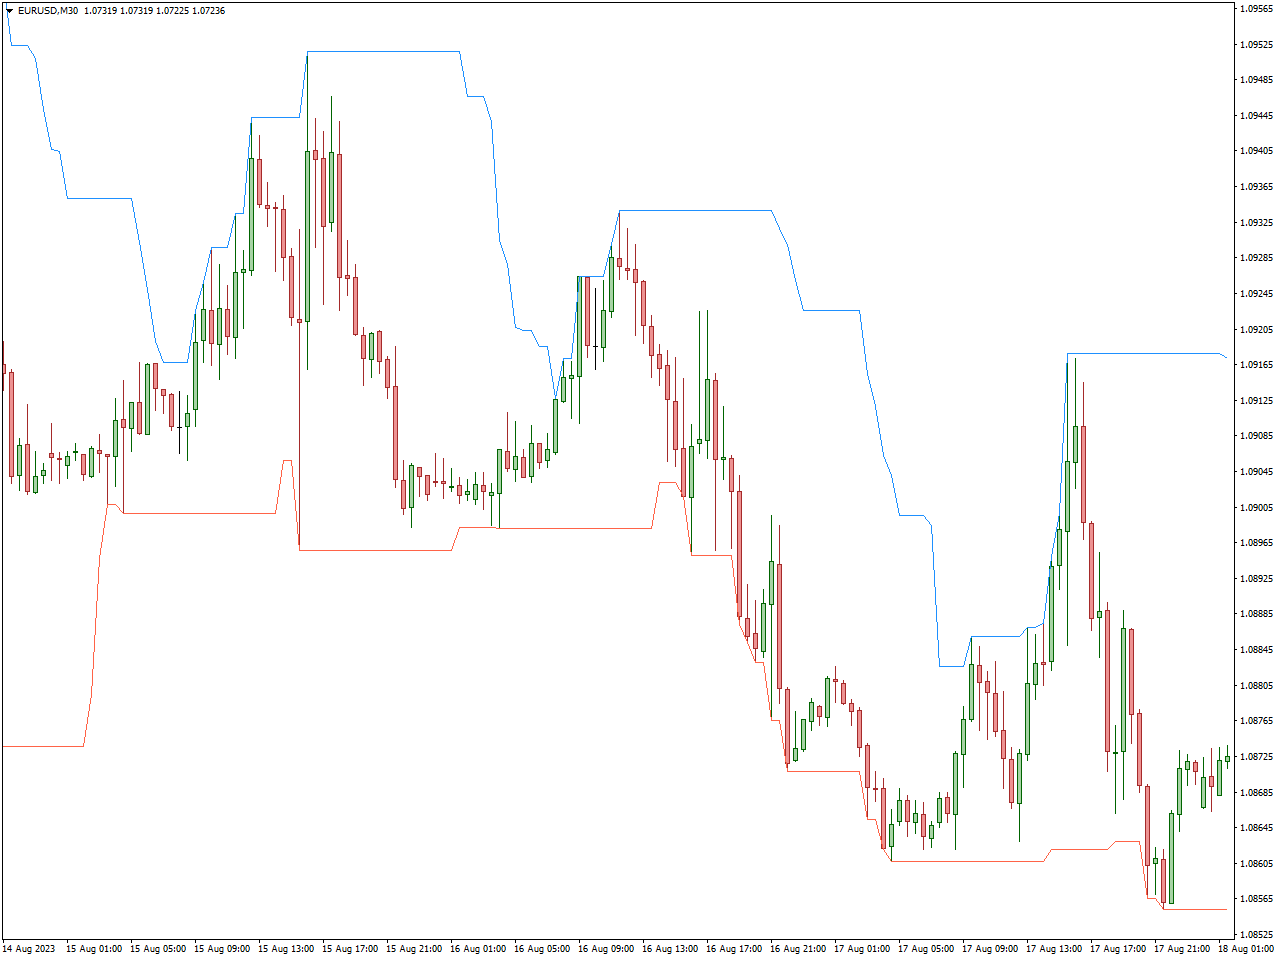
The Donchian Channel Indicator, also recognized as the “Price Channels” indicator, was created by Richard Donchian, a prominent figure in technical analysis. This technical analysis tool is employed in various financial markets, such as Forex, to discern trends, pinpoint potential breakout levels, and assess market volatility.
The width of the Donchian Channel (the distance between the upper and lower bands) is a measure of market volatility. Wider channels indicate higher volatility, while narrower channels suggest lower volatility.Traders use the Donchian Channel to identify the prevailing trend. In an uptrend, the price typically stays above the middle band, and the upper band may act as a resistance level. In a downtrend, the price is often below the middle band, and the lower band may serve as support. The Donchian Channel is particularly useful for identifying breakout points. Traders watch for instances where the price breaks above the upper band (bullish breakout) or below the lower band (bearish breakout). These breakouts can signal potential trading opportunities.
Traders can use the Donchian Channel in various ways, including trend-following and breakout trading strategies. For example, a trader may enter a long position when the price breaks above the upper band in an uptrend or a short position when the price breaks below the lower band in a downtrend.
Forex Reversal Indicator
A Forex Reversal Indicator is a technical analysis tool used in the foreign exchange (Forex) market to identify potential reversal points in price trends. Traders use reversal indicators to spot instances where a prevailing trend may be nearing its end and a new trend might emerge in the opposite direction.
The indicator scans historical price data on a chart and searches for specific price patterns or conditions that suggest a potential trend reversal. Common reversal patterns include head and shoulders, double tops and bottoms, and various candlestick patterns.
When the indicator identifies a potential reversal pattern or condition, it generates a signal. These signals may indicate a potential change in trend direction, such as from an uptrend to a downtrend (bearish reversal) or from a downtrend to an uptrend (bullish reversal).To increase the reliability of reversal signals, traders often use additional technical analysis tools or indicators to confirm the signal. This can include trendlines, support and resistance levels, and momentum indicators.
Fractal Support and Resistance Indicator
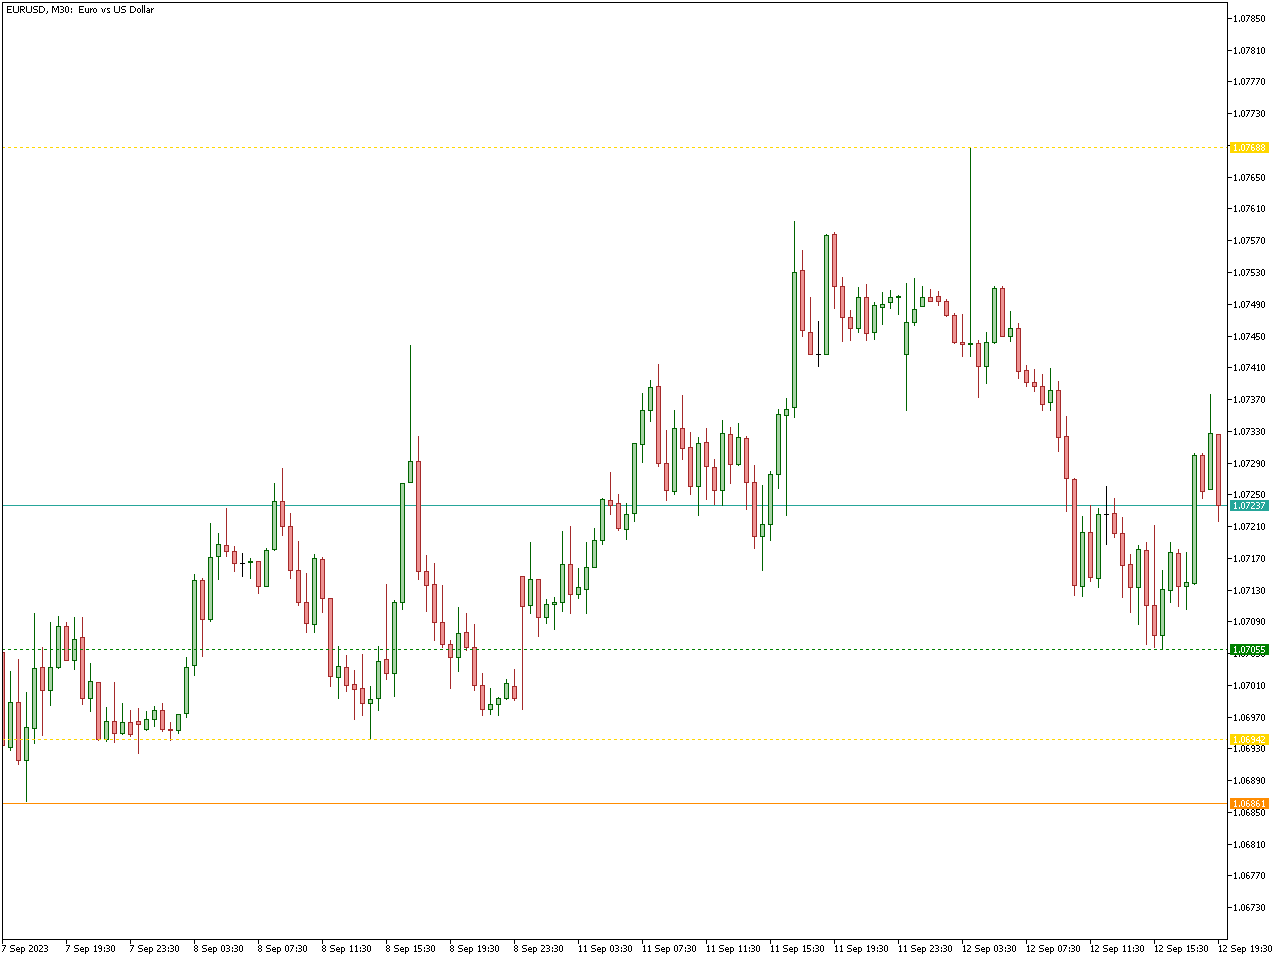
The Fractal Support and Resistance Indicator is a technical analysis tool used by traders to identify key support and resistance levels on price charts. Fractals are a specific type of pattern that can highlight potential reversal or continuation points in the market. This indicator helps traders pinpoint these important price levels for making trading decisions.
The indicator identifies fractal patterns on the price chart. A fractal is a set of five consecutive candlesticks, with the highest high and the lowest low in the middle. These patterns can represent potential turning points in the market.he indicator marks the highest high and lowest low within each fractal pattern on the chart. These levels are considered support and resistance points.
Traders use these identified support and resistance levels to make trading decisions. For example, when the price approaches a support level marked by a fractal, it may indicate a potential buying opportunity. Conversely, when the price approaches a resistance level marked by a fractal, it may suggest a potential selling opportunity.
FX Sniper Indicator
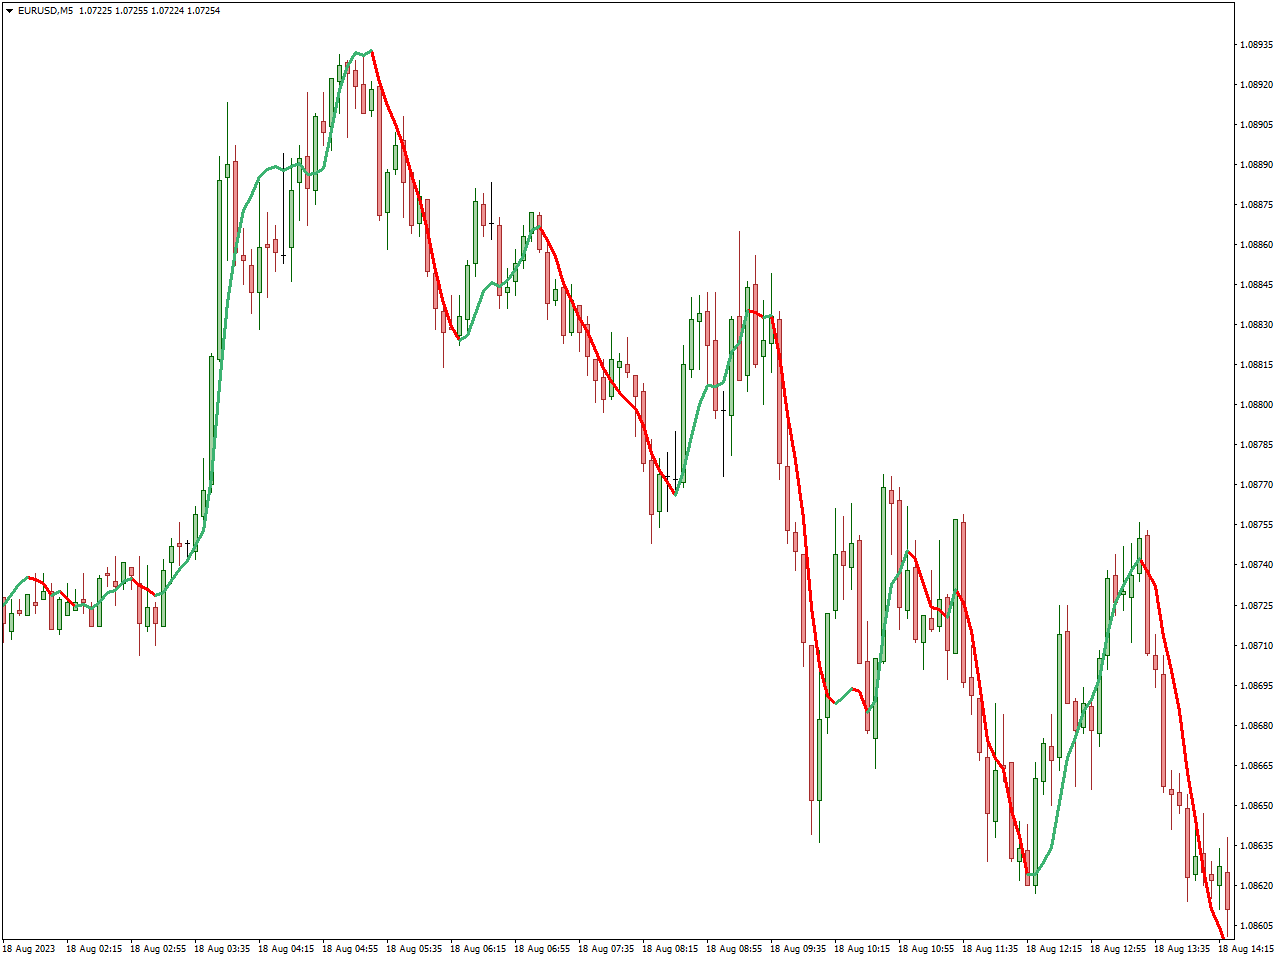
The FX Sniper Indicator is employed in the foreign exchange market as a technical analysis instrument for pinpointing potential trading opportunities, both for buying and selling. Its foundation lies in a blend of moving averages and various mathematical computations, resulting in the generation of signals that suggest optimal times to initiate or conclude trades.
This indicator is adaptable, suitable for deployment across different currency pairs and timeframes, and it is thoughtfully designed to accommodate traders of all proficiency levels. You can utilize the FX Sniper Indicator either as a standalone resource or in tandem with other technical indicators to fortify your trading strategy.
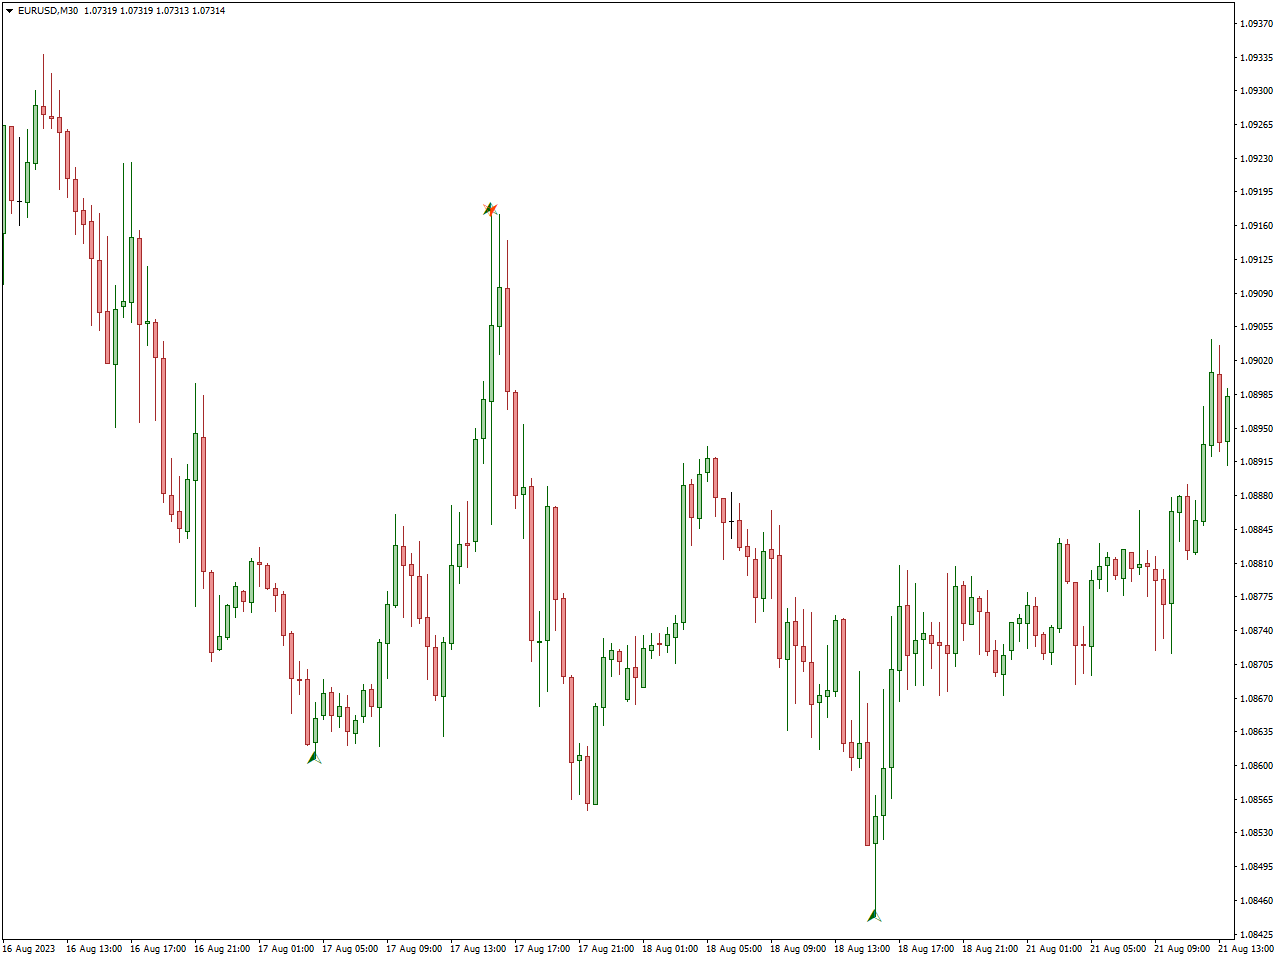
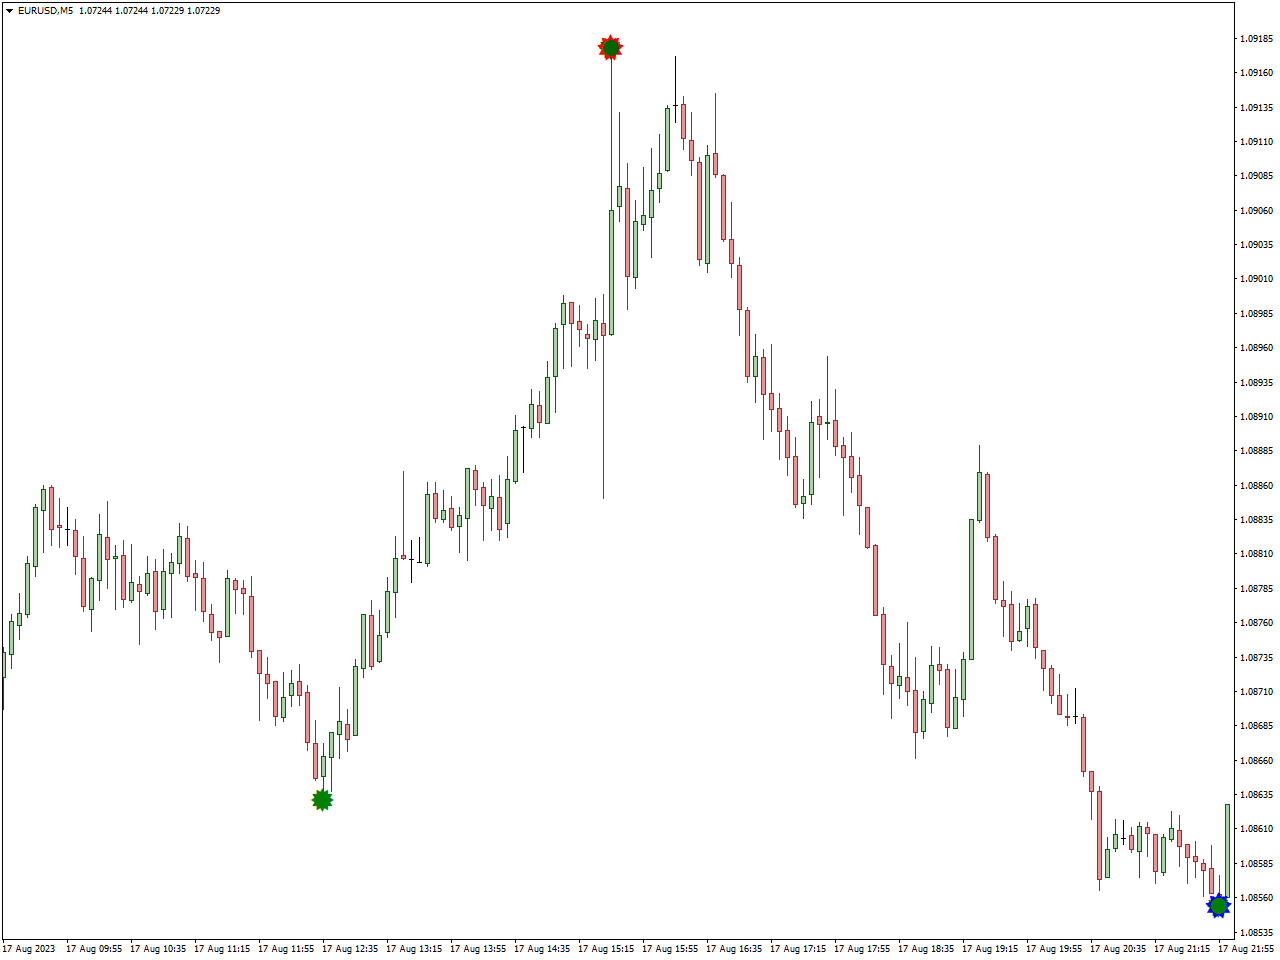
A-Gimat Reversal Indicator
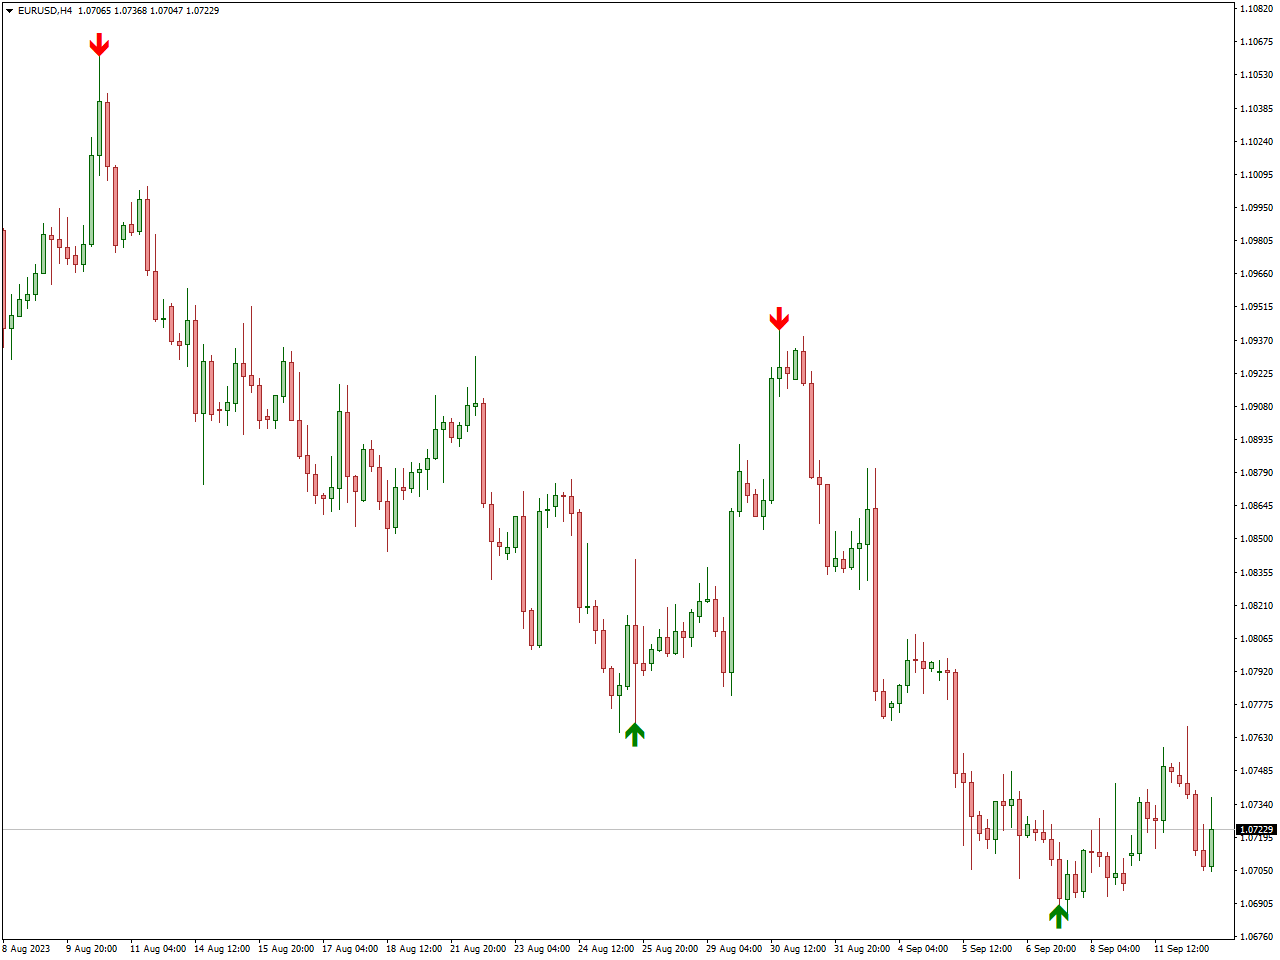
The A-Gimat Reversal MT4 Indicator is a robust tool specifically designed for the MetaTrader 4 (MT4) trading platform. Its primary function is to detect and signal potential trend reversals based on zigzag patterns within price charts.
The indicator continuously analyzes price bars to pinpoint swing highs and lows, which are essential elements of zigzag patterns. When it identifies a significant reversal point, it places an arrow on the corresponding candle or bar to alert traders.
Like many technical indicators, the A-Gimat Reversal Indicator may exhibit some time lag in identifying reversal points. This means that the signals generated by the indicator might not always align perfectly with the actual market reversals. Traders should be aware of this lag and consider it when making trading decisions.
Pullback Factor Indicator
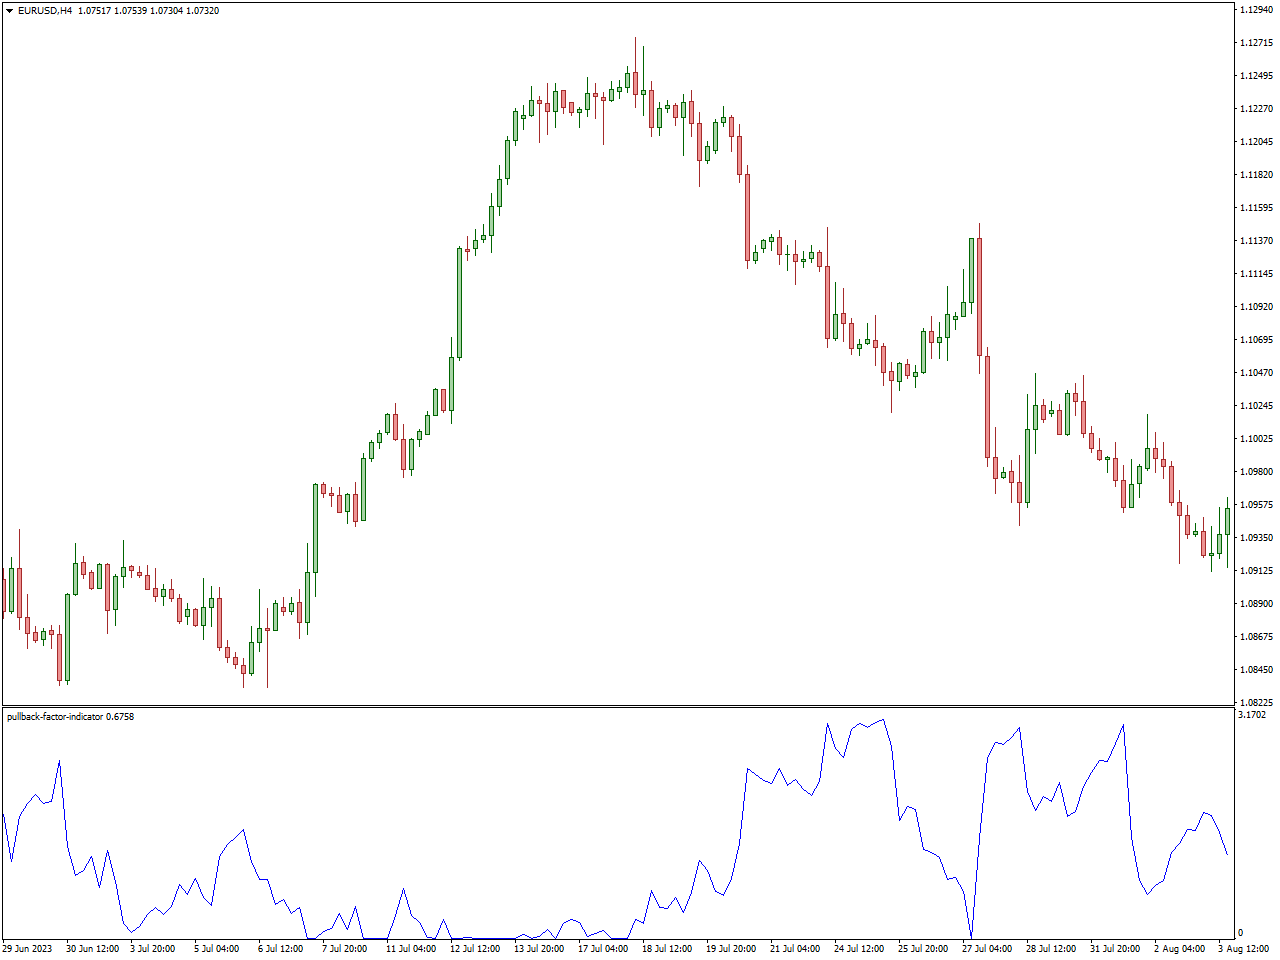
The Pullback Factor Indicator is a well-received and relatively new trend-following tool tailored for application in the forex market. Its primary function is to assist traders in recognizing the conclusion of a trend retracement and the subsequent continuation of the prevailing trend. Distinguished by its innovative algorithm, this indicator provides insights into the expected magnitude of a trend pullback, empowering traders with the ability to enter the market with enhanced precision and accuracy.
Indeed, it’s essential for traders to have a solid understanding of price action and market structure before using any trading indicator effectively. While the Pullback Factor Indicator can be a valuable tool for experienced traders, it may not be suitable for forex beginners who are still learning the basics of trading.
Additionally, the suggestion of combining the Pullback Factor Indicator with Fibonacci tools is a valid one. Fibonacci retracement levels are often used by traders to identify potential support and resistance levels during price retracements, which can complement the information provided by the Pullback Factor Indicator.
3 Bars High Low Indicator
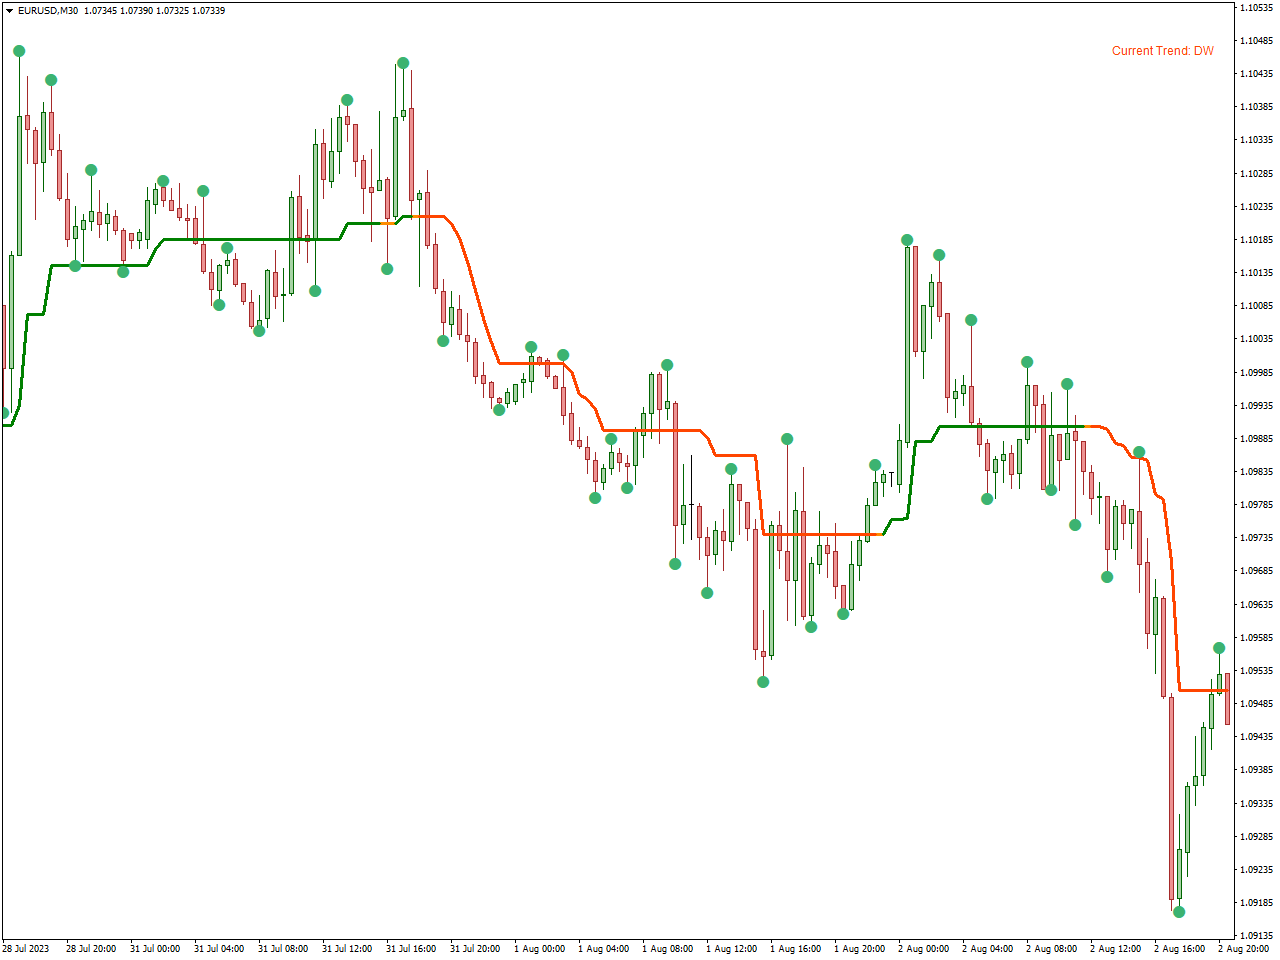
The indicator categorizes price trends into three types: BULLISH (uptrend), BEARISH (downtrend), and FLAT (sideways or range-bound). This classification helps traders quickly assess the prevailing market conditions.
In addition to trend identification, the indicator employs fractals to offer further validation for BUY and SELL trade signals. Fractals are a common tool used in technical analysis to identify potential reversal points on price charts.
Stable and non-repainting signals make this indicator suitable for forex auto trading strategies. Traders can potentially automate their trading decisions based on the BUY and SELL alerts generated by the indicator.
Overall, the “3 Bars High Low Indicator” appears to be a comprehensive tool for traders using MetaTrader 4. It combines trend identification, fractals, and reliable BUY and SELL alerts to assist traders in making informed trading decisions, whether manually or through automated strategies.
Conclusion
Swing trading can be profitable for traders who have a good understanding of technical analysis, risk management, and the ability to adapt to changing market conditions. However, it’s important to note that it involves inherent risks, and not all swing trades will be successful. As with any trading strategy, it’s essential to have a well-defined trading plan and to practice proper risk management to minimize potential losses.