
The RSI Heatmap Indicator is a powerful technical analysis tool designed for forex traders who use the MetaTrader 4 (MT4) trading platform. This indicator is free and popular among traders due to its ability to identify potential trade opportunities by highlighting overbought and oversold conditions in the market. The RSI Heatmap Indicator works by measuring the strength of the Relative Strength Index (RSI) across multiple timeframes, from 1-minute to daily. The indicator displays the RSI readings for each timeframe in a heatmap format, allowing traders to quickly identify when the market is becoming overbought or oversold. This can help traders to anticipate potential price reversals and adjust their trading strategies accordingly. The RSI Heatmap Indicator is easy to use, with a clear visual display that shows the RSI readings for each timeframe. Traders can customize the indicator by selecting the timeframes they want to monitor and adjusting the heatmap colors to suit their preferences. Overall, the RSI Heatmap Indicator is a valuable tool for any trader who wants to gain a deeper understanding of market trends.
MT4


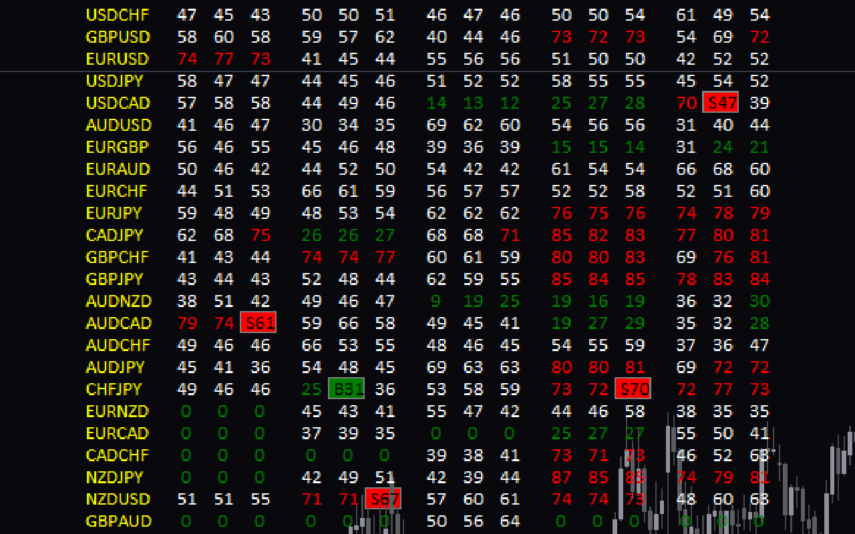
RSI Heatmap
The RSI Heatmap indicator is a new and popular forex indicator available for free on MT4. It uses the Relative Strength Index (RSI) to display a heat map that shows the overbought and oversold areas of multiple currency pairs at the same time. The heat map is color coded, making it easy to see which pairs are strong or weak in real time. It helps you take the guesswork out of identifying the most profitable currency pairs to trade by providing real-time information that you can influence.
| Indicator Type | |
|---|---|
| Timeframe | |
| Platform |
0
People watching this product now!
Downloads - 66
Description
Reviews (0)
How to Install
Related products

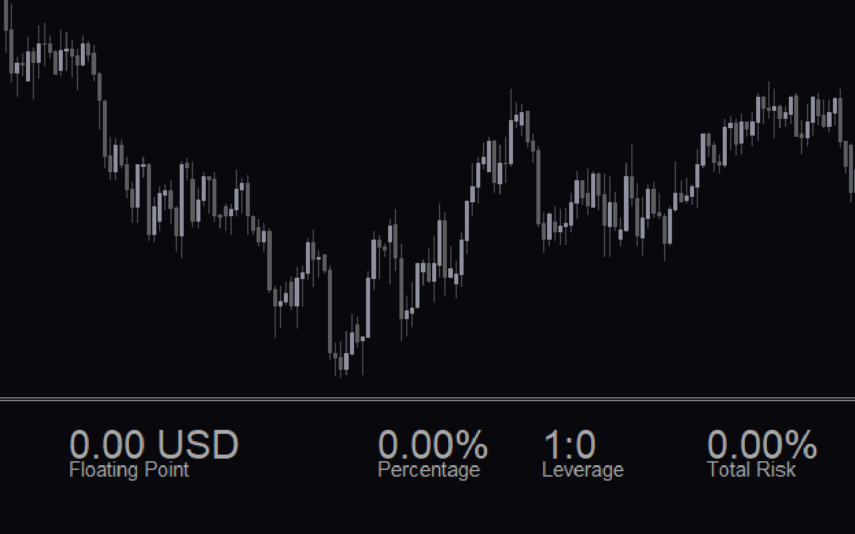
Risk Management
The Risk Management Indicator is a popular and free MT4 Forex indicator that is useful for traders looking to manage their risk. This indicator helps traders to identify and set stop loss and take profit levels for their trades. The indicator works by monitoring the market and alerting traders when the stop loss or take profit levels are reached. The Risk Management Indicator is a popular and free MT4 Forex indicator that is easy to use and can help traders to manage their risk and protect their capital.
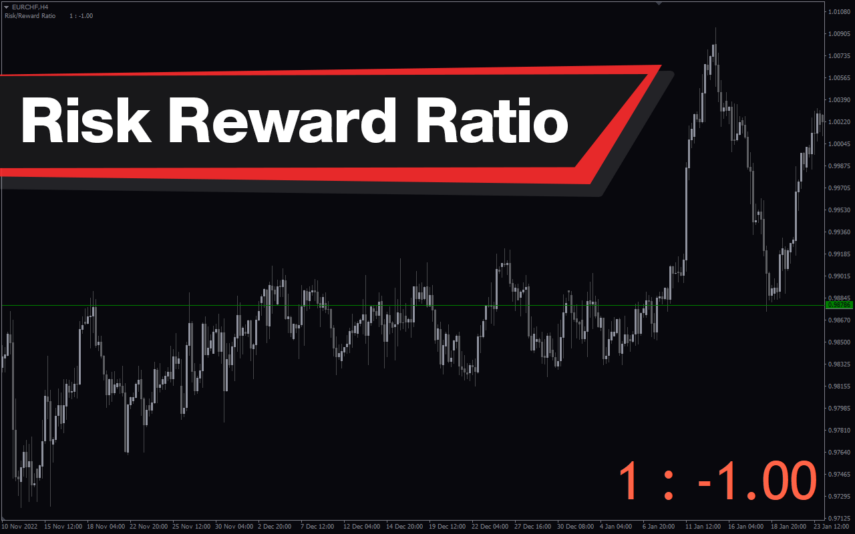
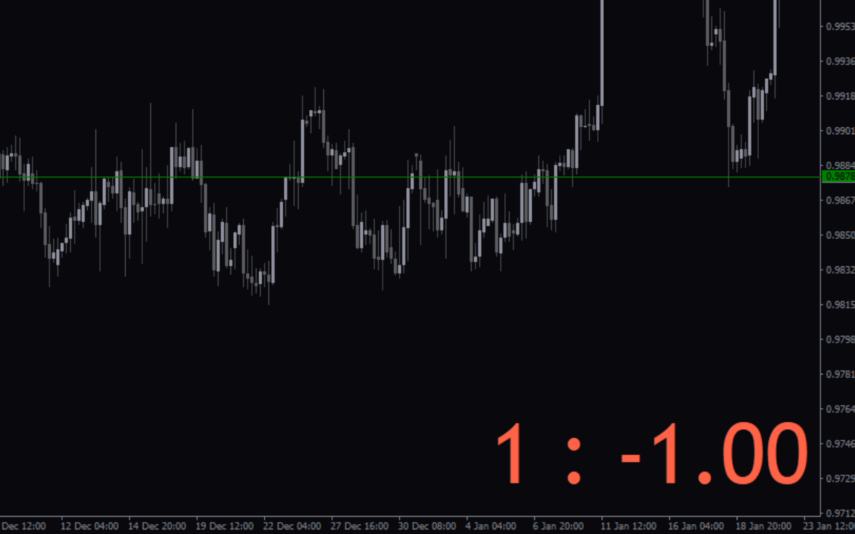
Risk Reward Ratio
The Risk Reward Ratio indicator is a new and popular MT4 indicator used in forex trading. It works by analyzing the potential risk and reward of a trade and presenting the information in an easy-to-read format. The indicator displays the risk-reward ratio as a percentage, allowing traders to quickly assess the potential gains and losses of a trade before entering into it. With this valuable information, traders improve their trading strategies and minimize their risk in the forex market.
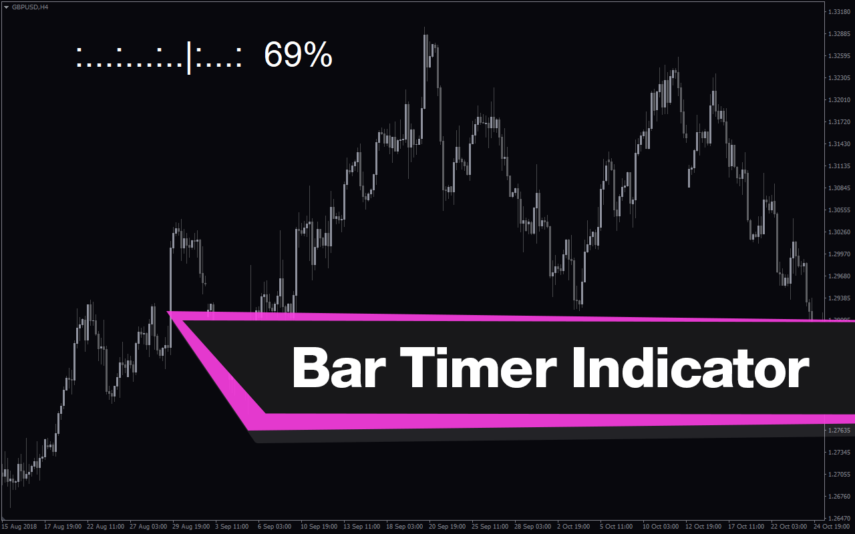
Bar Timer
The Bar Timer Indicator is a free and popular Forex indicator for MetaTrader 4 (MT4) that can be used to monitor the opening and closing times of the different Forex markets around the world. The indicator displays the opening and closing times of all the major Forex markets in the world, including the London, New York, Tokyo and Sydney markets. It also shows the current time and the time left before the next market opens or closes. The indicator is easy to use and can be set up to display the time in the user's local time zone.
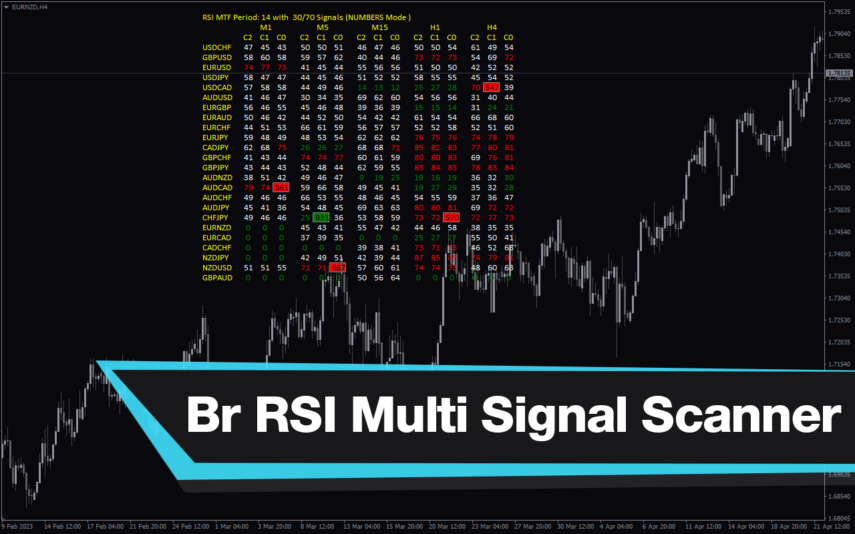
Br RSI Multi Signal Scanner
The BR RSI Multi Signal Scanner Indicator is a useful and popular free Forex indicator for MT4. This indicator is designed to help traders identify profitable trading opportunities in the Forex market by scanning multiple time frames and displaying the Relative Strength Index (RSI) in a single chart. The indicator also provides entry and exit signals based on the RSI readings.
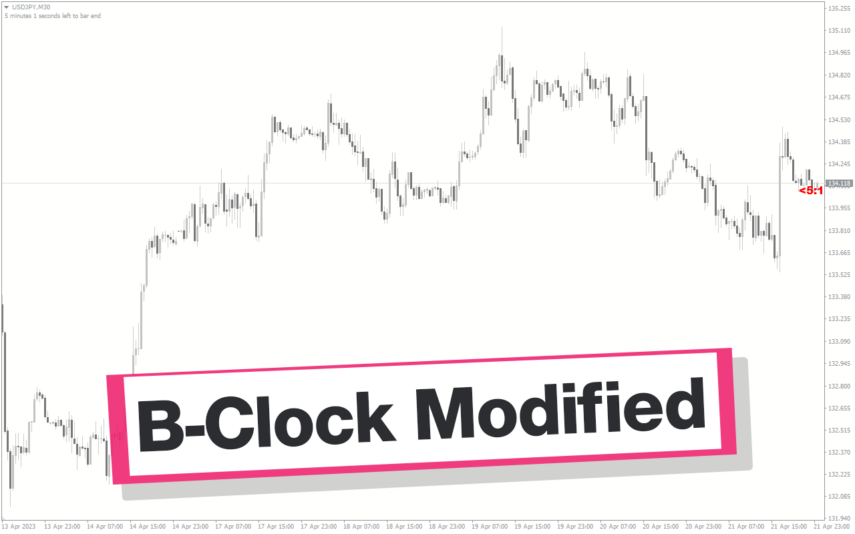
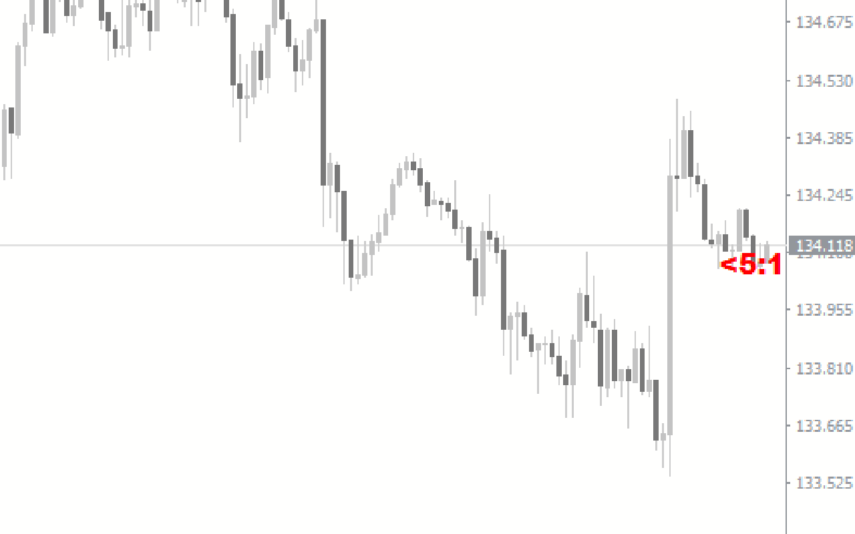
B-Clock Modified
The modified b-clock indicator is a popular and useful MT4 tool for forex traders to help them determine the start and end of trading sessions. This indicator works by displaying the time remaining until the close of the current candle, which can be useful for traders who want to time their trades based on market activity during certain trading sessions. Due to its popularity in the forex trading community, this indicator has become an essential tool for many traders looking to gain an edge in the market.
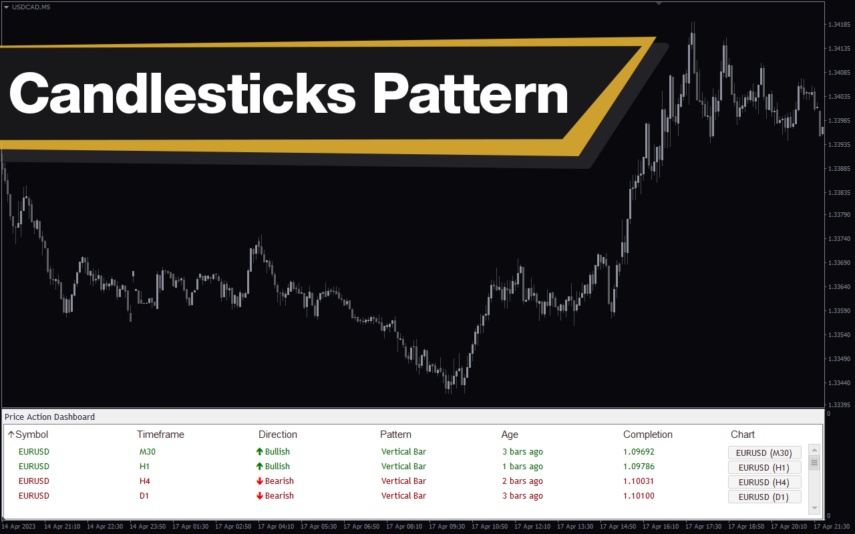
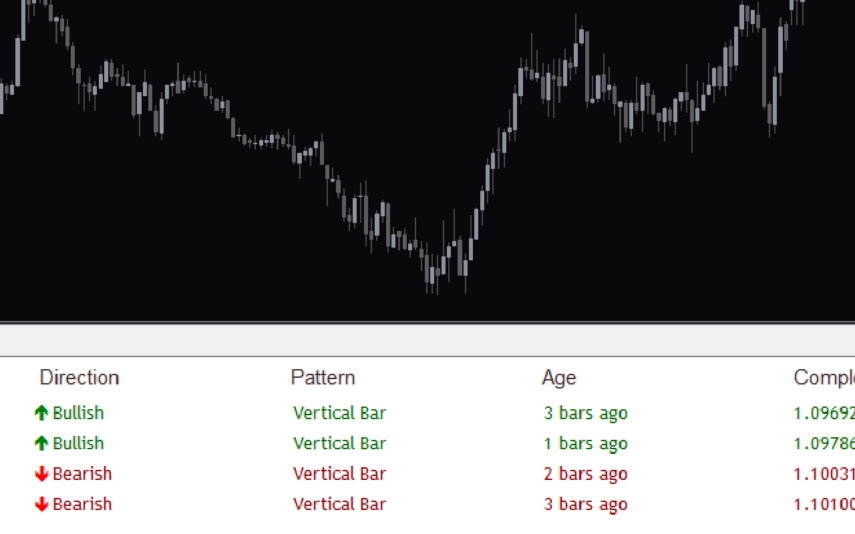
Candlesticks Pattern
The Candlesticks Pattern Indicator is a useful MT4 tool for Forex traders. The indicator works by scanning the market for different candlestick patterns, such as the Doji, Hammer and Shooting Star, and then displaying the patterns on the chart. With the Candlesticks Pattern Indicator, traders can quickly and easily identify potential trading opportunities, making it a valuable tool for anyone looking to make successful trades in the Forex market.
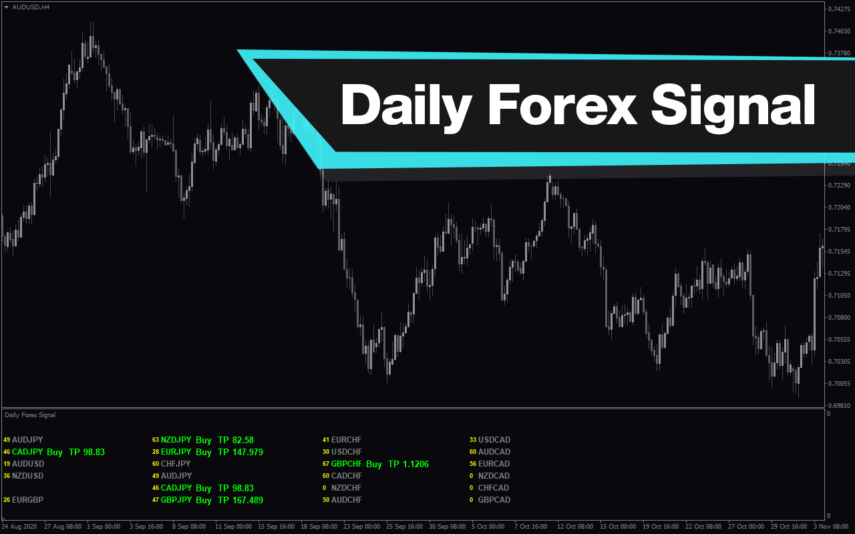
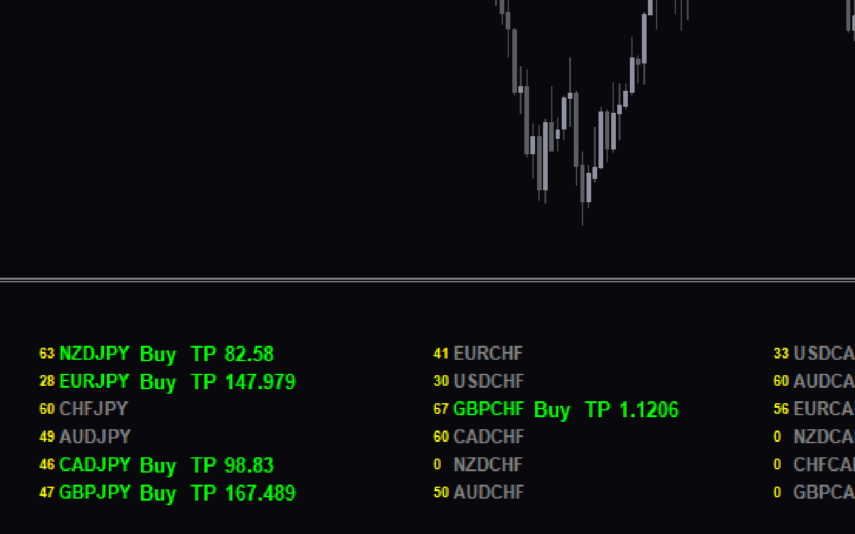
Daily Forex Signal
The Daily Forex Signal Indicator is a useful and popular free MT4 forex indicator which provides traders with simple buy and sell signals. It is based on the popular Moving Average Convergence Divergence (MACD) indicator, and uses a combination of moving averages and oscillators to generate reliable signals. It is especially useful for short-term trading strategies, as it can help traders identify entry and exit points quickly and accurately. With its reliable signals and customizable features, the Daily Forex Signal Indicator is a great tool for any trader looking to maximize their profits in the forex market.
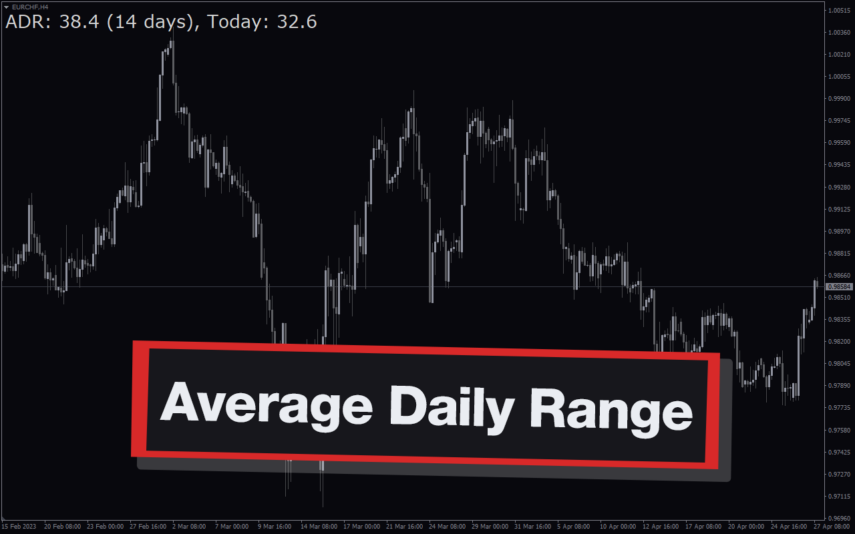
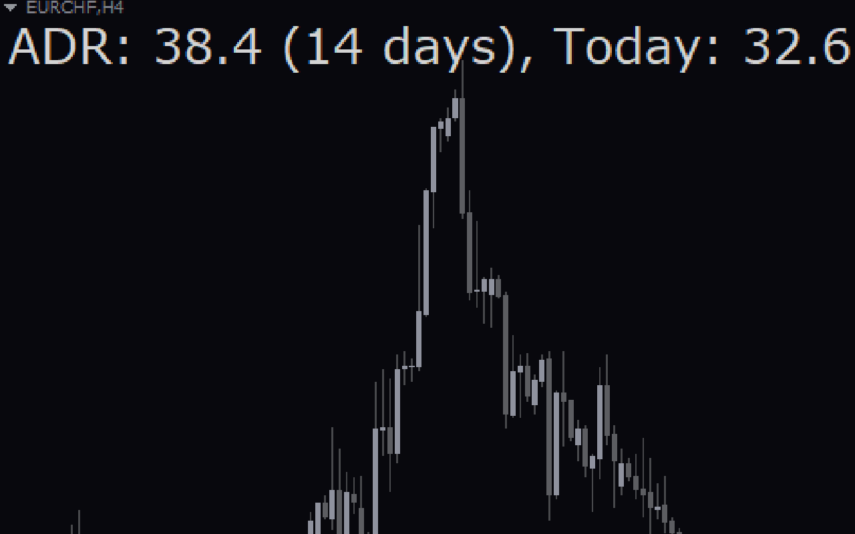
Average Daily Range Adr
The Average Daily Range (ADR) Indicator is a popular and free Forex indicator for the MT4 trading platform. It is a useful tool for traders as it helps them identify and take advantage of the range of price movements. The indicator shows the average daily range of a currency pair over a given period of time. This can be used to help traders identify entry and exit points for their trades. The indicator is easy to use and can be used to identify the volatility of a currency pair, as well as the potential for price movements. The ADR Indicator is a great way to take advantage of the market’s volatility and make more informed trading decisions.
Reviews
There are no reviews yet.