
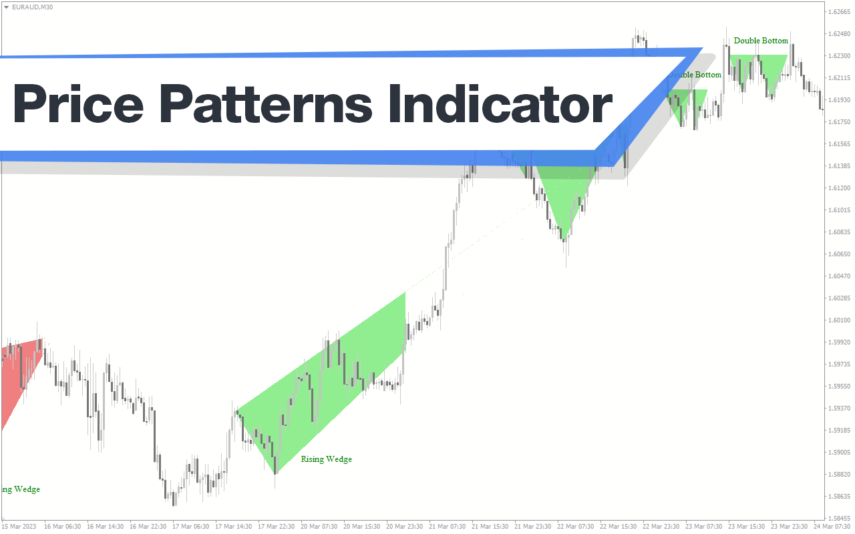
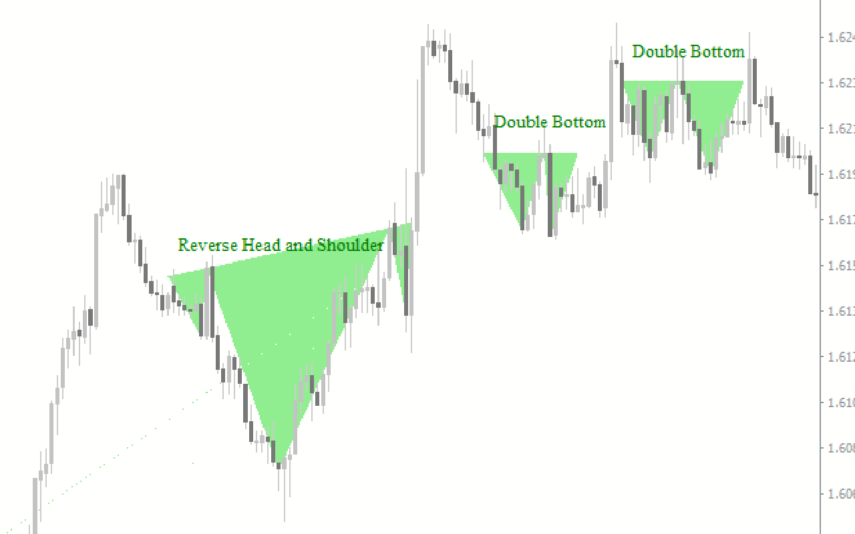
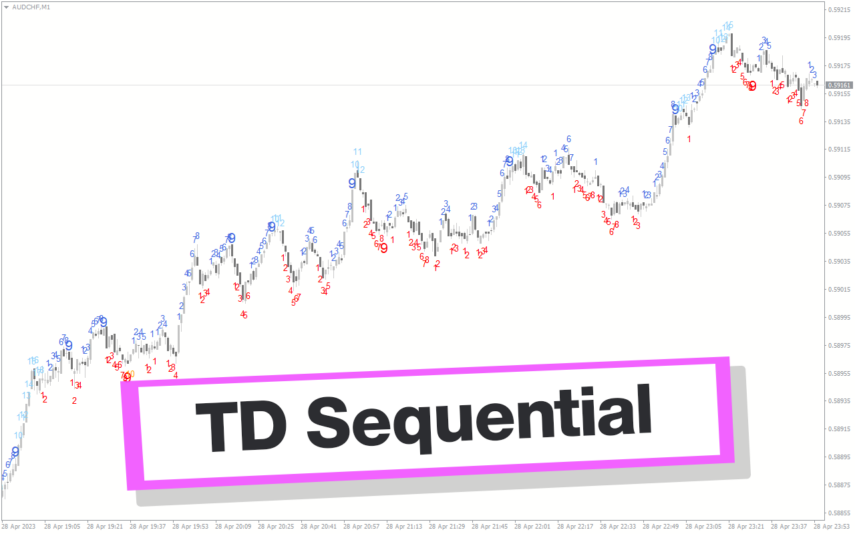
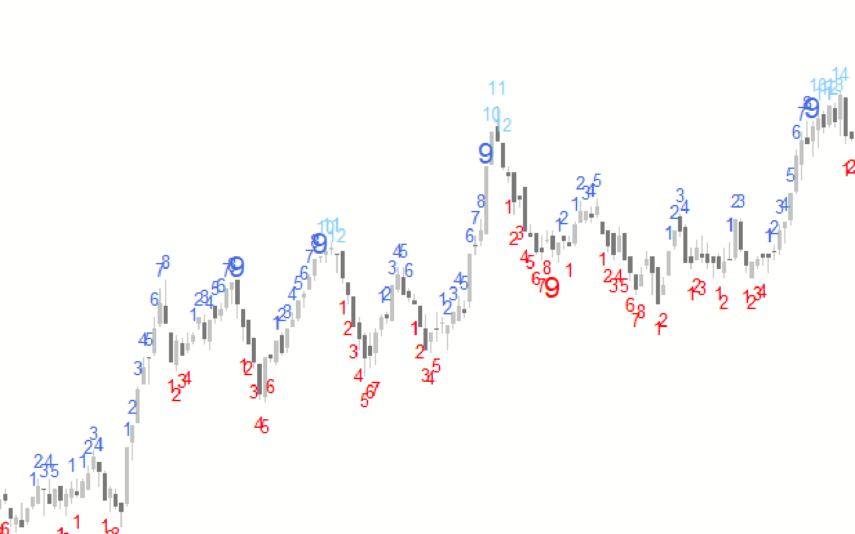
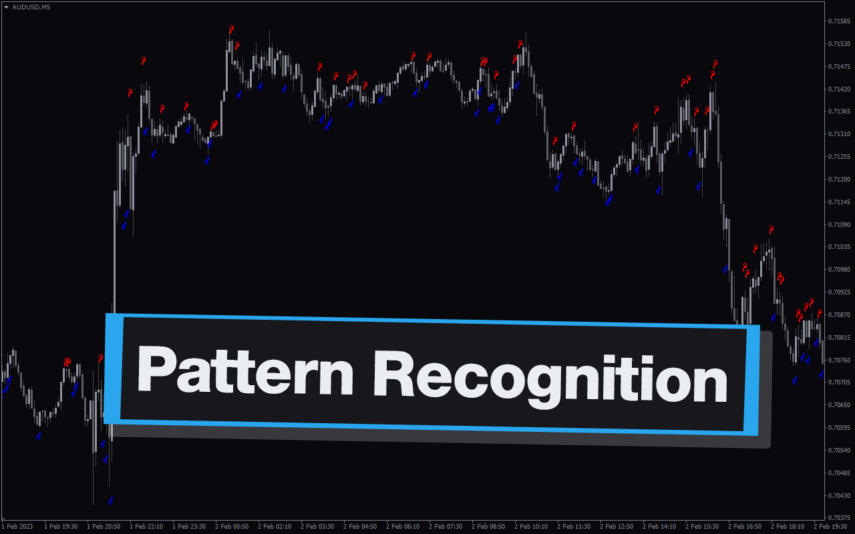
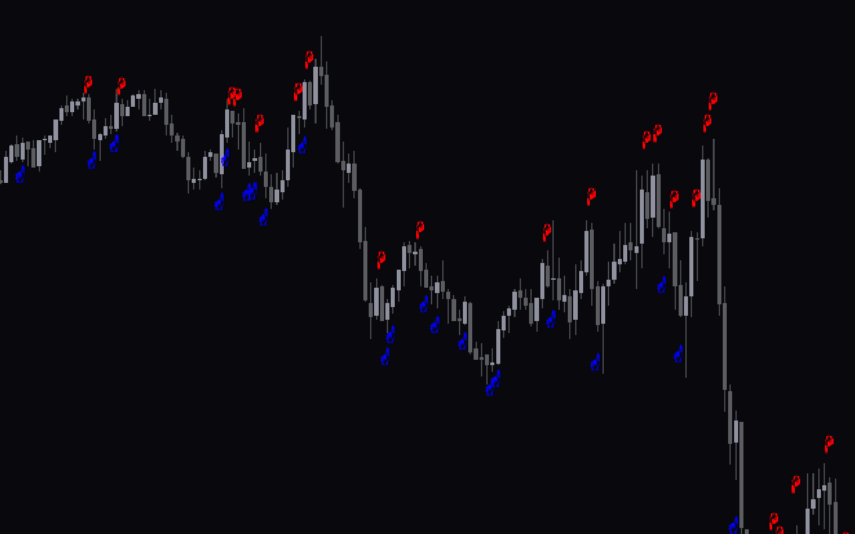
The Fractals Price Indicator is a useful tool for forex traders using the MT4 platform. This popular indicator helps traders identify potential reversal points in the market. The indicator works by plotting swing highs and swing lows on the chart, which can help traders spot key levels of support and resistance. To use the Fractals Price Indicator, simply add it to your chart and look for areas where fractals form above or below the price action. When a fractal forms above the price, it indicates a potential resistance level, while a fractal below the price indicates a potential support level. This indicator is free to use and can be a helpful addition to your trading strategy. Keep in mind that no indicator is perfect, so it’s important to use the Fractals Price Indicator in conjunction with other technical analysis tools to make informed trading decisions.
MT4


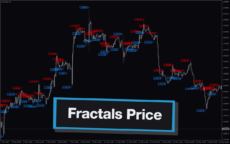
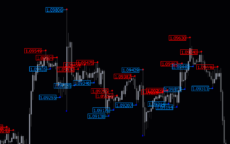
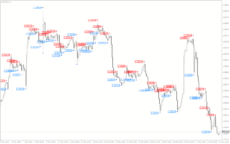
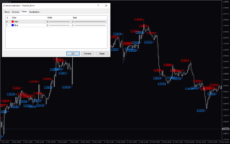
Fractals Price
Fractals Price Indicator is a useful forex indicator for MT4 that identifies potential reversal points in the market. It is popular among traders for its accuracy and ease of use. This free indicator works by plotting arrows on the chart to highlight high and low fractal points, indicating possible trend changes. Traders can use this information to make informed trading decisions.
| Indicator Type | |
|---|---|
| Trading Style | , |
| Platform | |
| Timeframe |
0
People watching this product now!
Downloads - 10
Description
Reviews (0)
How to Install
Related products
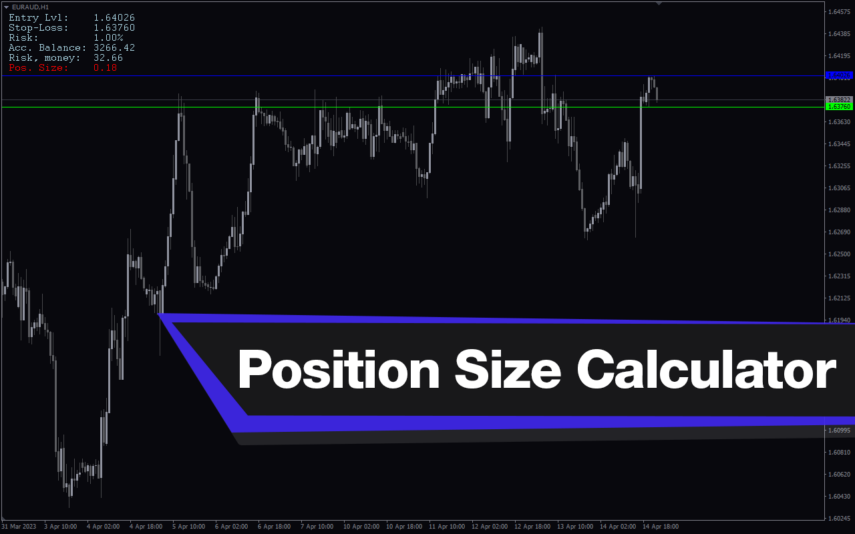
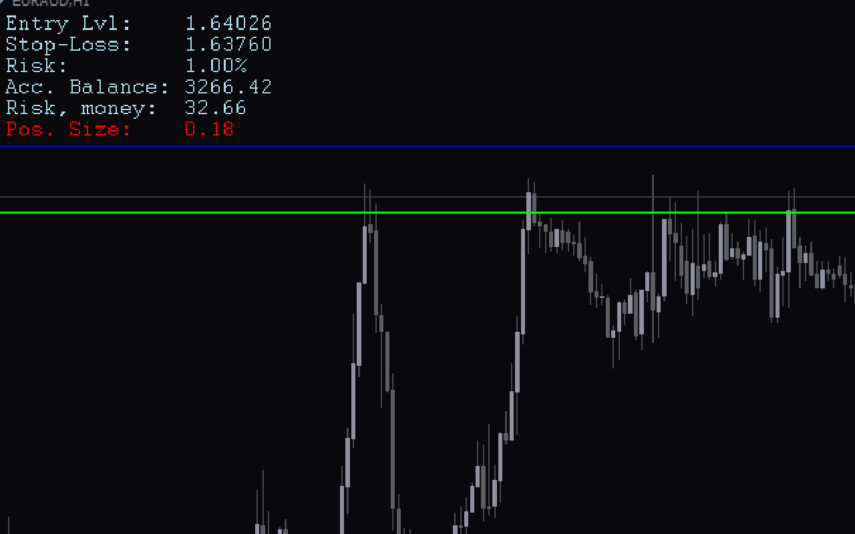
Position Size Calculator
The Position Size Calculator indicator is a new and popular tool for forex traders that can be downloaded for free on the MT4 platform. This helps traders determine the correct position size for their trades based on the account balance, risk tolerance and the currency pair they are trading. The indicator takes into account the stop loss level, pip value and currency pair volatility to ensure that traders do not risk more than they can afford to lose. It is an essential tool for both beginners and experienced traders who want to effectively manage their risks and maximize their potential profits.
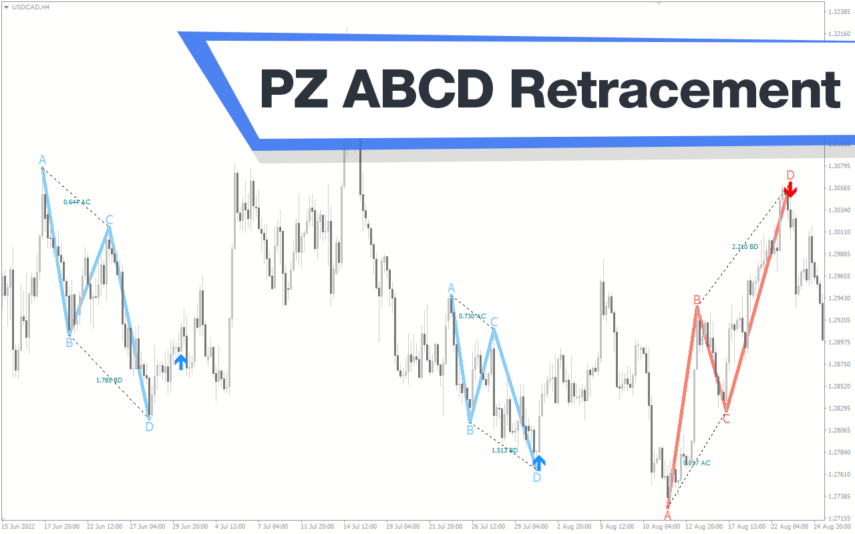
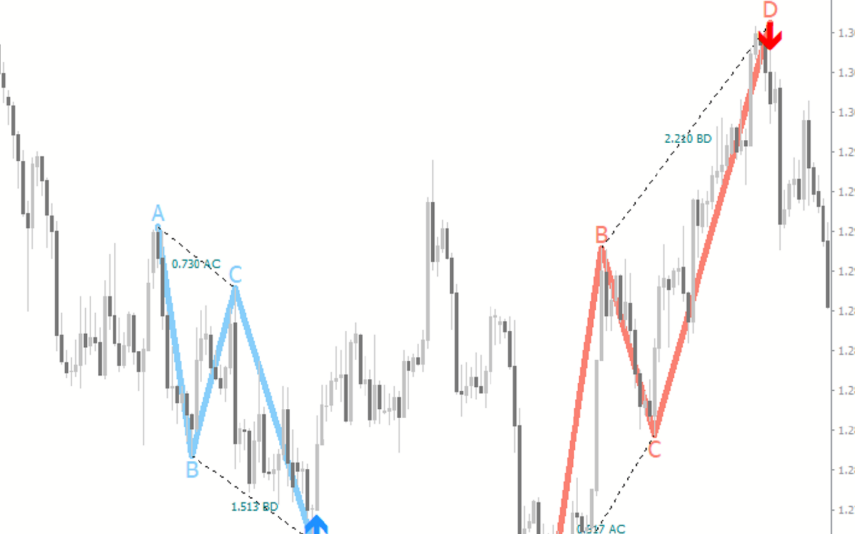
PZ ABCD Retracement
The PZ ABCD Retracement Indicator is a popular and free forex indicator for MT4 that helps traders identify potential trading opportunities by identifying the AB=CD harmonic pattern. The indicator automatically plots Fibonacci retracement levels to help traders identify entry and exit points. It works by scanning the market for the AB=CD pattern and drawing the necessary lines and levels. It can be used by both a novice and an experienced trader, making it a versatile tool for traders who want to improve their trading results.
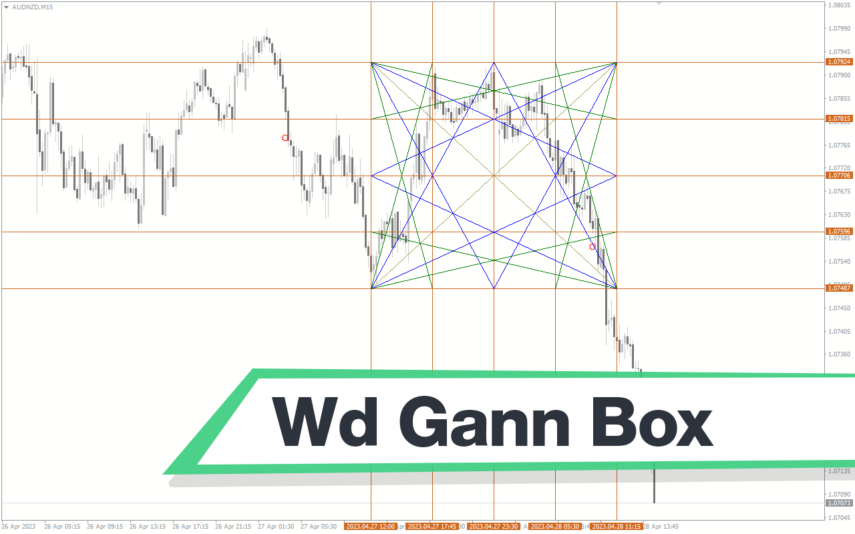
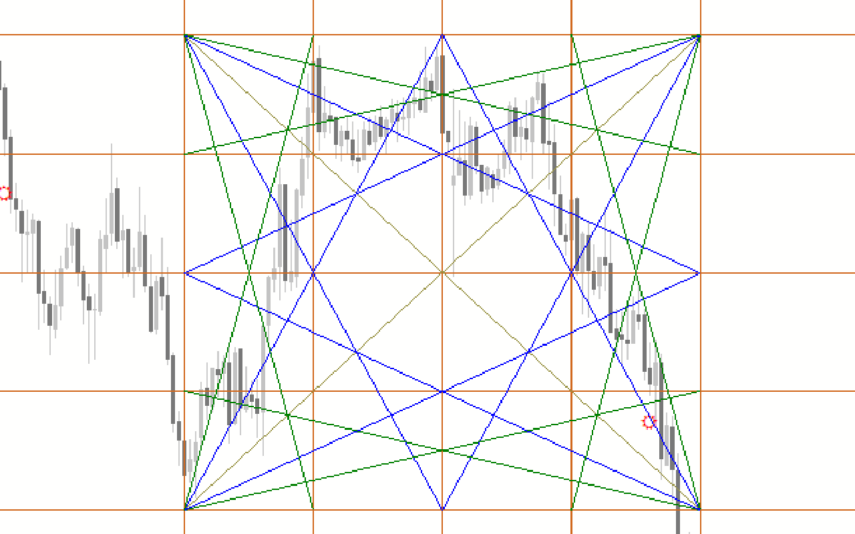
Wd Gann Box
The WD Gann Box Indicator is a useful and popular free Forex indicator for MT4. This indicator can be used to identify trends, support and resistance levels, and reversals. It displays a box of the current price action on the chart and provides a visual representation of the trend. The WD Gann Box Indicator is a popular and free Forex indicator for MT4 that can be used to identify trends, support and resistance levels, and reversals.
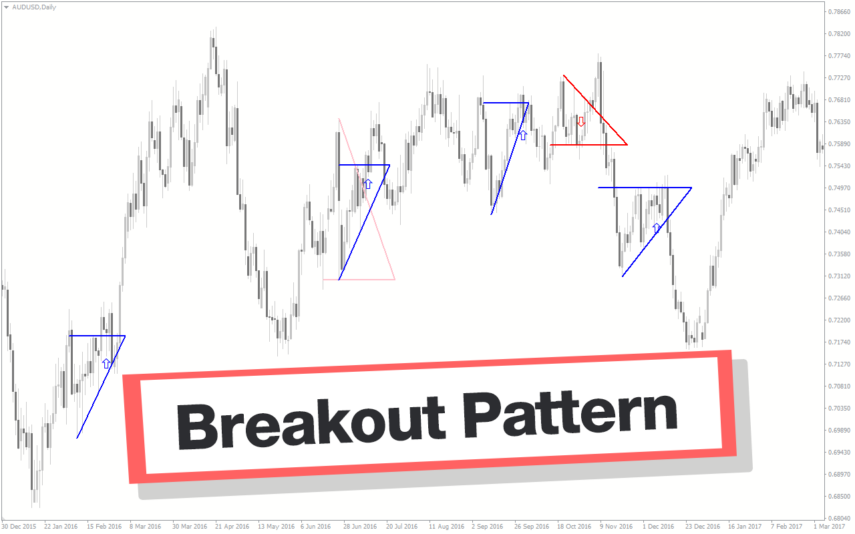
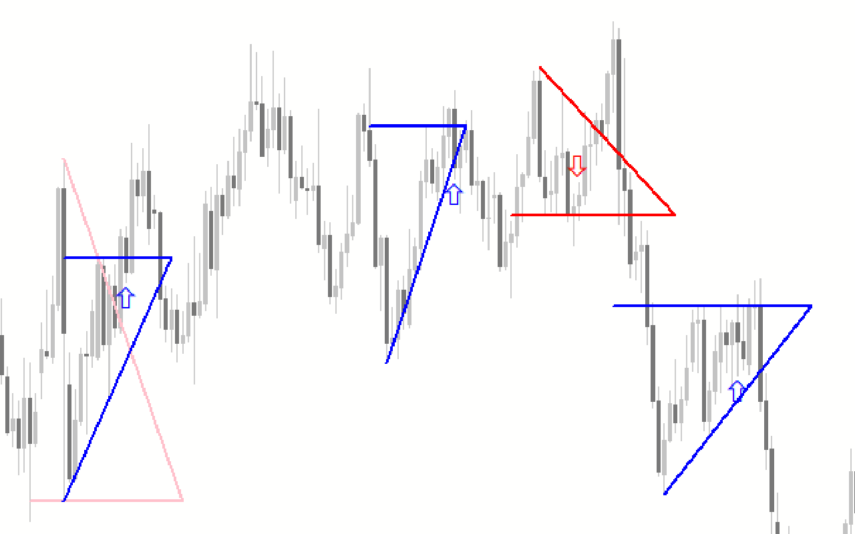
Breakout Pattern
The Breakout Pattern Indicator is a popular and free Forex indicator for MetaTrader 4 (MT4) trading platforms. It is a useful tool for traders who are looking to identify breakouts and potential trading opportunities. The indicator uses a combination of technical analysis, including support and resistance levels, trendlines, and price action to identify potential breakouts. The Breakout Pattern Indicator is a great tool for traders who are looking to take advantage of market breakouts and capitalize on potential trading opportunities.
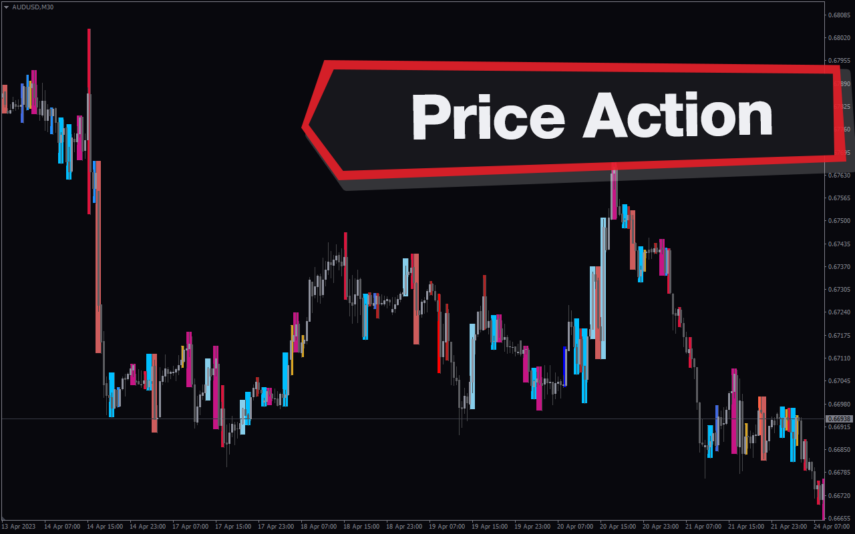
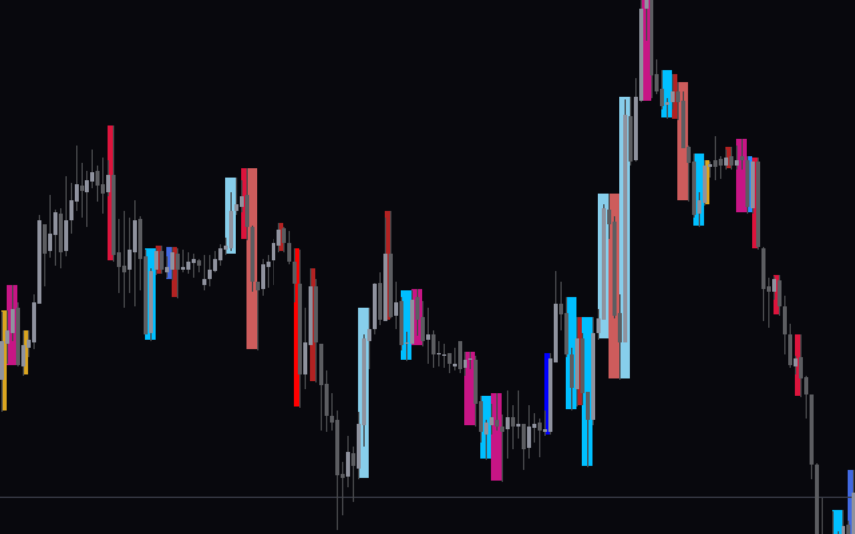
Price Action Scaner
The Price Action Scaner Forex Indicator is a useful and popular MT4 indicator that is free to use. It is designed to help traders identify price action patterns that are most likely to lead to profitable trades. The indicator uses a combination of trend analysis, support and resistance levels, and price action signals to provide traders with an insight into the current market conditions. It also provides alerts when certain trading signals are detected, allowing traders to take action quickly. With the Price Action Scaner Forex Indicator, traders can quickly identify potential trading opportunities and take advantage of them.
Reviews
There are no reviews yet.