
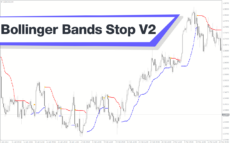
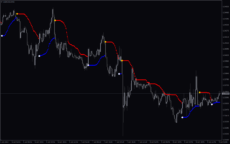
The Bollinger Bands Stop v2 Indicator is a useful and popular free forex indicator for MT4. It is designed to help traders identify potential entry and exit points in the market, as well as to spot trends, reversals, and breakouts. This indicator uses Bollinger Bands and the Relative Strength Index (RSI) to measure market volatility and momentum. The Bollinger Bands Stop v2 Indicator works by plotting two lines on the chart. The upper line is the Bollinger Band, which is a measure of market volatility. The lower line is the RSI, which is a measure of market momentum. The indicator will show a buy signal when the price is above the upper line and the RSI is below the lower line. Conversely, it will show a sell signal when the price is below the lower line and the RSI is above the upper line. Overall, the Bollinger Bands Stop v2 Indicator is a useful and popular free forex indicator for MT4. It is easy to use and understand and can help traders identify potential entry and exit points in the market. It is also useful for spotting trends, reversals, and breakouts.
MT4


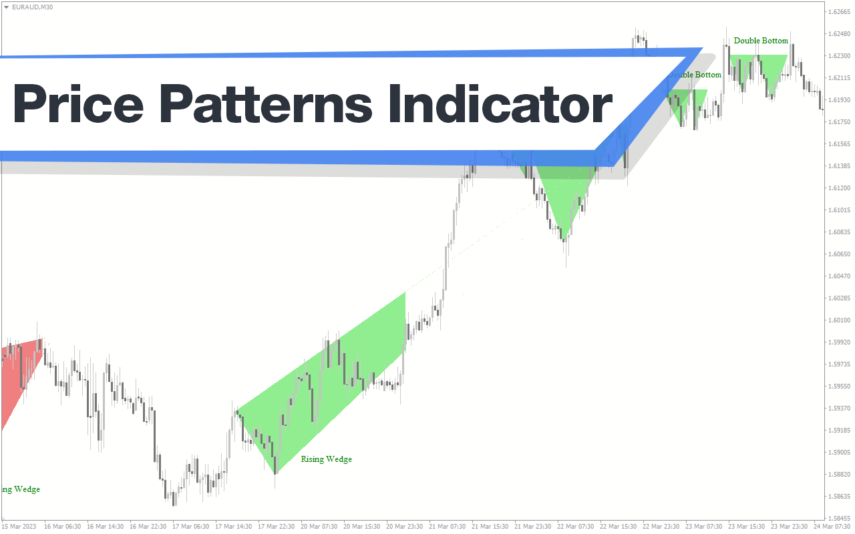
Bollinger Bands Stop V2
The Bollinger Bands Stop V2 Indicator is a popular and useful Forex indicator that is available for free on the MT4 trading platform. The indicator is composed of three lines that represent the upper, middle and lower Bollinger Bands. The middle line is the average of the high and low prices of the currency pair, while the upper and lower lines represent the standard deviation of the prices. This makes it an invaluable tool for traders who are looking to take advantage of market opportunities.
| Trading Style | |
|---|---|
| Indicator Type | |
| Timeframe | , , |
| Platform |
0
People watching this product now!
Downloads - 33
Description
Reviews (0)
How to Install
Related products
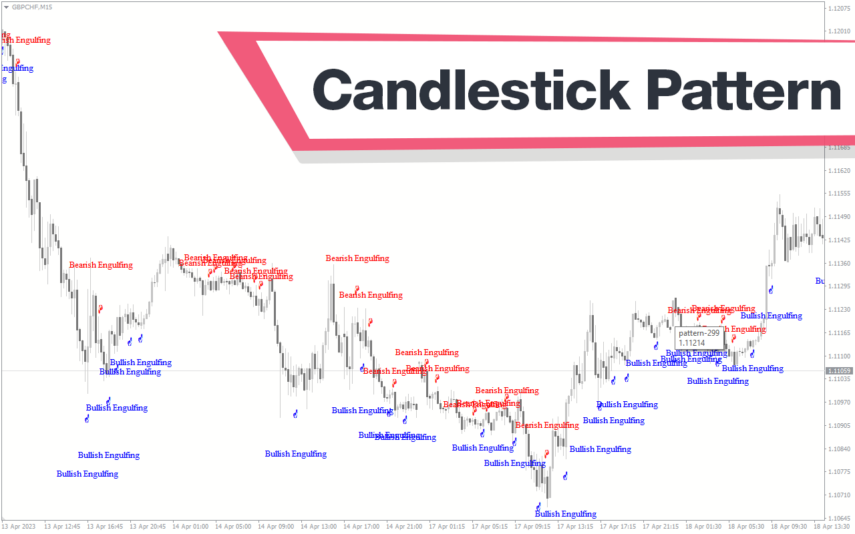
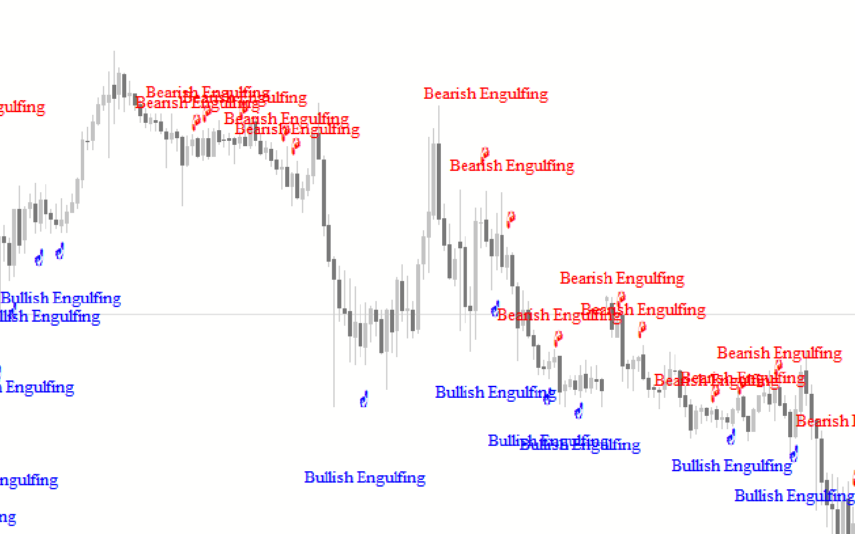
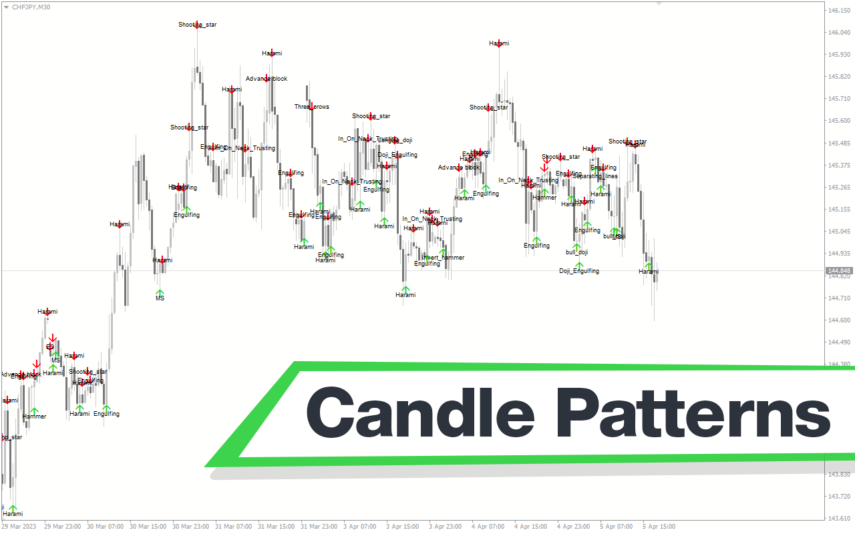
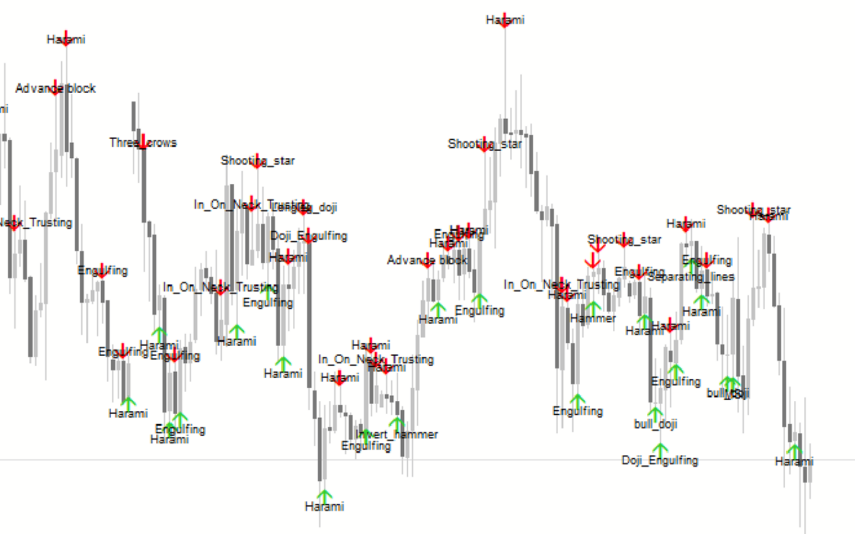
Candlestick Pattern
The Candlestick Pattern Indicator is a popular and free forex indicator that identifies various candlestick patterns on charts. It is a new MT4 indicator that analyzes the charts and displays candlestick patterns such as Doji, Hammer, Shooting Star, and more. The indicator also shows the pattern's name and signal strength, making it easier for traders to make trading decisions. This indicator is an essential tool for both novice and experienced traders who want to trade using candlestick patterns.
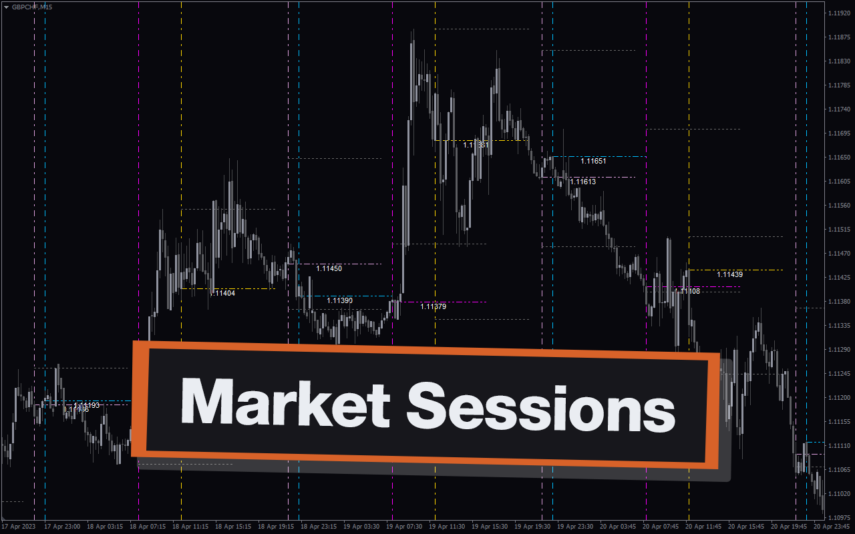
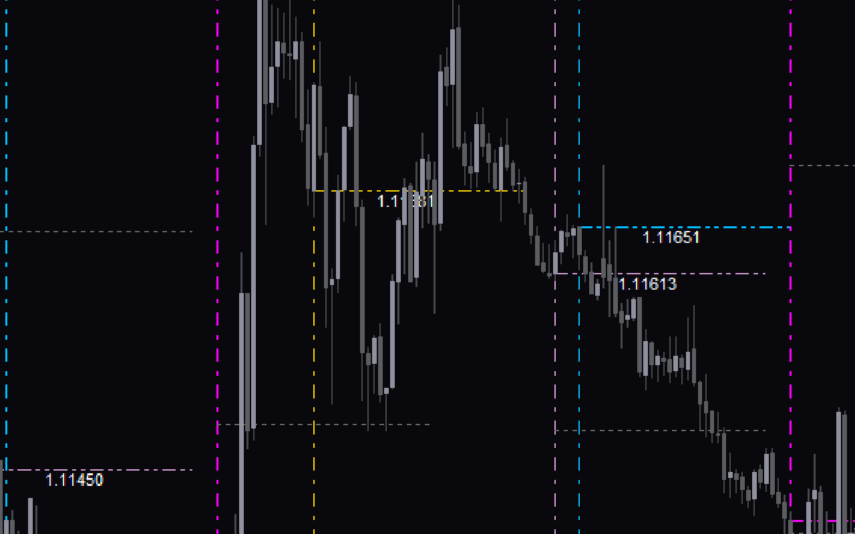
Market Sessions
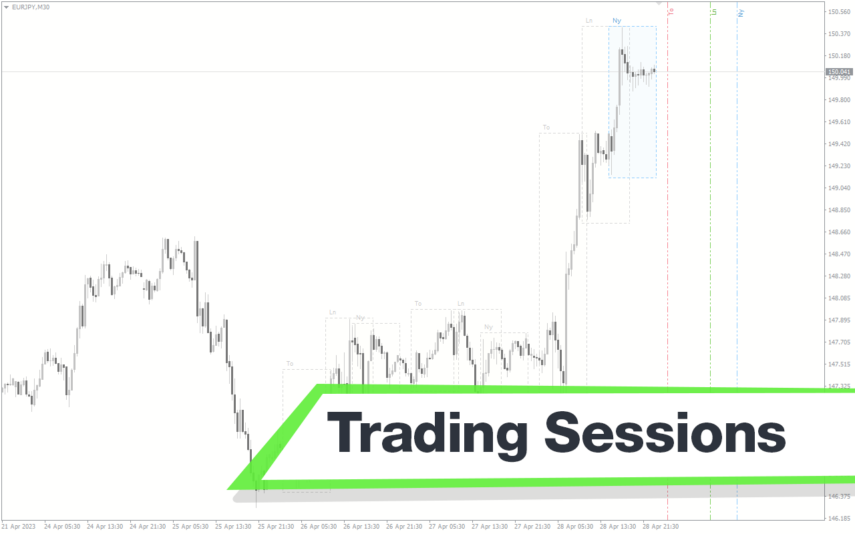
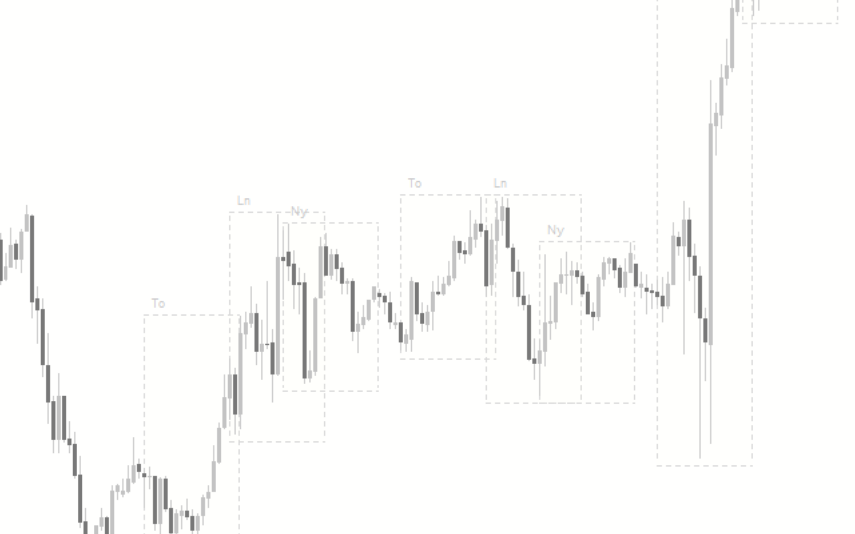
The Market Sessions Indicator is a free and popular Forex indicator for MT4. It is a useful tool for traders to identify the active trading sessions for different currency pairs. The indicator displays the start and end times of the major trading sessions in the Forex market, including London, New York, Tokyo, and Sydney. It also shows the current session and the time left until the next session. The Market Sessions Indicator is a convenient and powerful tool for traders of all levels to get a better understanding of the Forex market.
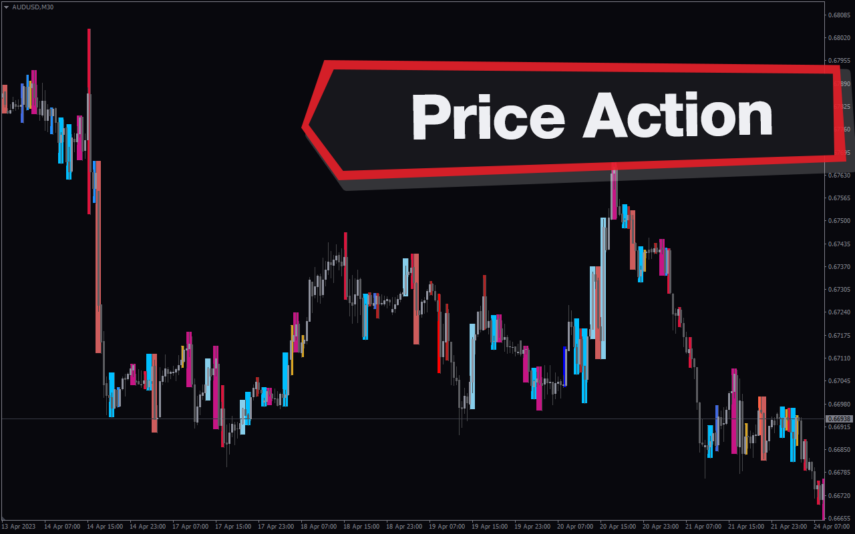
Price Action Scaner
The Price Action Scaner Forex Indicator is a useful and popular MT4 indicator that is free to use. It is designed to help traders identify price action patterns that are most likely to lead to profitable trades. The indicator uses a combination of trend analysis, support and resistance levels, and price action signals to provide traders with an insight into the current market conditions. It also provides alerts when certain trading signals are detected, allowing traders to take action quickly. With the Price Action Scaner Forex Indicator, traders can quickly identify potential trading opportunities and take advantage of them.
Reviews
There are no reviews yet.