Features of the Perfect Trendline Indicator
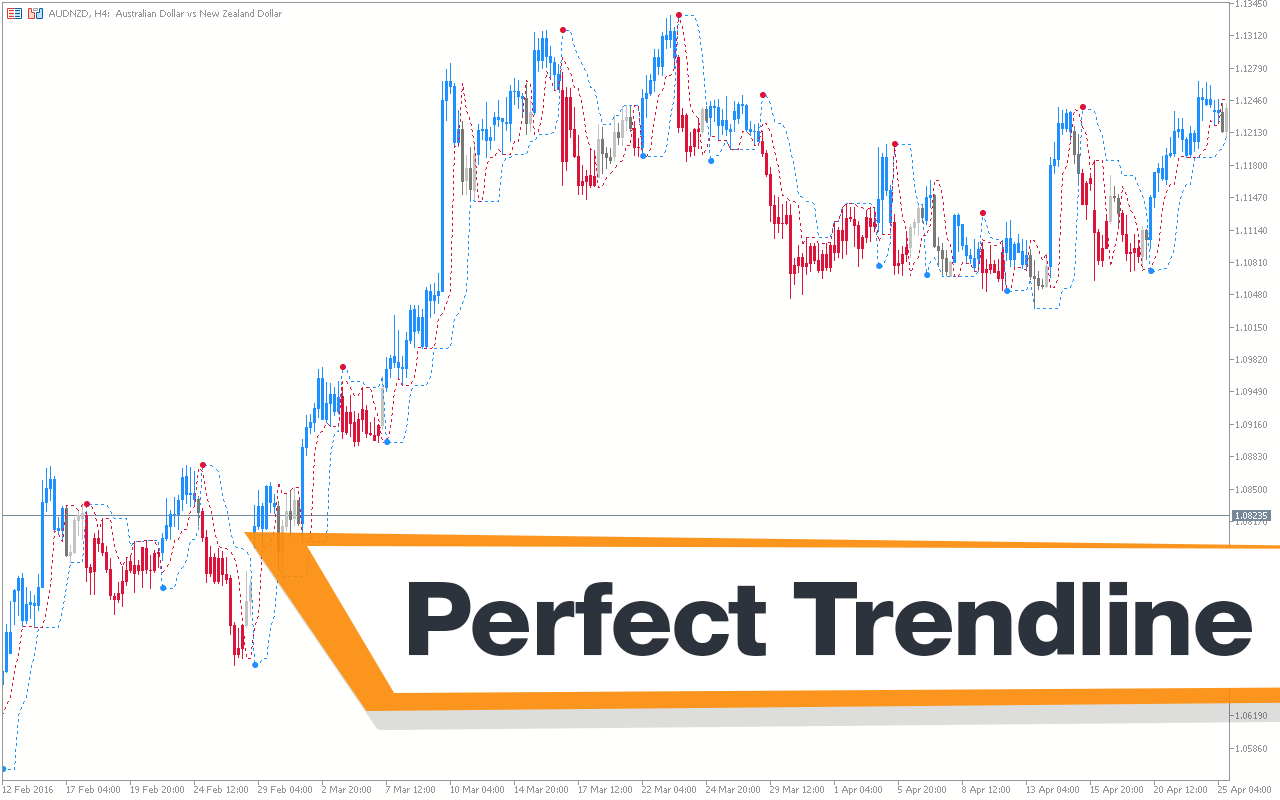
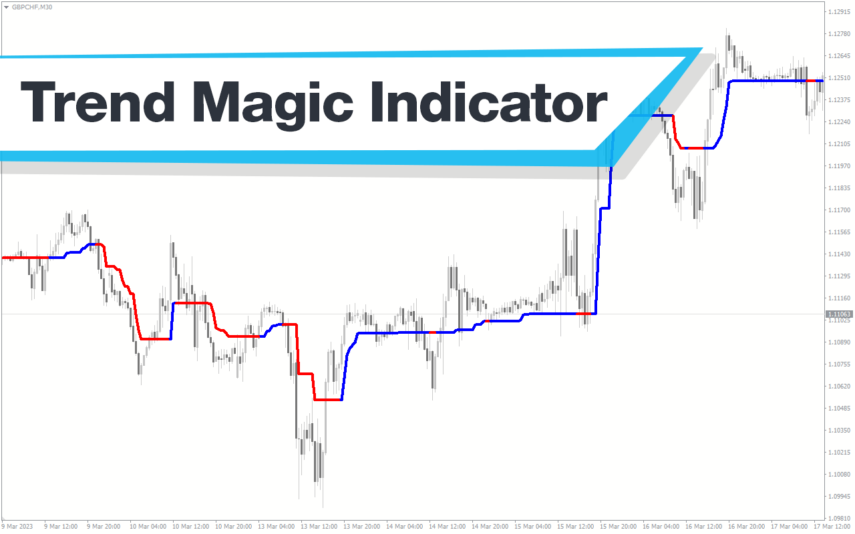
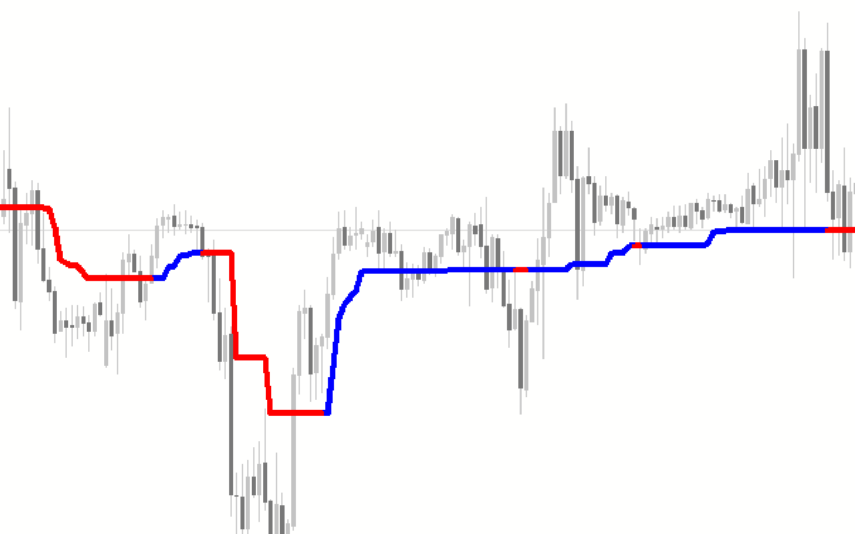
The Perfect Trendline indicator is a straightforward MT5 indicator that shows a trend’s direction. It has two trend lines: a rapid line and a sluggish line. These lines give buy and sell signals.
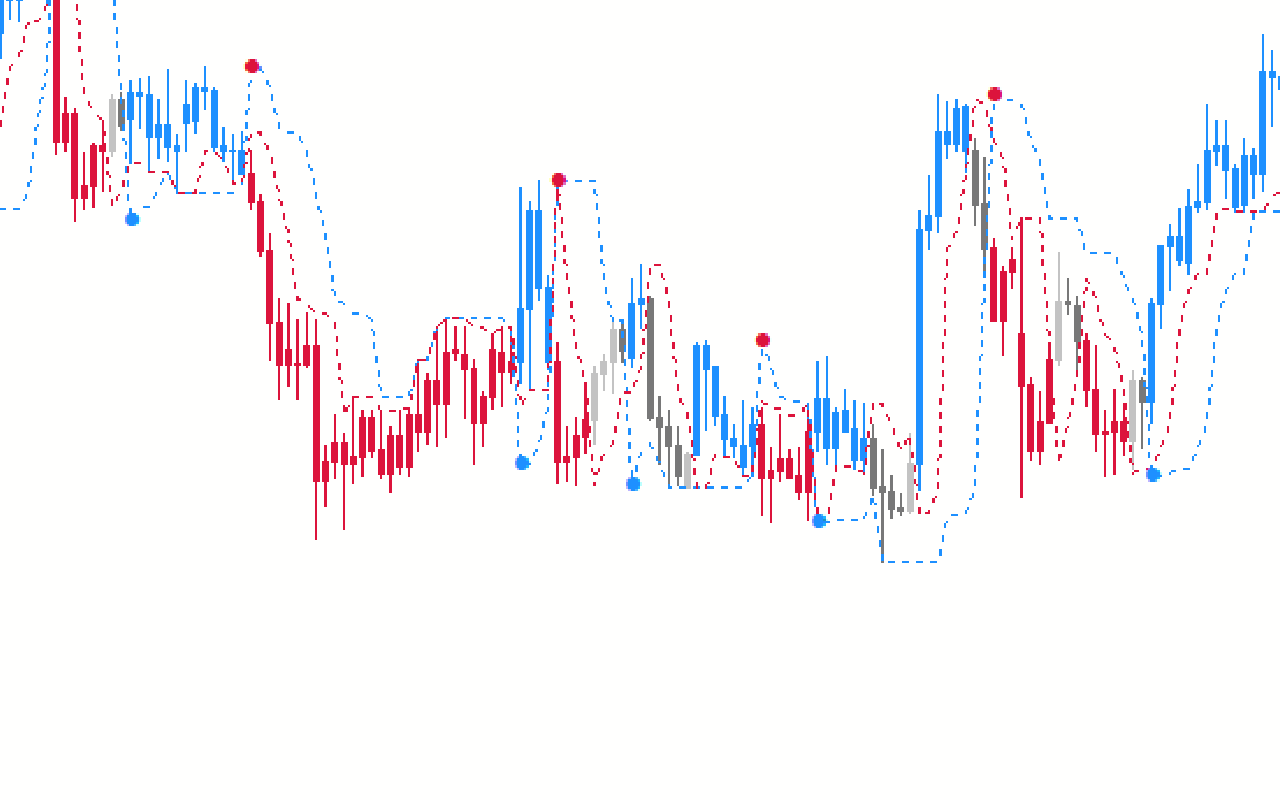
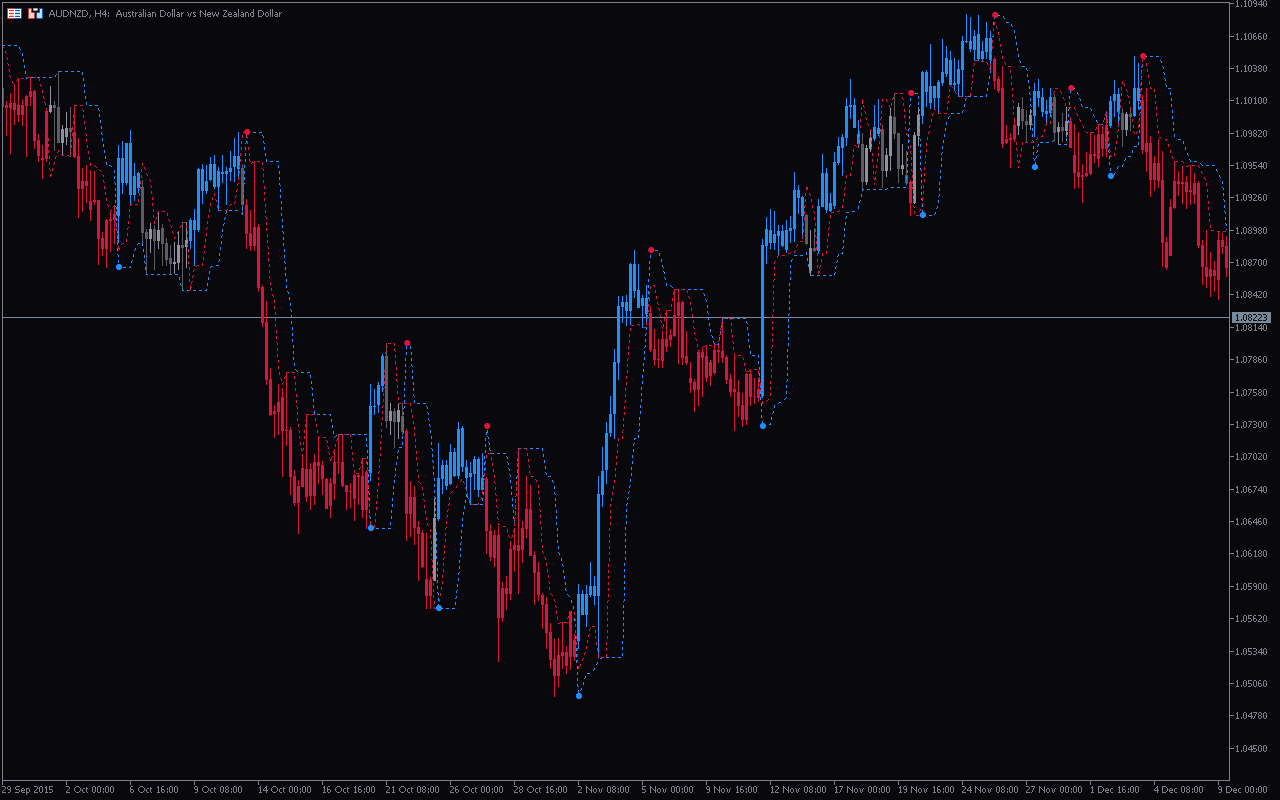
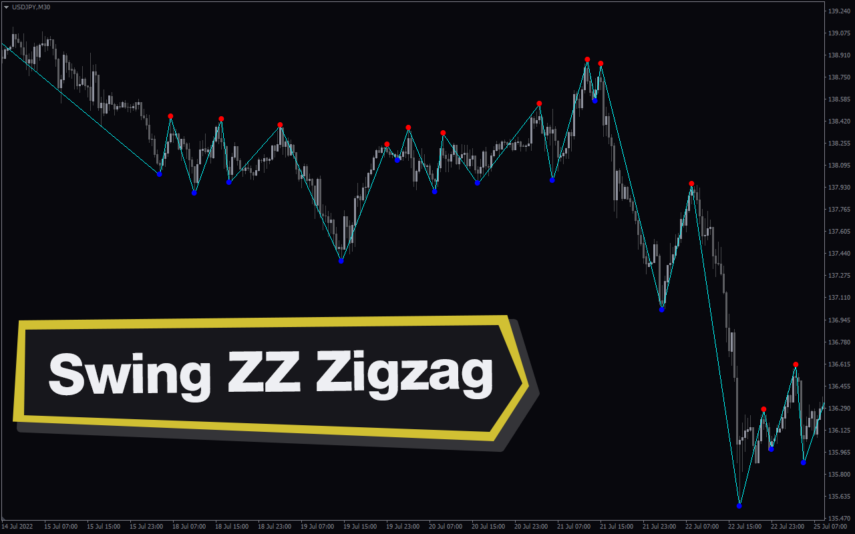
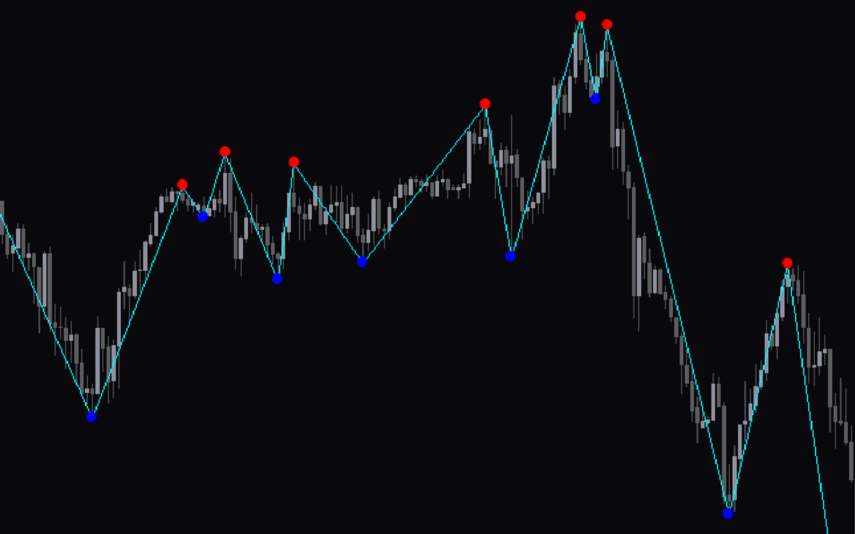
On the chart, the Perfect Trend indicator shows dots and trend lines. These dots serve as possible entry and exit areas. The dots are colored either red or blue. A blue dot represents a buy signal, whereas a red dot signifies a sell signal.
The indicator colors the traditional candles blue and red. Red represents bearish momentum, while blue represents bullish momentum. The candles remain unaffected by the indicator when the market is neutral.
How the Indicator Can Benefit You
The Perfect Trendline indicator draws trend lines on the chart along with up and down dots. The indicator shows the overall direction of the market using dots. Trendlines and dots indicate bullish and bearish momentum for buy and sell signals. Forex traders should look for two signals before entering a long position: the appearance of a blue dot and the moment when the blue trendline crosses over the red one.
On the other hand, for sell entries, traders should look for a red dot. Additionally, wait for the red trend line to cross above the blue one. Moreover, the dots can give good exit signals. Therefore, traders should close short positions when the blue dot appears. On the other hand, long positions should be closed when a red dot shows up.
Indicator Setting Description

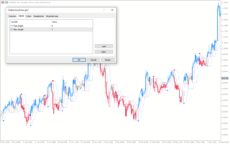
FastLength: The default value is 3. It is the period for the fast trendline.
SlowLength: The default value is 7. It is the period for the slow trendline.


Reviews
There are no reviews yet.