
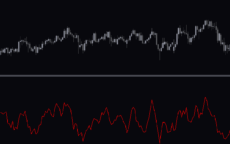
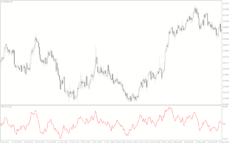
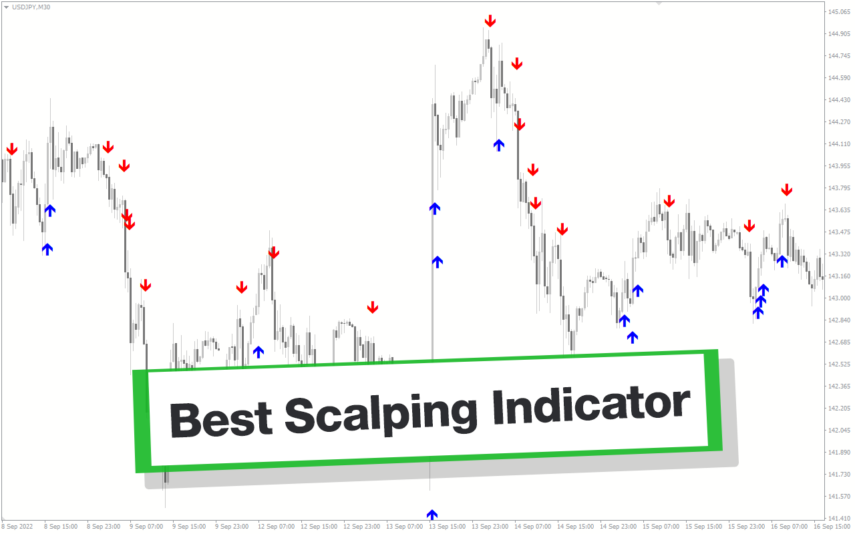
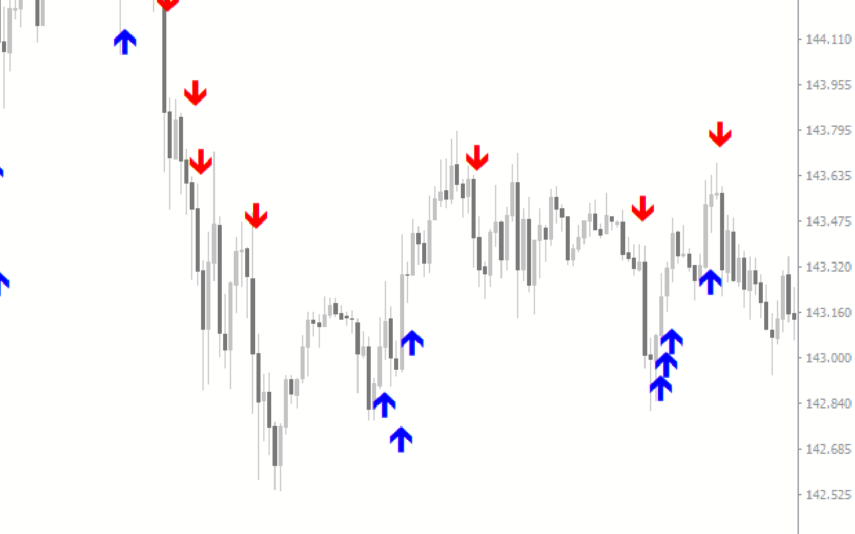
The DMI Oscillator Indicator is a popular and free Forex indicator for the Meta Trader 4 (MT4) trading platform. It is a useful tool for traders to identify the trend direction of the market, as well as the strength of the trend. The DMI Oscillator Indicator is composed of two lines, one red and one green. The red line is known as the DMI+ line and it measures the strength of the uptrend, while the green line is known as the DMI- line and it measures the strength of the downtrend. When the red line is above the green line, it indicates a strong uptrend in the market and when the green line is above the red line, it indicates a strong downtrend in the market. The DMI Oscillator Indicator is a useful tool for traders to identify the trend direction of the market and the strength of the trend. It is especially useful for traders who are looking to take advantage of the trend. The indicator helps traders identify whether the trend is strong or weak, and thus helps them decide when to enter and exit the market.
MT4


DMI Oscillator
The DMI Oscillator Indicator is a popular free Forex indicator used by traders for technical analysis. The indicator is available for the MetaTrader 4 (MT4) platform and is easy to install and use. The DMI Oscillator is composed of two lines, the DMI+ and the DMI-. These lines measure the strength of the trend in the market. The DMI Oscillator can be used to identify trend direction, trend strength, and potential reversals.
| Trading Style | |
|---|---|
| Indicator Type | |
| Platform | |
| Timeframe | , |
0
People watching this product now!
Downloads - 22
Description
Reviews (0)
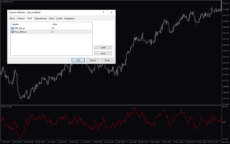
How to Install
Related products
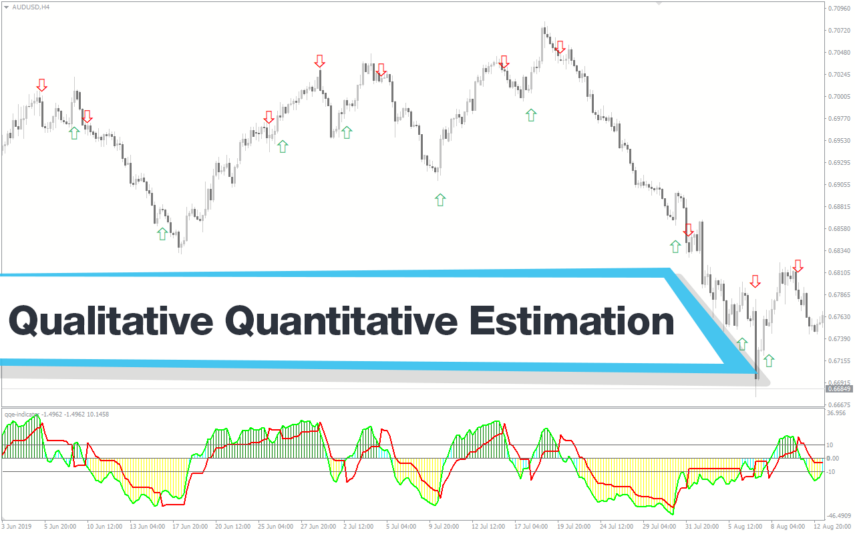
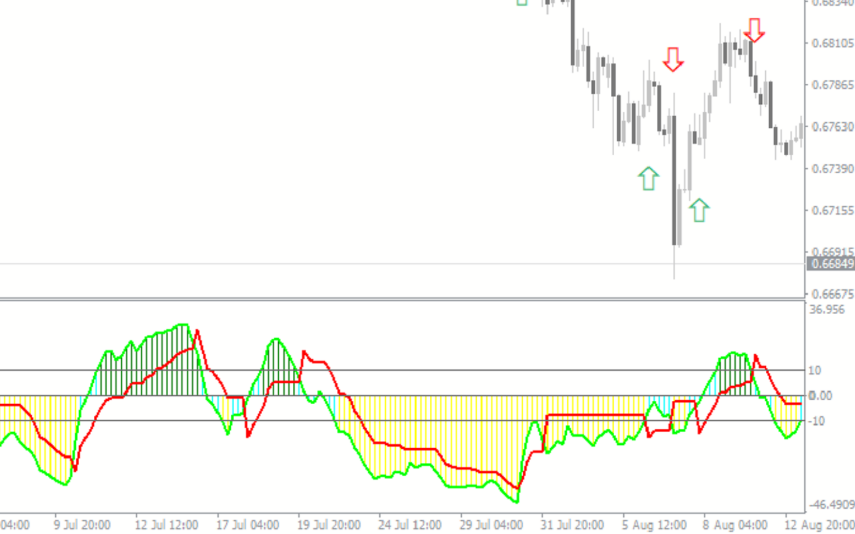
Qualitative Quantitative Estimation
The Qualitative Quantitative Estimation Indicator is a powerful tool for traders in the Forex market. It's a new and popular indicator that works with the MT4 platform. The QQE Indicator is used to determine market trends, identify overbought and oversold positions, and detect divergence in prices and momentum.
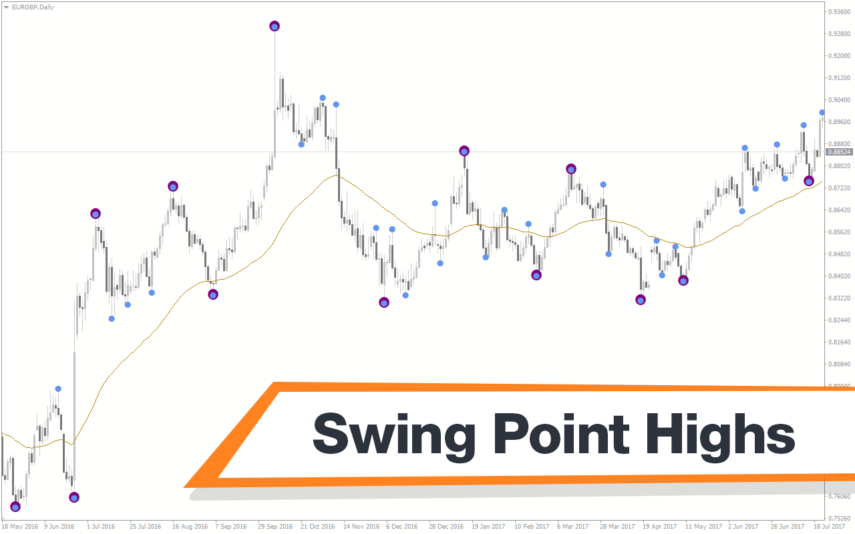
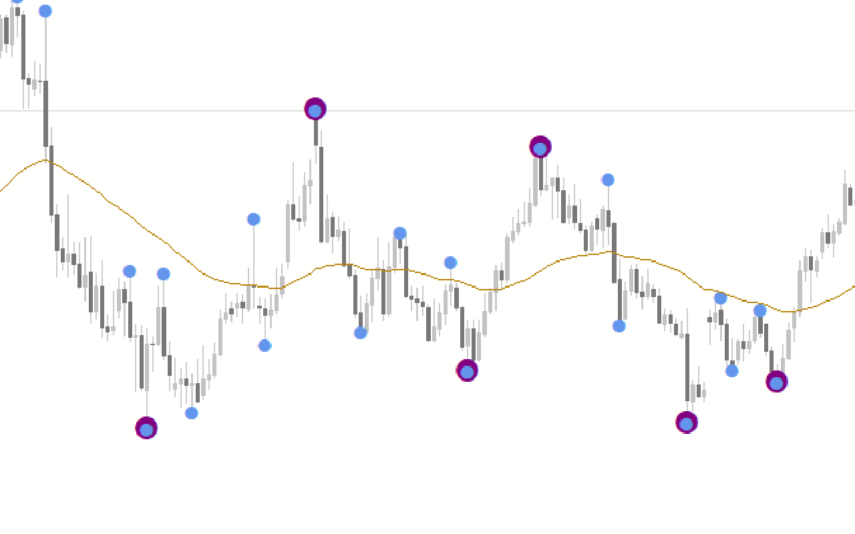
Swing Point Highs
The Swing Point Highs and Lows indicator is a new, popular and free MT4 technical analysis tool for forex traders. This indicator works by identifying swing points on a price chart and then drawing horizontal lines to indicate potential support and resistance levels. The swing point high and low indicator is a valuable tool for traders who want to identify key support and resistance levels and is suitable for both beginners and experienced traders.
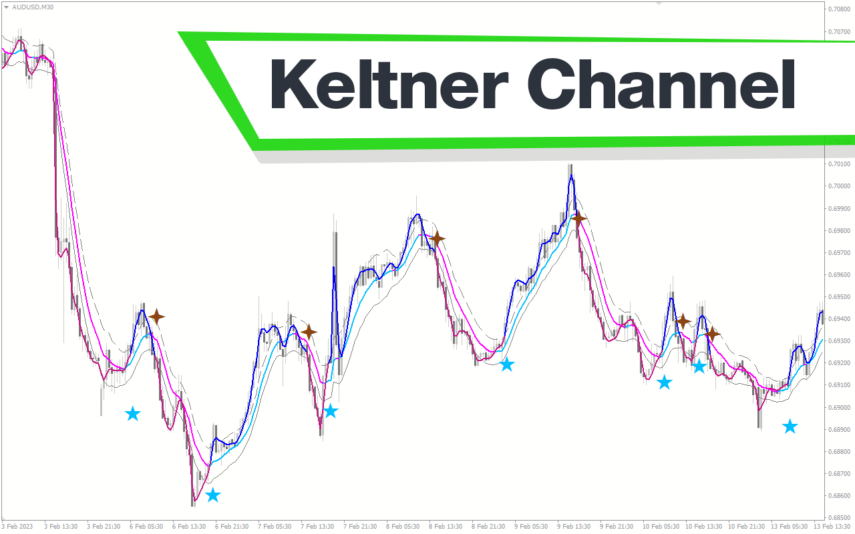
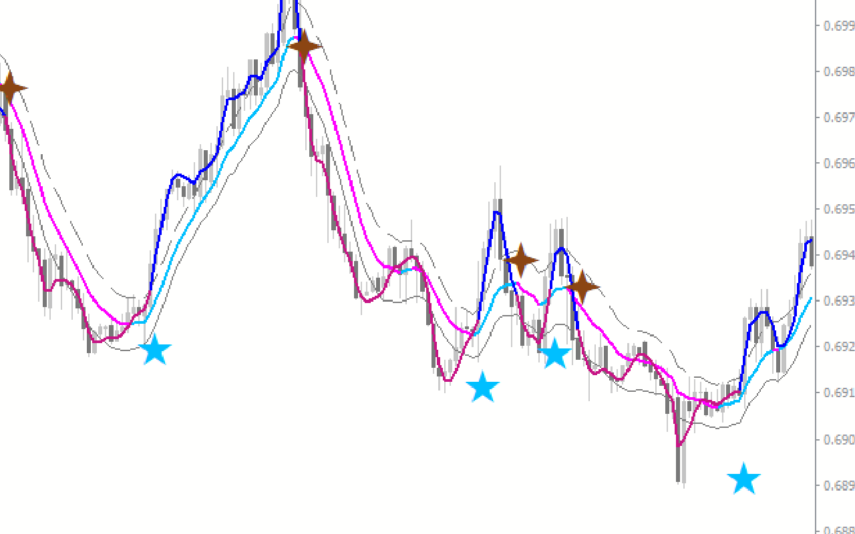
Keltner Channel With Signals
The Keltner Channel with Signals Indicator is a popular and free forex indicator that runs on the MT4 platform. This is a new and innovative tool that uses the Keltner Channel as the basis for generating trading signals, helping traders identify potential trading opportunities. Use the Keltner Channel with Signals Indicator as a powerful tool that can help traders succeed in the forex market.
Reviews
There are no reviews yet.