

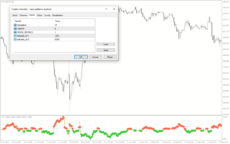
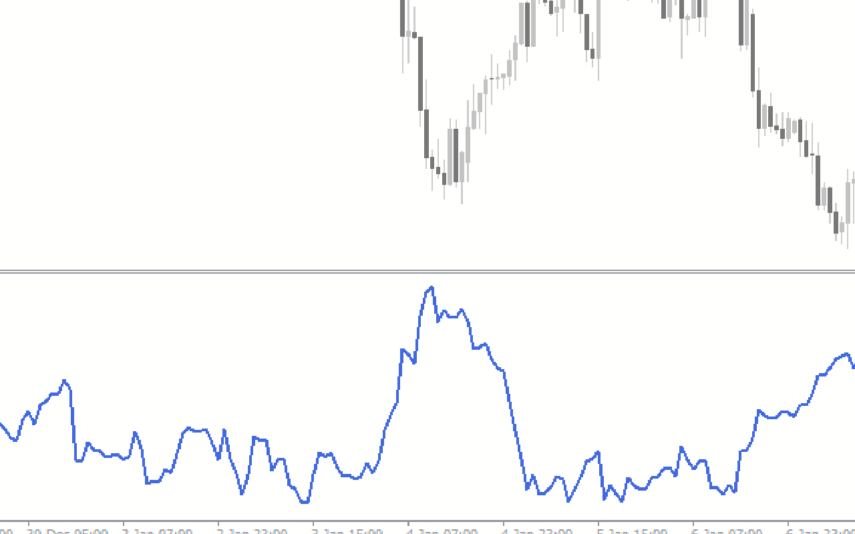
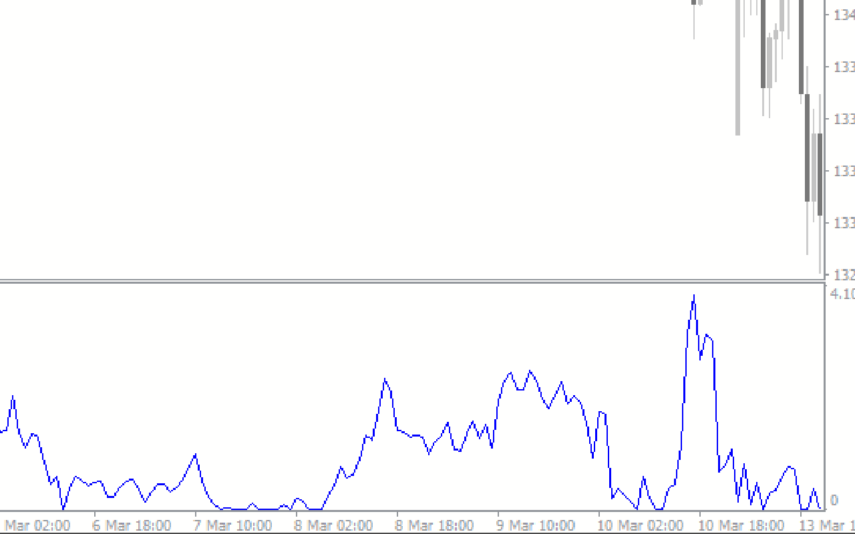
The Xaos Patterns Explorer is a popular and free MT4 Forex indicator that can be used to identify and analyze different patterns in the Forex market. It is a useful tool for traders who want to take advantage of market trends and make profitable trades. The Xaos Patterns Explorer is designed to identify patterns in the Forex market and provide traders with an easy way to analyze and identify potential trading opportunities. The indicator uses a variety of algorithms to analyze the market and identify patterns that can indicate a potential trade. It can also be used to identify potential entry and exit points, as well as to identify potential support and resistance levels. The indicator is easy to use and can be used to identify and analyze patterns in the Forex market. It is a useful tool for traders who want to identify potential entry and exit points, as well as to identify potential support and resistance levels.

MT4


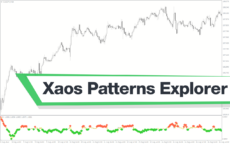
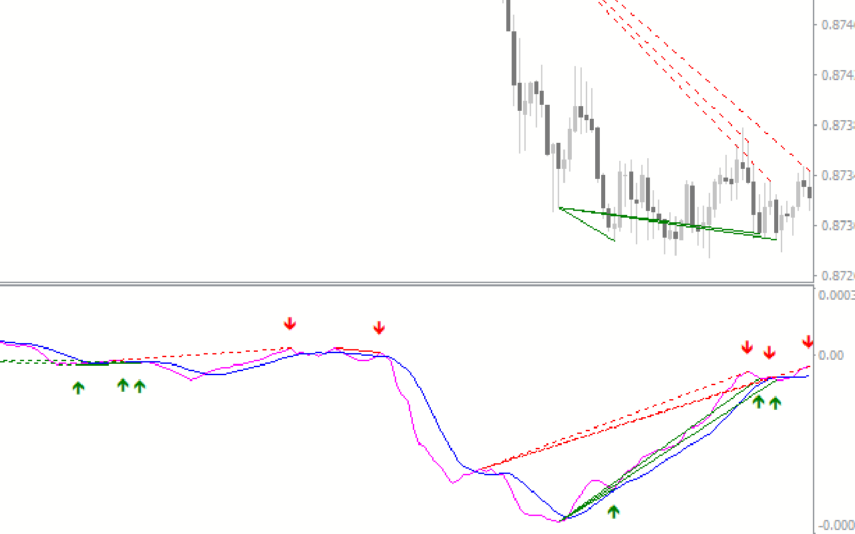
Xaos Patterns Explorer
The Xaos Patterns Explorer is a powerful and useful Forex indicator for the MetaTrader 4 (MT4) trading platform. This indicator utilizes a unique algorithm to scan the market for the most profitable patterns and then displays them in an easy to read format. It is easy to use and provides an easy to read display of the most profitable patterns. It is a great indicator for any trader looking to maximize their profits in the Forex market.
| Trading Style | |
|---|---|
| Indicator Type | |
| Timeframe | |
| Platform |
0
People watching this product now!
Downloads - 9
Description
Reviews (0)
How to Install
Related products
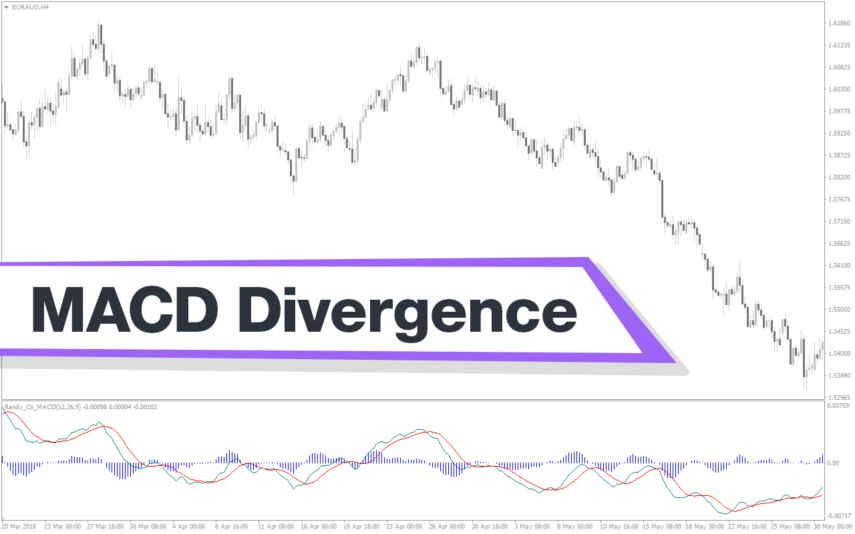
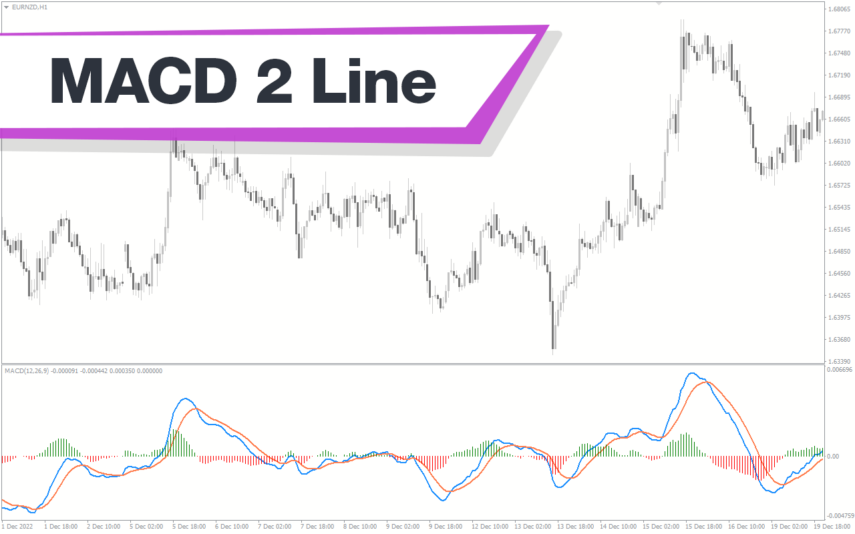
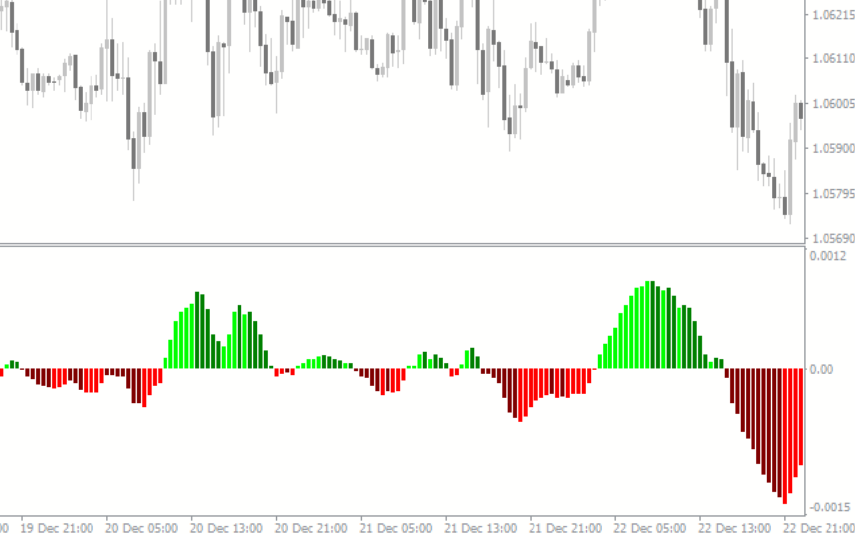
MACD Divergence
The MACD Divergence Indicator is a powerful tool that helps traders identify trend reversal points in the market. It is a popular and free indicator that is compatible with the MT4 platform. This new indicator plots divergences between the MACD indicator and the price on your chart, making it easy to spot potential trend reversals. It works by measuring the difference between two moving averages, and traders can use it to identify bullish or bearish divergences. With its ability to identify trend reversal points, this indicator is useful for both beginner and advanced traders.
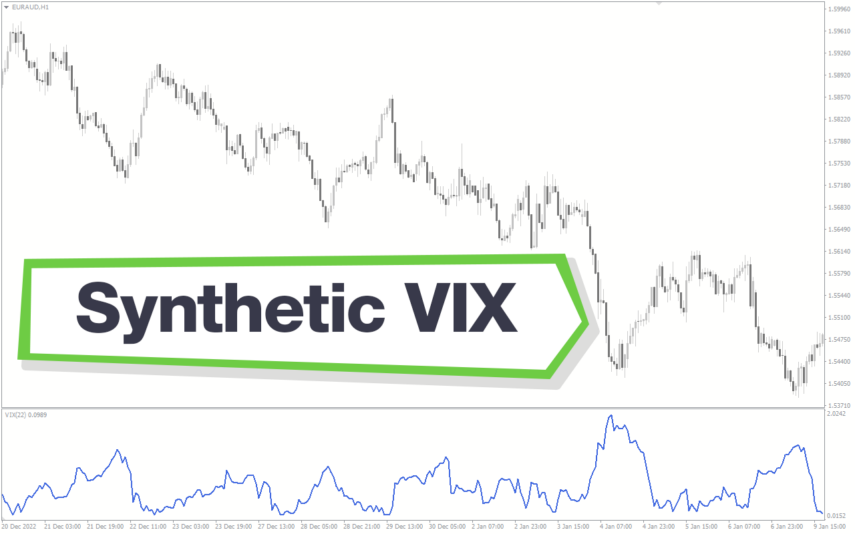
Synthetic VIX
The Synthetic VIX Indicator is a popular and free Forex indicator for the MT4 trading platform. The indicator utilizes a combination of price action and signals from multiple time frames to accurately predict market movements. The Synthetic VIX indicator can be used to identify potential entry and exit points in the market, as well as to identify trend reversals and breakouts. It is designed to provide traders with an easy to use and reliable indicator that can help them make informed trading decisions. With its accurate and reliable signals, the Synthetic VIX Indicator is a great tool for any trader looking to improve their trading performance.
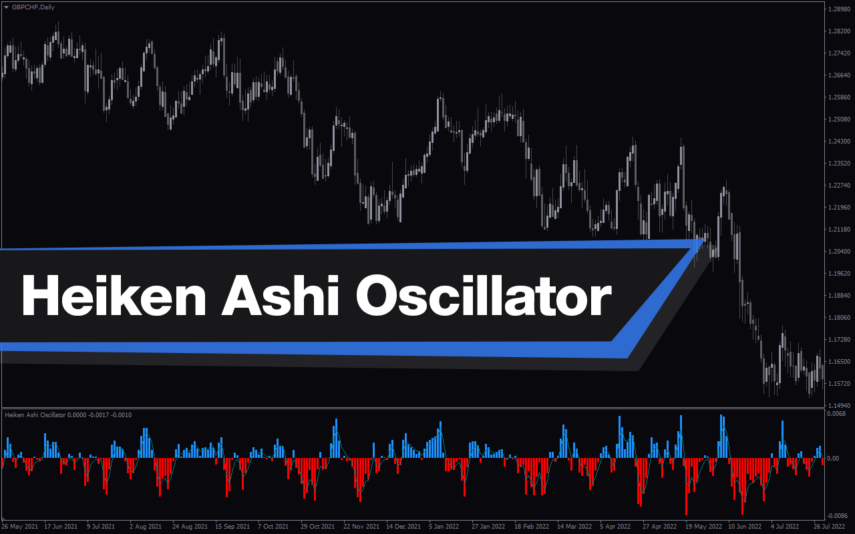
Heiken Ashi Oscillator
The Heiken Ashi Oscillator indicator is a popular, new and free Forex trading tool available on the MT4 platform. This indicator is designed to help traders identify trends in the market using Heiken Ashi candles that provide a more accurate representation of price action. The indicator works by analyzing the difference between Heiken Ashi candles and regular candles on the chart, providing a histogram that shows the strength of the trend. Use the Heiken Ashi Oscillator to improve your trading skills.
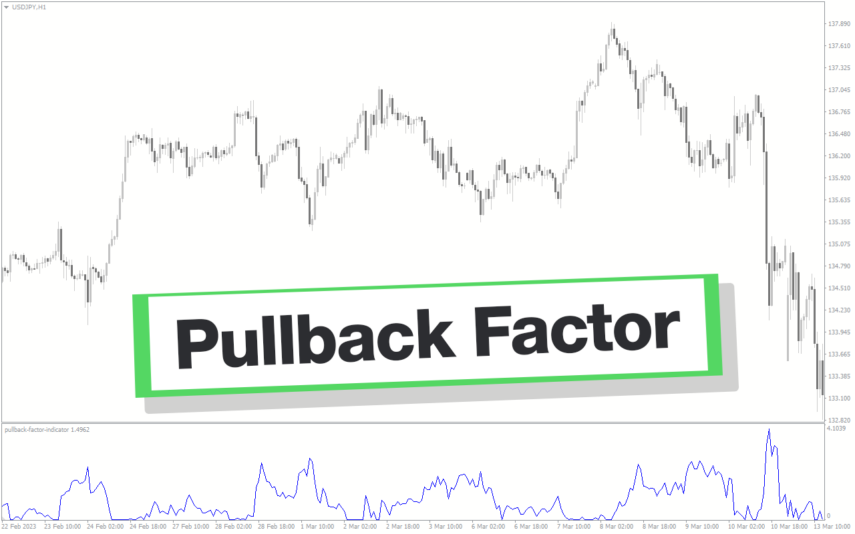
Pullback Factor
Pullback Factor Indicator is a popular and new trend-following indicator designed for use in the forex market. It helps you to identify the end of a trend retracement and the resumption of the trend. With its unique algorithm, the indicator predicts the extent of a trend pullback, enabling traders to enter the market with precision and accuracy.
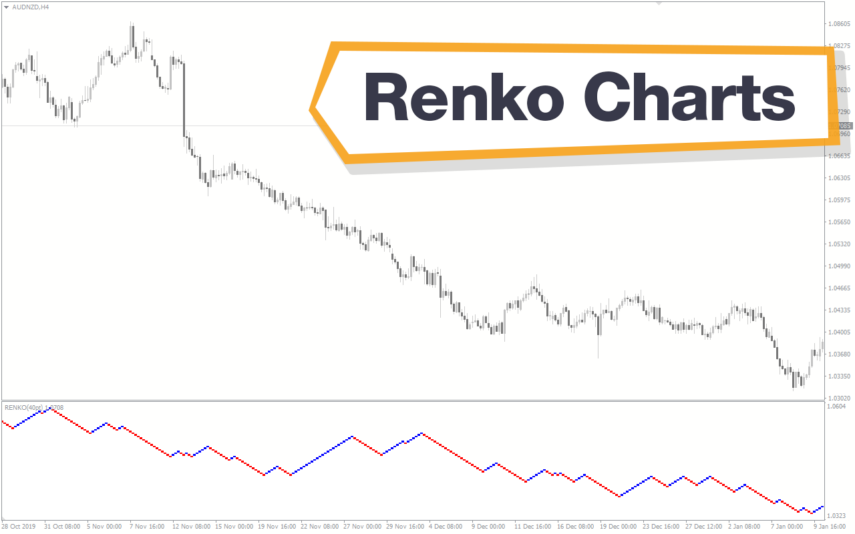
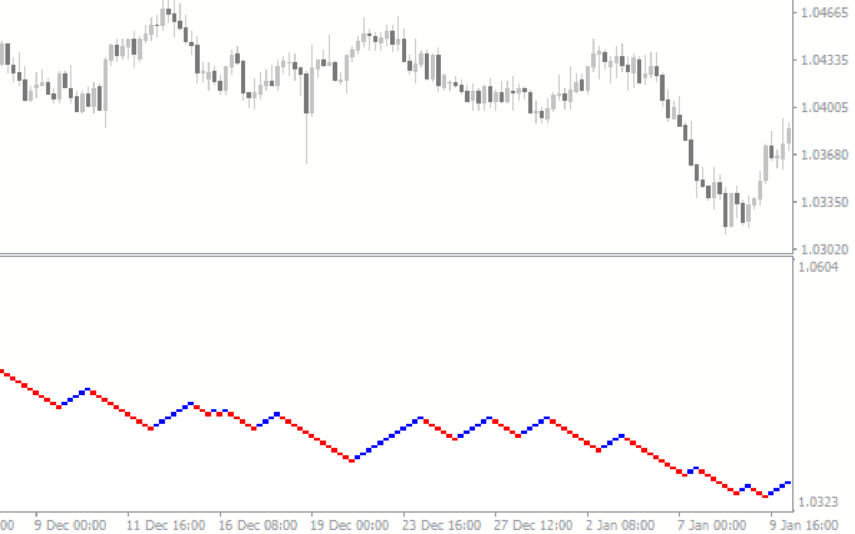
Renko Charts
The Renko Charts indicator is a popular free MT4 tool used by forex traders to analyze market trends. It works by plotting price movements as "bricks" on a chart, where each brick represents a predetermined price range. This helps filter out market noise and highlight the direction of the trend. Make The Renko Charts indicator a useful tool to improve your Forex trading strategies.
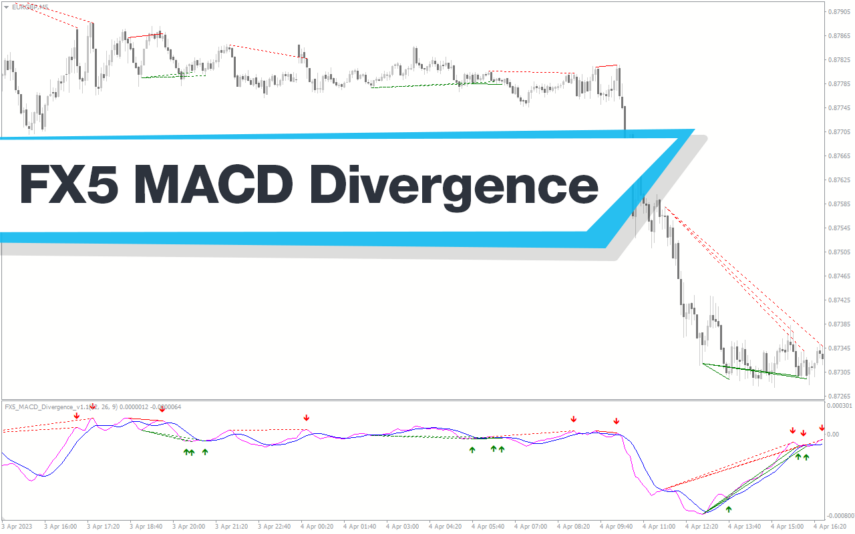
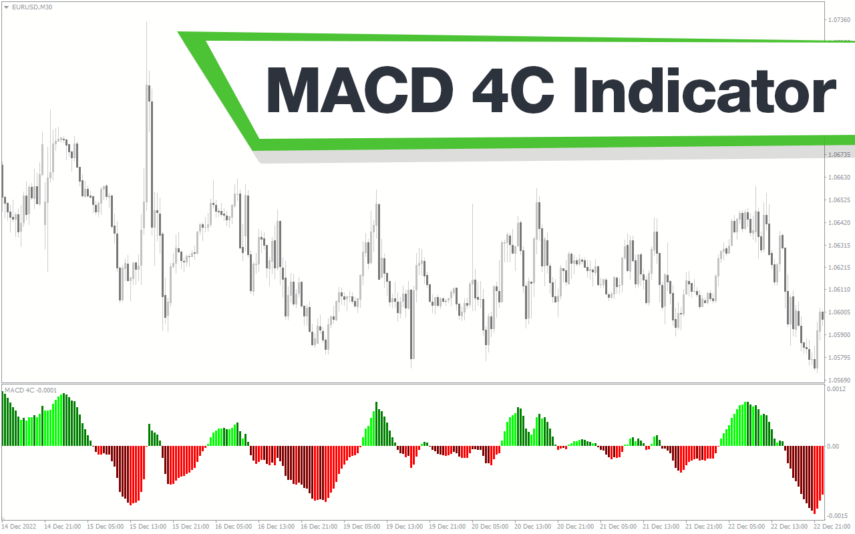
FX5 MACD Divergence
The MACD FX5 Divergence Indicator is a new and popular forex indicator that runs on the MT4 platform. This is a free indicator that traders can use to identify potential trend reversals and momentum shifts. The indicator is based on the Moving Average Convergence-Divergence (MACD) indicator, which measures the distance between two moving averages. It analyzes the divergence between the MACD indicator and price action and then generates buy or sell signals. Use this indicator to better understand market trends and take advantage of potential profit opportunities.

Reviews
There are no reviews yet.