
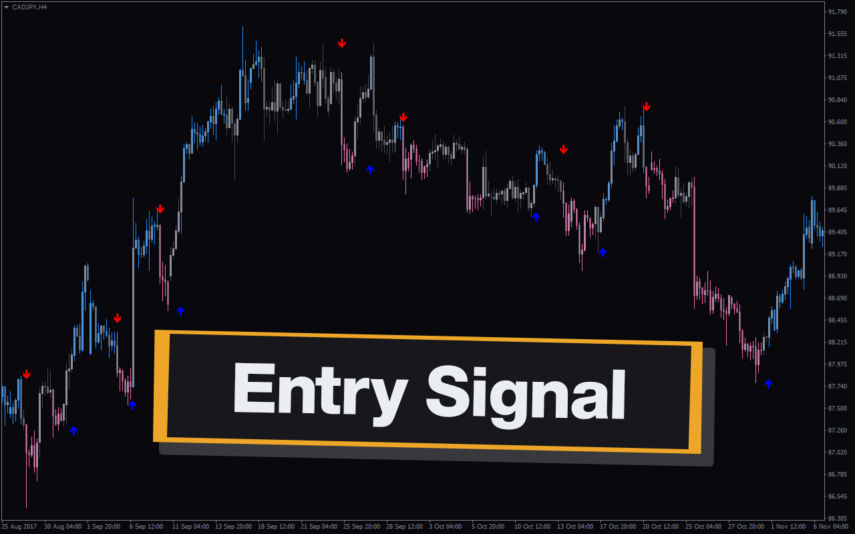
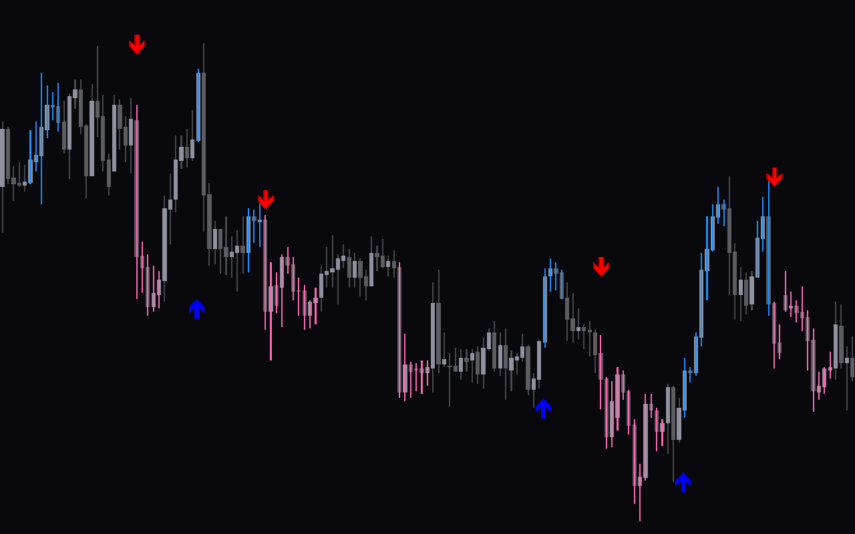
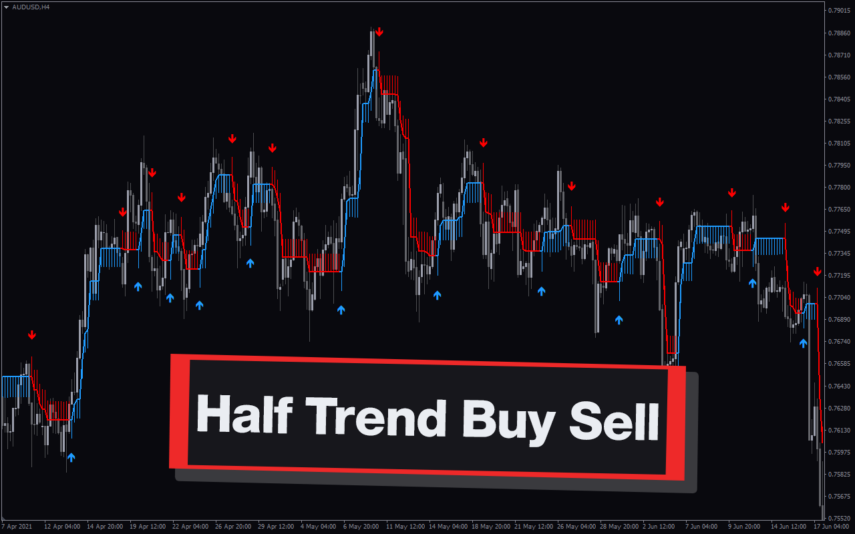
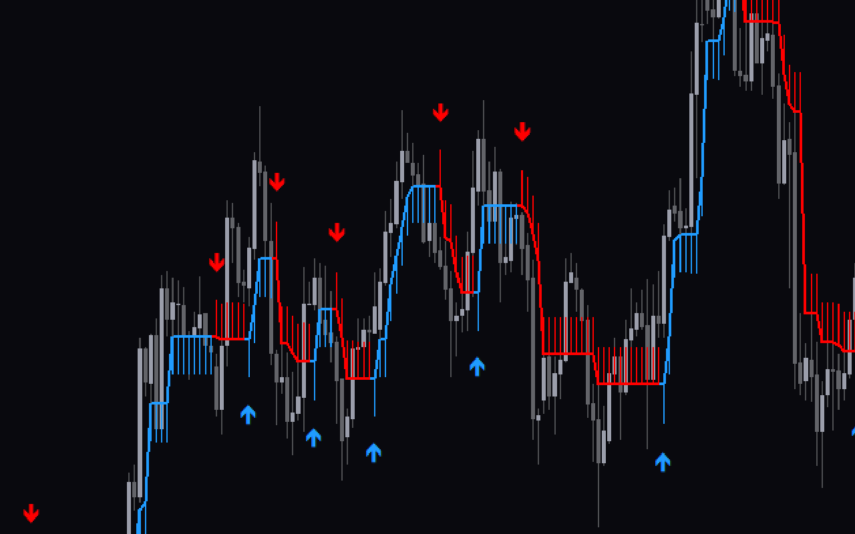
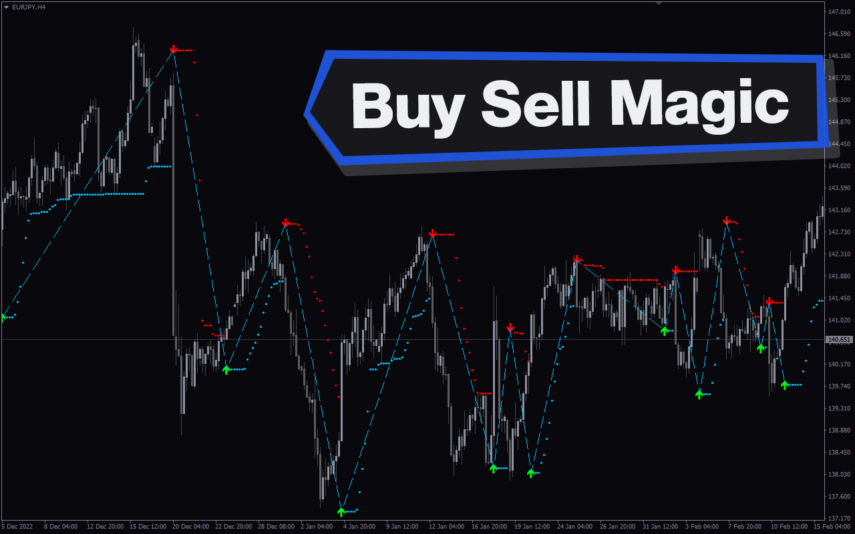
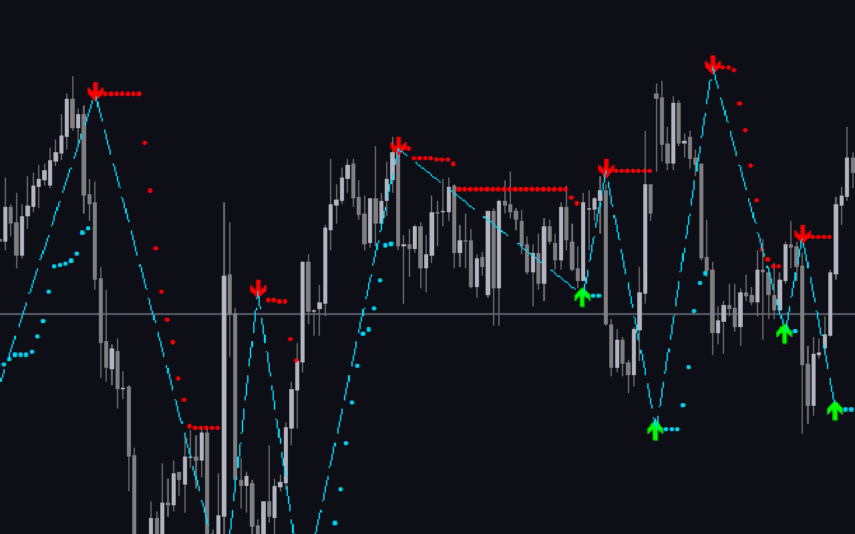
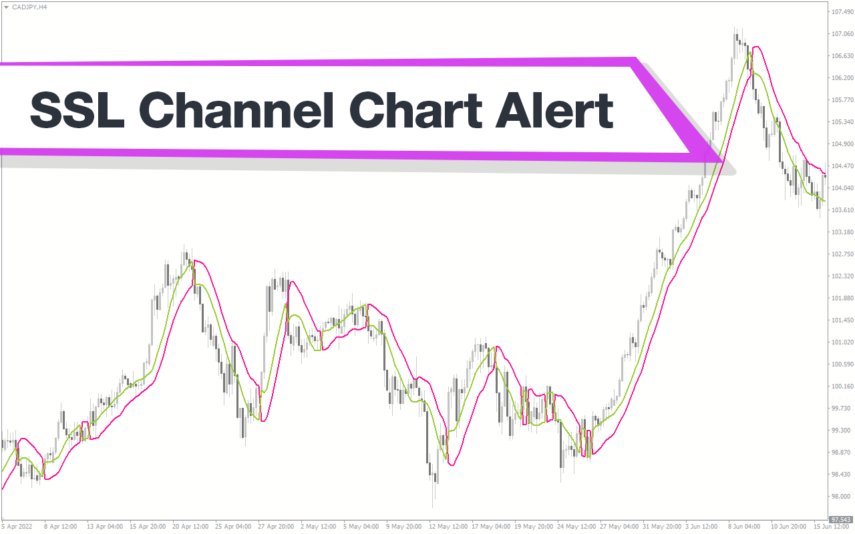
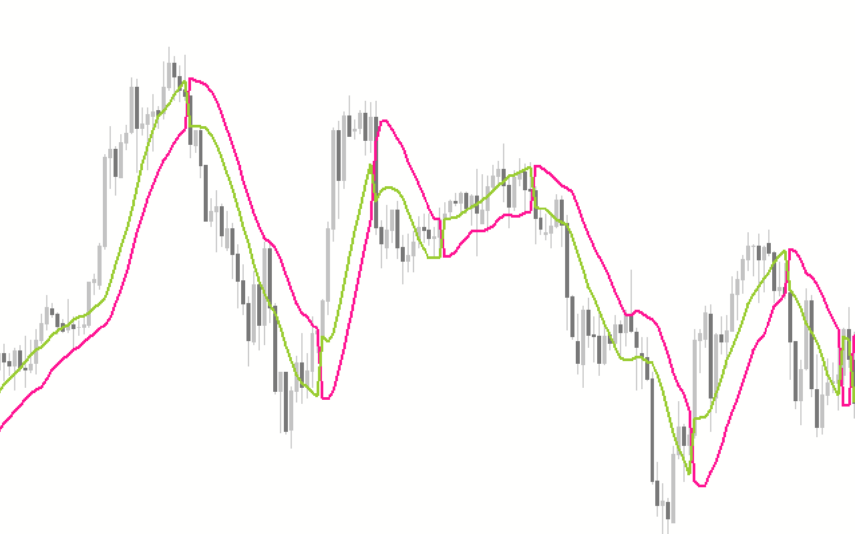
The Tasskit Indicator is a useful forex indicator that has become popular among MT4 users. This indicator is available for free and is designed to help traders make more informed decisions when trading in the forex market. The Tasskit Indicator works by analyzing market trends and identifying key support and resistance levels. It uses advanced algorithms to provide accurate buy and sell signals, helping traders to enter and exit trades at the right time. To use the Tasskit Indicator, simply download and install it on your MT4 platform. The indicator will then appear on your charts, displaying relevant information to assist you in your trading. By utilizing the insights provided by the Tasskit Indicator, traders can improve their trading strategies and potentially increase their profits in the forex market.
MT4


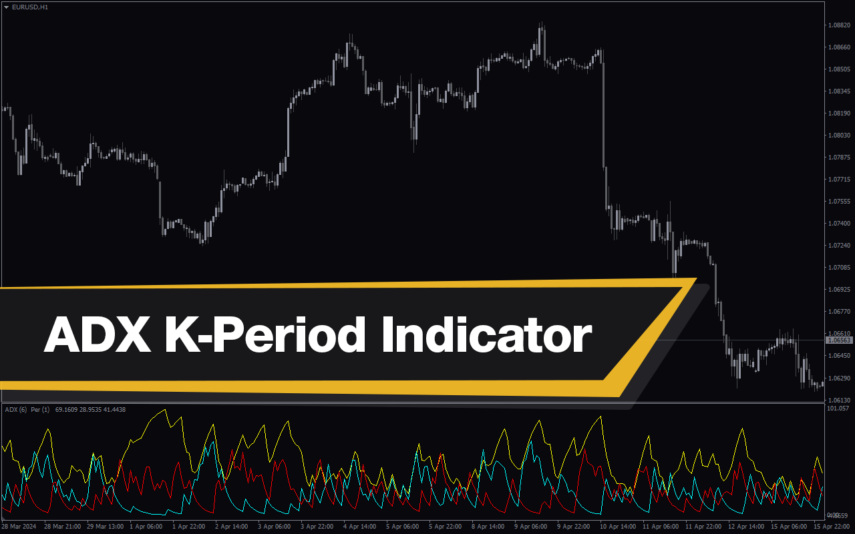
Tasskit
TASSKIT Indicator MT4 is a popular and useful forex indicator available for free on MetaTrader 4. This indicator helps users identify trends and potential entry and exit points in the forex market. It provides visual signals to make trading decisions easier for both experienced and novice traders. To use TASSKIT Indicator MT4, simply install it on your MetaTrader 4 platform and follow the visual signals it provides.
| Indicator Type | |
|---|---|
| Trading Style | , |
| Timeframe | |
| Platform |
0
People watching this product now!
Downloads -
Description
Reviews (0)
How to Install
Related products
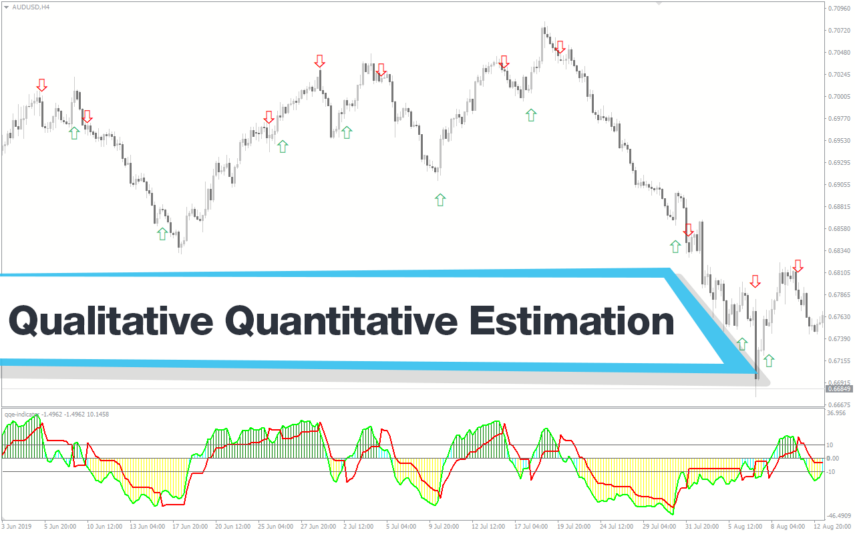
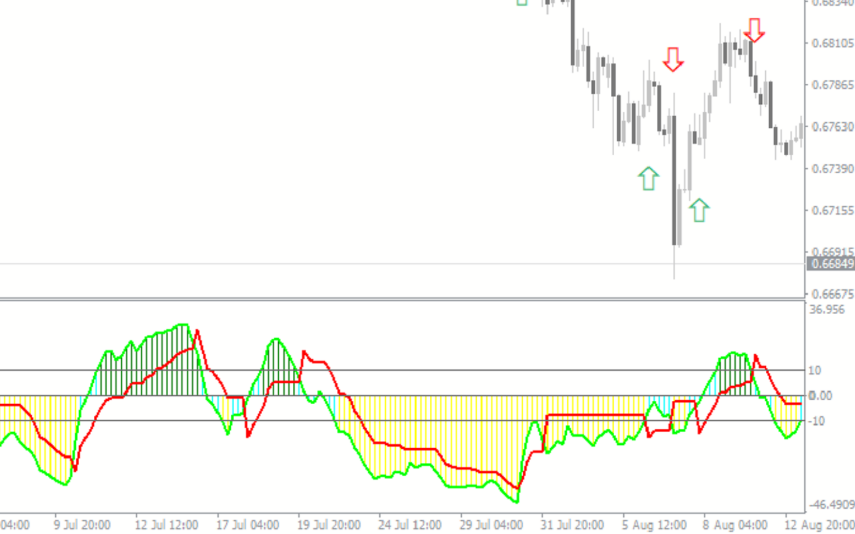
Qualitative Quantitative Estimation
The Qualitative Quantitative Estimation Indicator is a powerful tool for traders in the Forex market. It's a new and popular indicator that works with the MT4 platform. The QQE Indicator is used to determine market trends, identify overbought and oversold positions, and detect divergence in prices and momentum.
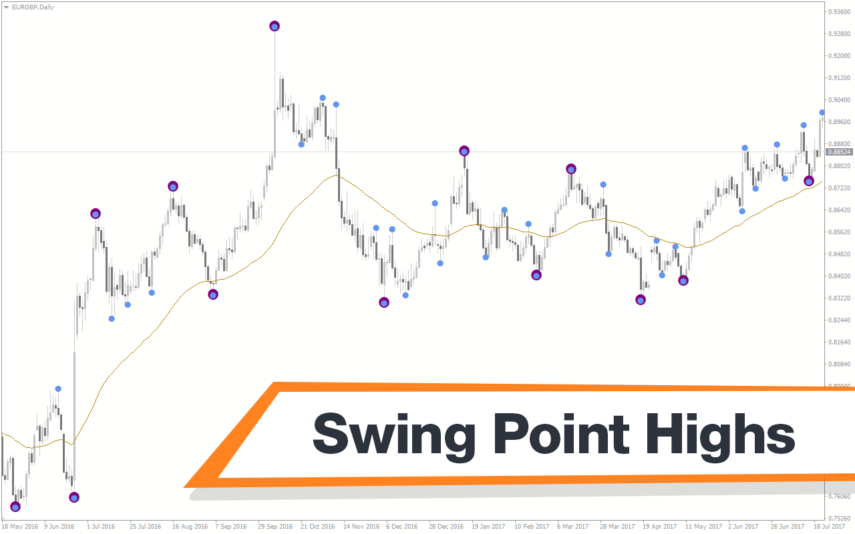
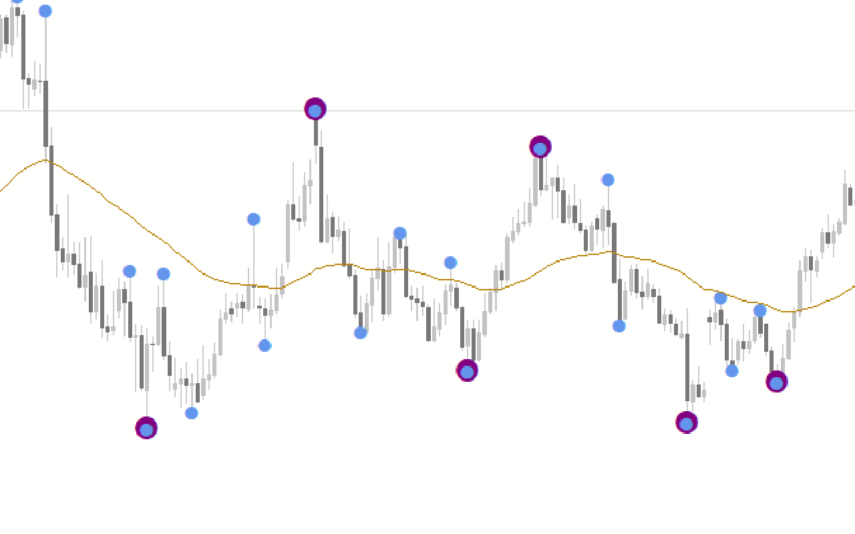
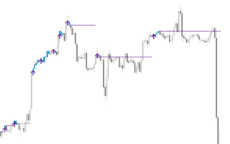
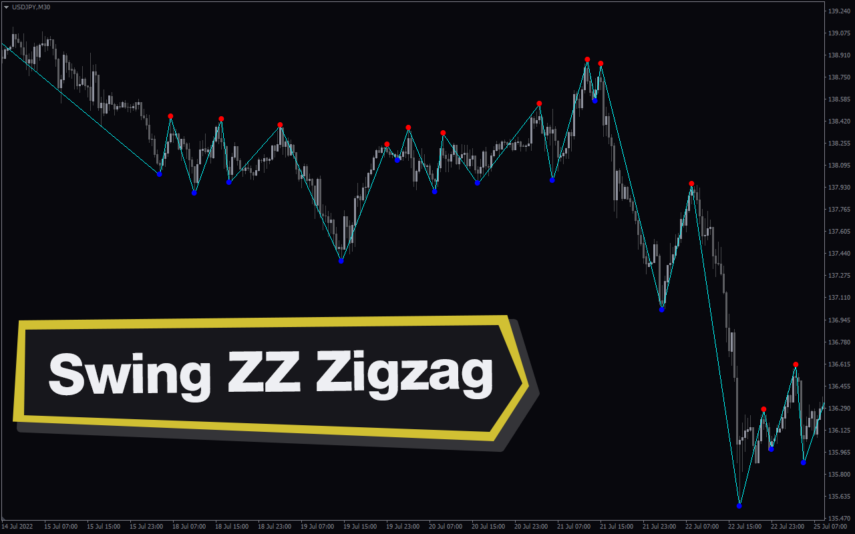
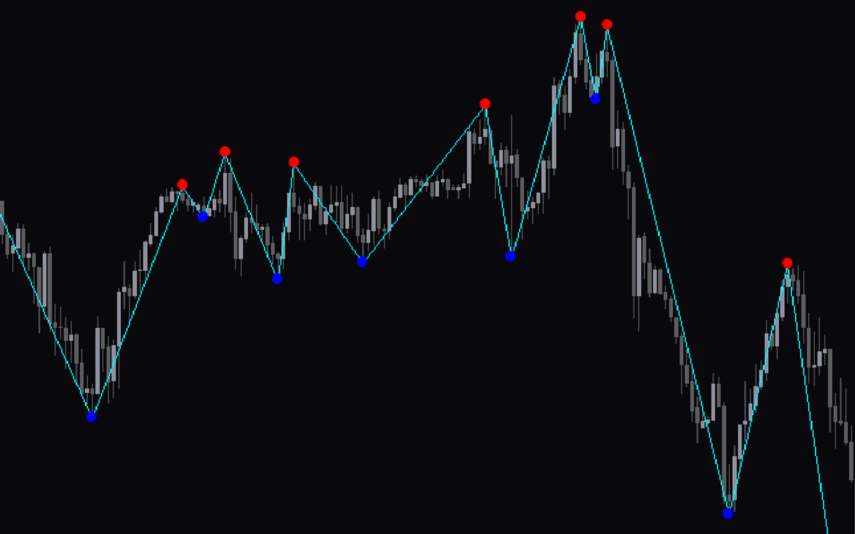
Swing Point Highs
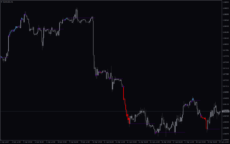
The Swing Point Highs and Lows indicator is a new, popular and free MT4 technical analysis tool for forex traders. This indicator works by identifying swing points on a price chart and then drawing horizontal lines to indicate potential support and resistance levels. The swing point high and low indicator is a valuable tool for traders who want to identify key support and resistance levels and is suitable for both beginners and experienced traders.
Reviews
There are no reviews yet.