
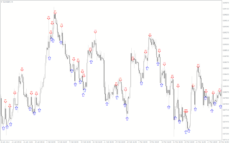
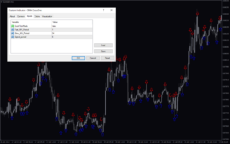
The SMA Crossover Forex Indicator is a popular and free tool used by traders to identify potential trading opportunities. This indicator is especially useful for traders who want to take advantage of the market momentum and identify potential entry and exit points. The indicator works by combining two Simple Moving Averages (SMA) of different lengths. When the shorter SMA crosses above the longer SMA, it is an indication of a potential buying opportunity. Conversely, when the shorter SMA crosses below the longer SMA, it signals a potential selling opportunity. The SMA Crossover Indicator is a versatile tool that can be used on any timeframe. Traders can adjust the length of the two SMAs to suit their trading style and timeframe. The indicator is available for free on the popular MT4 platform, and can be easily installed with just a few clicks. This indicator is free, easy to install, and can be used on any timeframe.
MT4


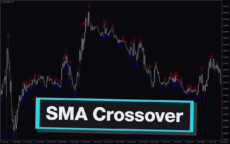
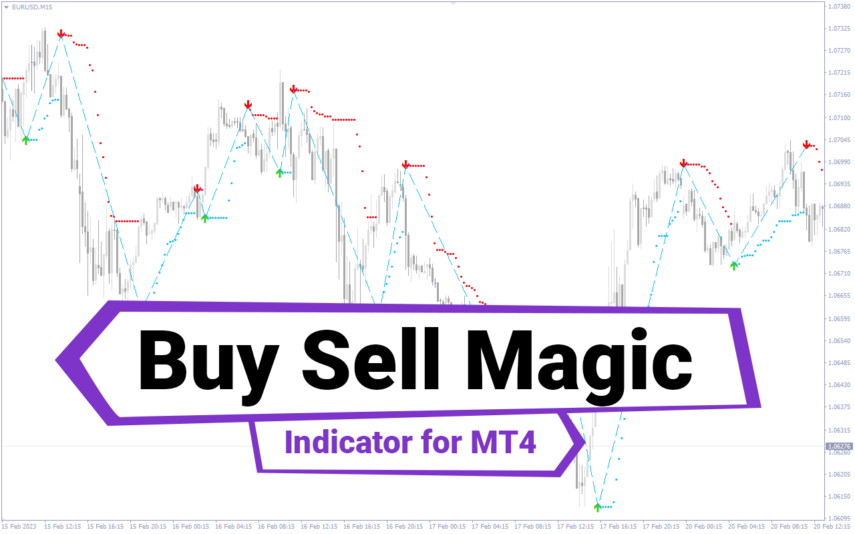
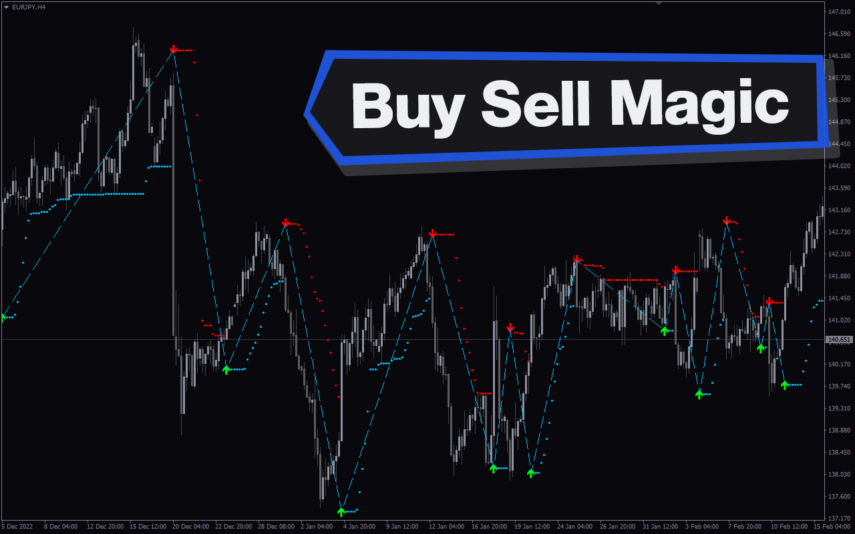
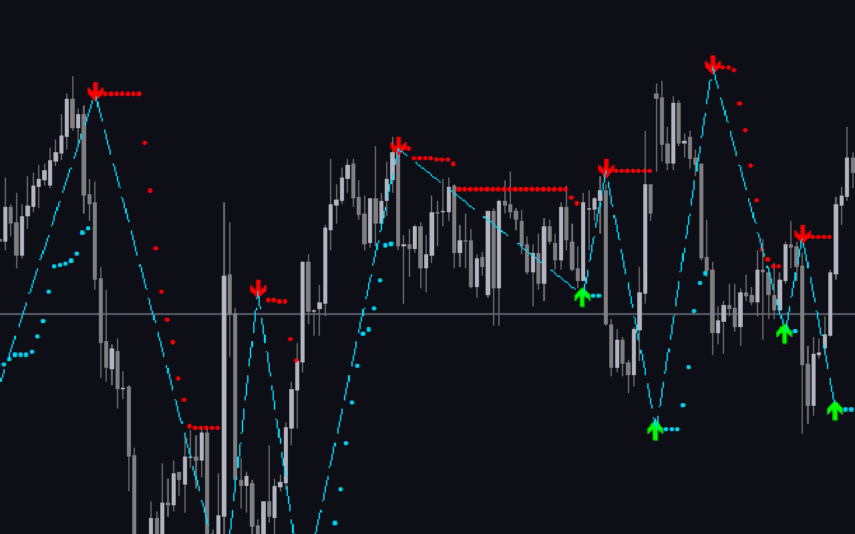
SMA Crossover
The SMA Crossover Indicator is a popular and free forex indicator for the MetaTrader 4 platform. The indicator works by plotting two simple moving averages (SMA) on the chart, one with a shorter time frame and one with a longer time frame. When the shorter time frame SMA crosses over the longer time frame SMA, this indicates a potential entry point in the market. The SMA Crossover Indicator is a great tool for traders looking for a simple yet effective way to identify potential entry and exit points in the market.
| Trading Style | |
|---|---|
| Indicator Type | |
| Timeframe | , |
| Platform |
0
People watching this product now!
Downloads - 40
Description
Reviews (0)
How to Install
Related products
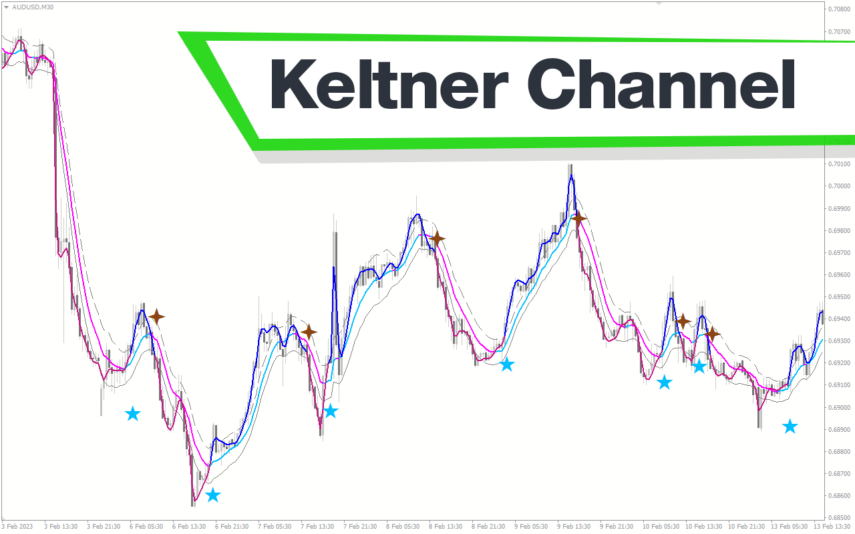
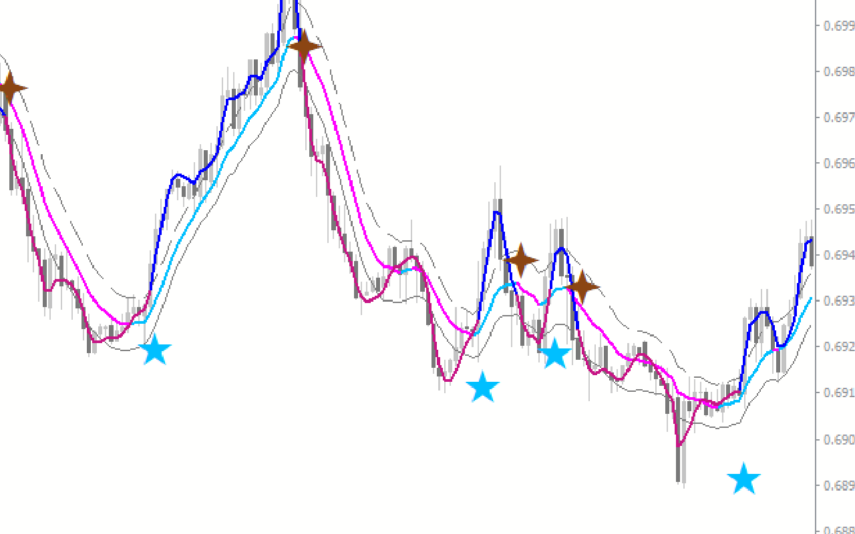
Keltner Channel With Signals
The Keltner Channel with Signals Indicator is a popular and free forex indicator that runs on the MT4 platform. This is a new and innovative tool that uses the Keltner Channel as the basis for generating trading signals, helping traders identify potential trading opportunities. Use the Keltner Channel with Signals Indicator as a powerful tool that can help traders succeed in the forex market.
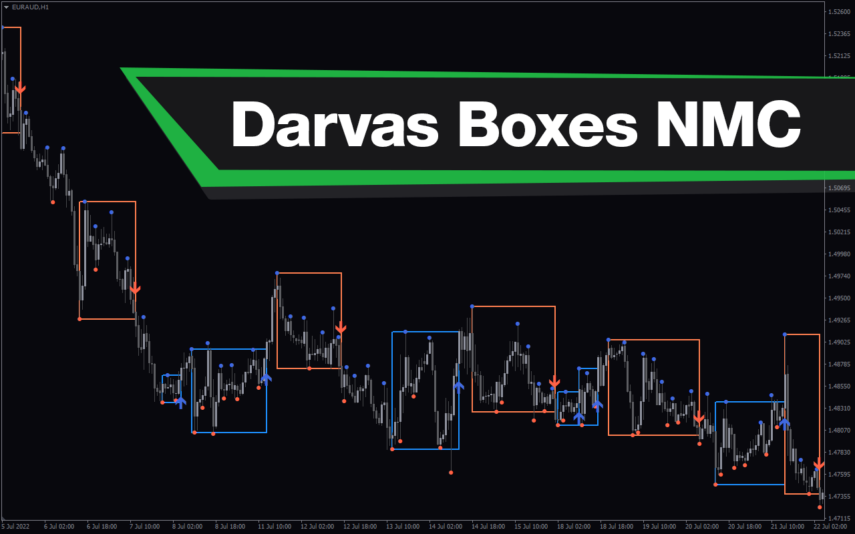
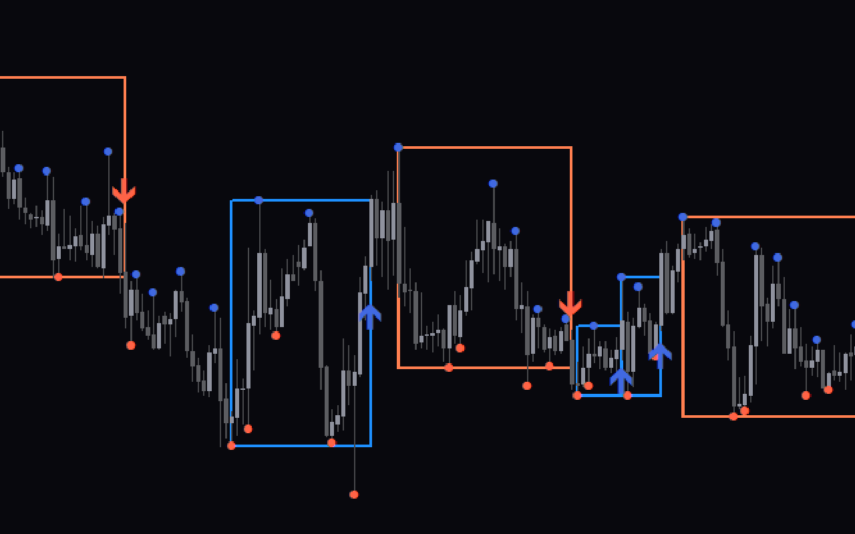
Darvas Boxes nmc
The Darvas Boxes NMC Indicator is a nice and free Forex trading tool available for MT4 platforms. It is based on the Darvas box trading method, which involves identifying trends through the creation of boxes on a price chart. The indicator helps traders visualize key support and resistance levels and potential trend reversals. The Darvas Boxes NMC Indicator provides clear buy and sell signals through color changes and arrows, allowing traders to make informed trading decisions. Its user-friendly interface and customizable settings make it suitable for both novice and experienced traders.
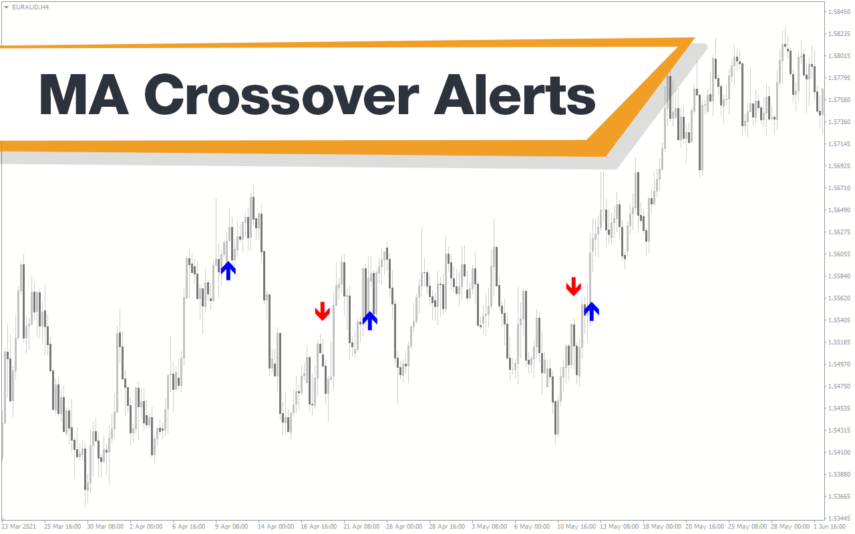
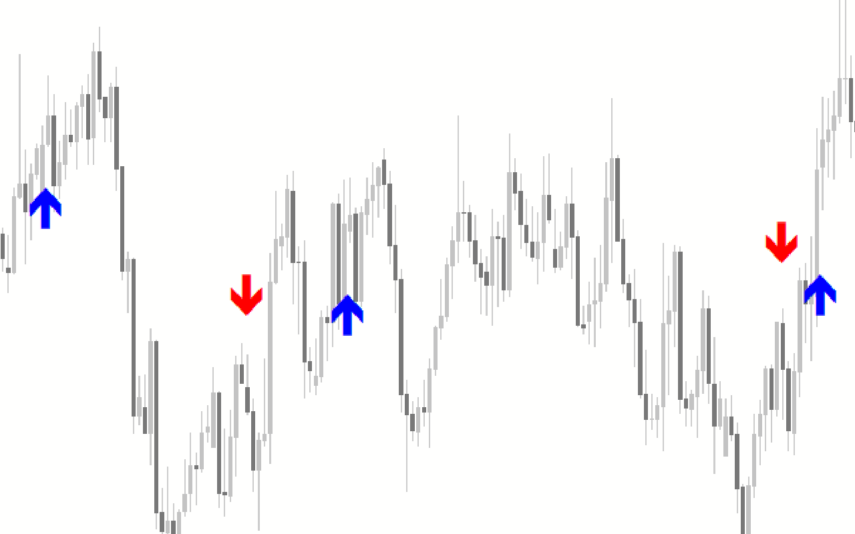
MA Crossover Alerts
The MA Crossover Alerts Indicator is a popular and free forex indicator that signals potential trend changes by identifying when two moving averages cross each other. Indicator will generate an alert or notification to indicate that a potential trend reversal is imminent. It is easy to install and use, making it an excellent choice for both novice and experienced traders.
Super Arrow
The Super Arrow Indicator is a forex tool for MT4 that generates high-probability trading signals by using multiple indicators such as Moving Averages, Relative Strength Index, Bollinger Bands, and Magic Filter. It filters out false signals and provides good trade signals by combining these indicators.
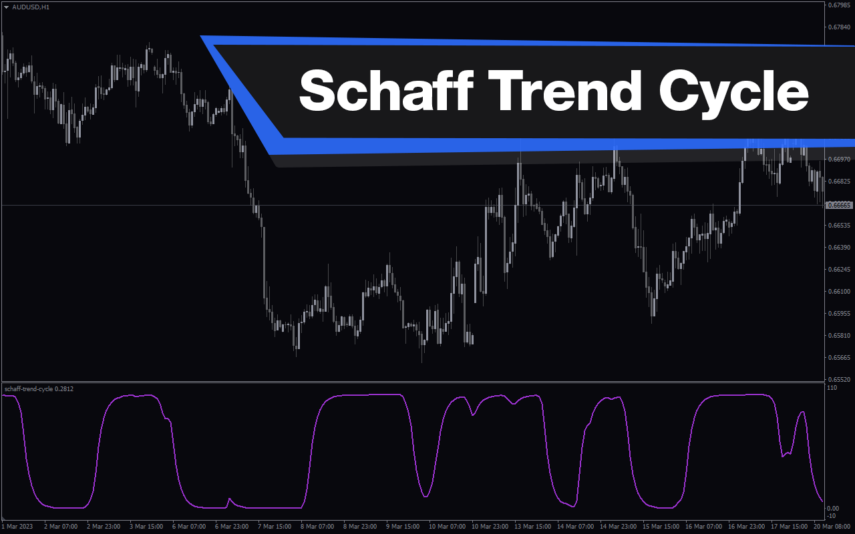
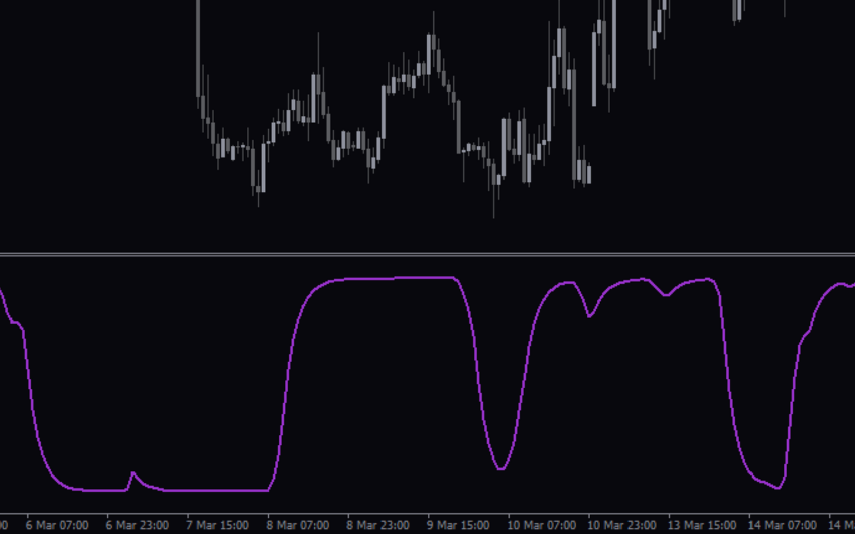
Schaff Trend Cycle
The Schaff Trend Cycle indicator is a popular forex indicator for MT4, which determines market trends with high accuracy. Its values range from 0 to 100, with values above 75 indicating overbought and values below 25 indicating oversold. Whether you are a beginner or an experienced trader, the Schaff Trend Cycle indicator will help you make better trading decisions and improve profitability.
Reviews
There are no reviews yet.