
The Second Chart Indicator is a useful and popular free Forex indicator for the MT4 platform. It is designed to help traders identify trends and make more accurate trading decisions. The indicator works by drawing two charts on the same timeframe. The first chart shows the price action for the current period, while the second chart shows the price action for the previous period. This allows traders to quickly compare the current price action to the previous price action. This can be used to identify trends and make more informed trading decisions. The Second Chart Indicator is easy to use and can be implemented in a variety of ways. It can be used to identify trends in the market, as well as to identify potential entry and exit points. Traders can also use the indicator to identify support and resistance levels. Additionally, the indicator can be used to identify potential reversals in the market. The Second Chart Indicator is a popular and useful tool for traders of all experience levels. It is easy to use and can be implemented quickly. Additionally, it provides traders with valuable insight into the market and can help them make more informed trading decisions. If you are looking for a free and effective Forex indicator for the MT4 platform, then the Second Chart Indicator is a great choice.
MT4


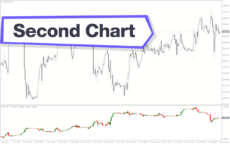
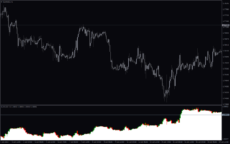
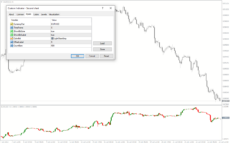
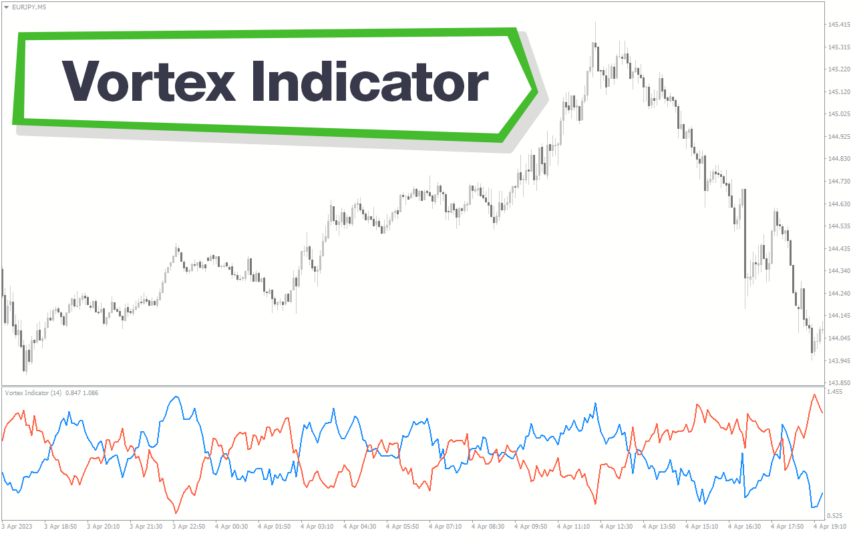
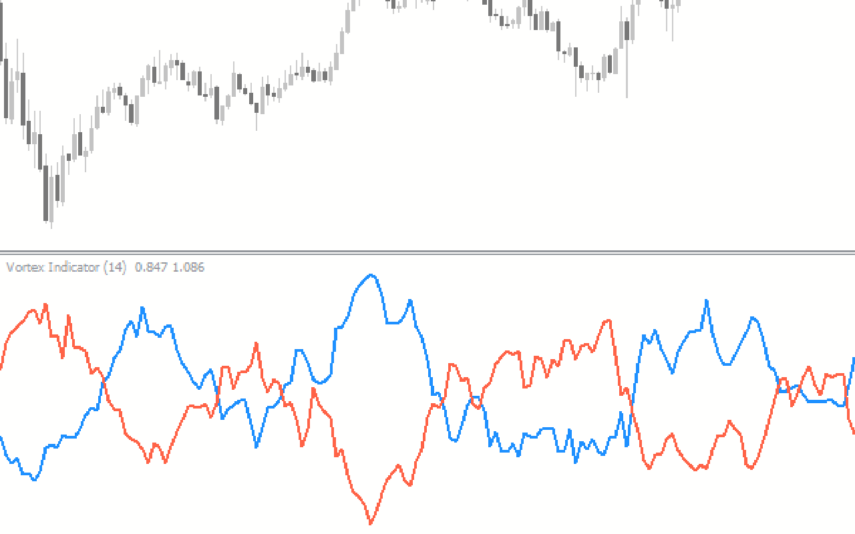
Second Chart
The Second Chart Indicator is a useful and popular Forex indicator that can be used with the MT4 platform. It is free to use and can provide traders with a great way to analyse the Forex markets. The indicator works by plotting a second chart on top of the main chart, allowing traders to view the same chart in two different ways. This can be useful for spotting trends, reversals, and other market movements. Overall, the Second Chart Indicator is a great tool for Forex traders of all levels and is a great way to gain an edge in the markets.
| Trading Style | |
|---|---|
| Indicator Type | , |
| Timeframe | |
| Platform |
0
People watching this product now!
Downloads - 71
Description
Reviews (0)
How to Install
Related products
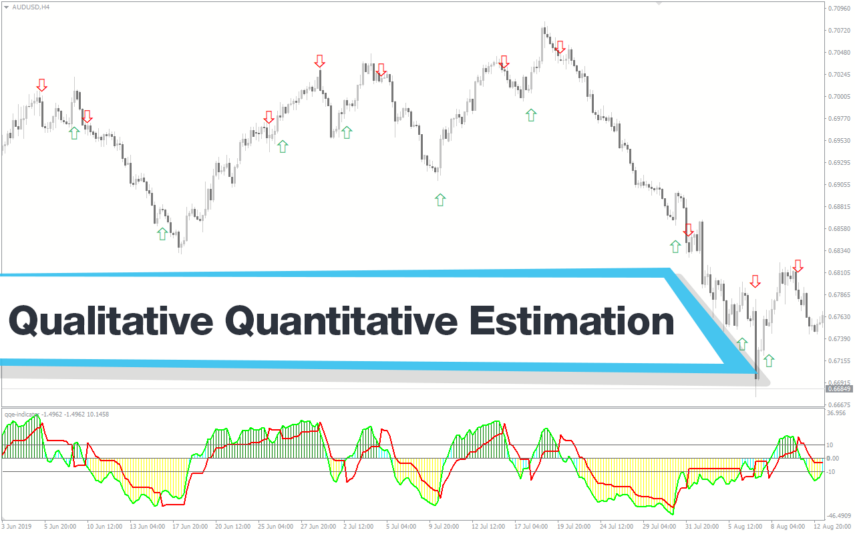
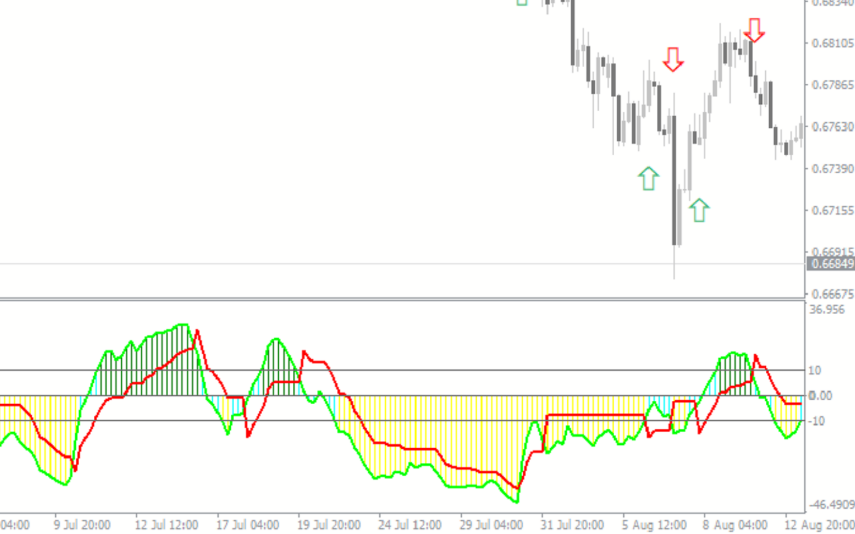
Qualitative Quantitative Estimation
The Qualitative Quantitative Estimation Indicator is a powerful tool for traders in the Forex market. It's a new and popular indicator that works with the MT4 platform. The QQE Indicator is used to determine market trends, identify overbought and oversold positions, and detect divergence in prices and momentum.
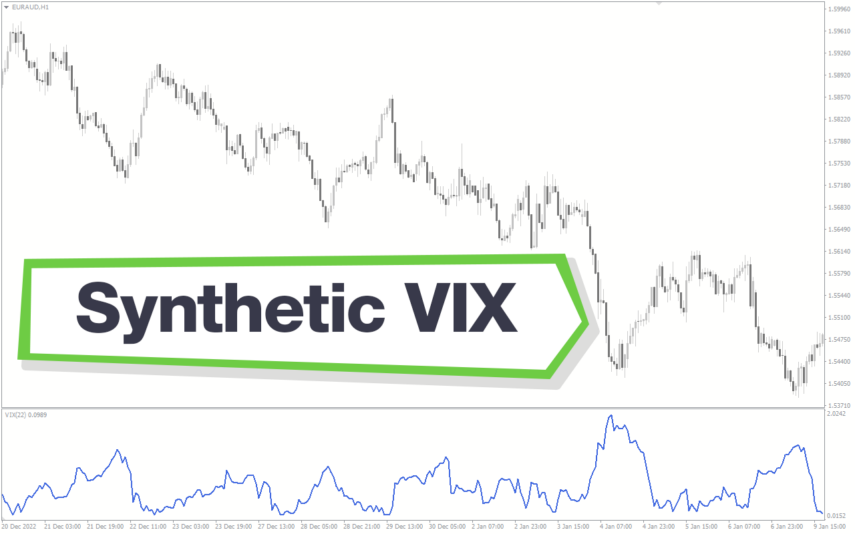
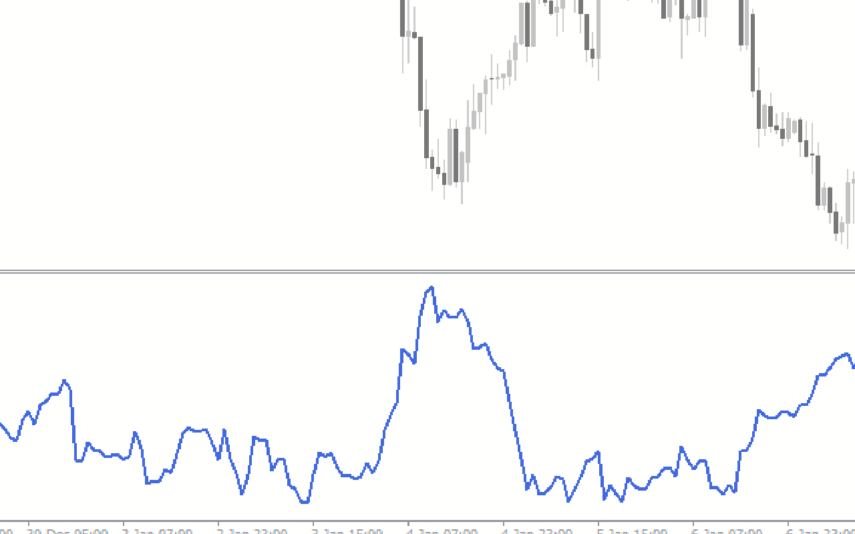
Synthetic VIX
The Synthetic VIX Indicator is a popular and free Forex indicator for the MT4 trading platform. The indicator utilizes a combination of price action and signals from multiple time frames to accurately predict market movements. The Synthetic VIX indicator can be used to identify potential entry and exit points in the market, as well as to identify trend reversals and breakouts. It is designed to provide traders with an easy to use and reliable indicator that can help them make informed trading decisions. With its accurate and reliable signals, the Synthetic VIX Indicator is a great tool for any trader looking to improve their trading performance.
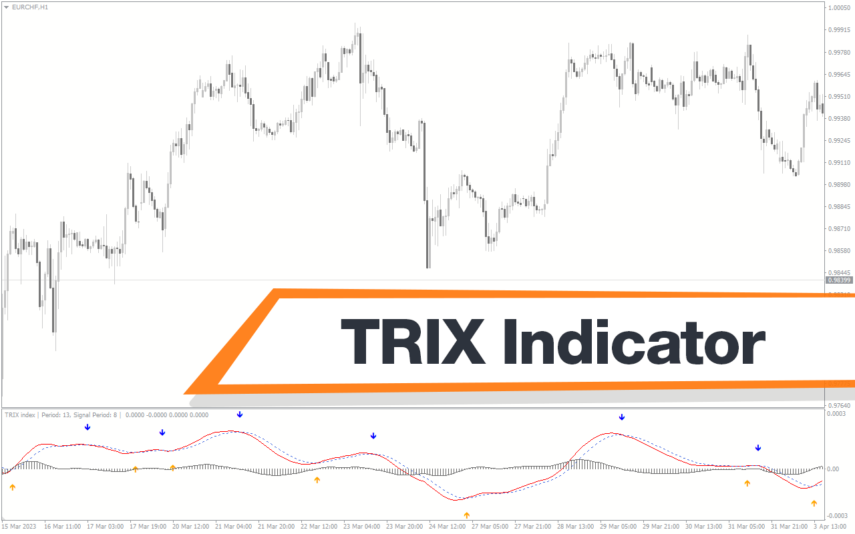
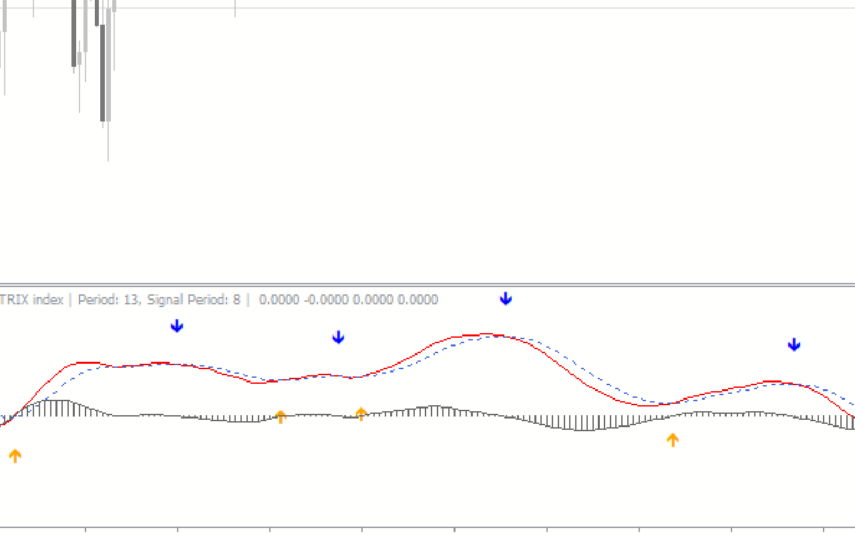
TRIX Indicator
The TRIX indicator is a new and popular technical analysis tool designed for the forex market wich available for free on the MT4 platform. TRIX uses triple exponential smoothing to identify trends and provide buy/sell signals based on crossovers and divergences. The indicator also helps traders identify overbought and oversold conditions, which can be used to make informed trading decisions. With its accuracy and simplicity, the TRIX indicator is quickly gaining popularity among forex traders.
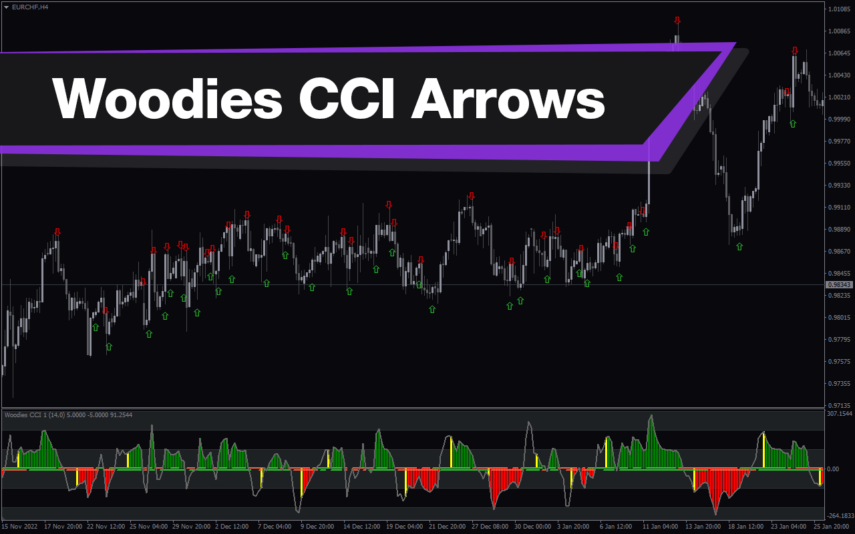
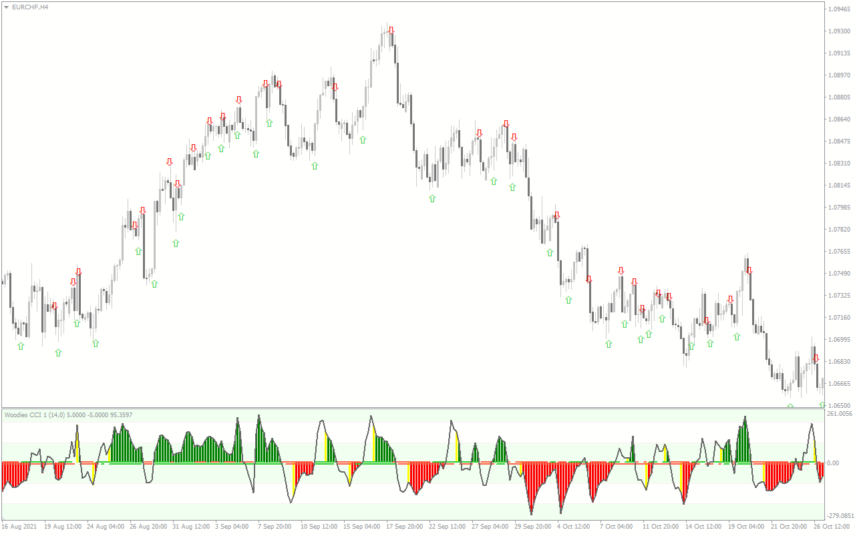
Woodies CCI Arrows Oscillator
The Woodies CCI Arrows Oscillator Indicator is a popular MT4 technical analysis tool used by forex traders to identify trends and potential entry and exit points wich based on the Woodies CCI system, which helps traders to identify when a trend is strong and when it may be weakening. The arrows on the indicator show when the price is moving in a particular direction, and the oscillator provides additional confirmation of the trend's strength. The Woodies CCI Arrows Oscillator Indicator is a valuable addition to any trader's toolkit, and it can help traders make better-informed trading decisions.
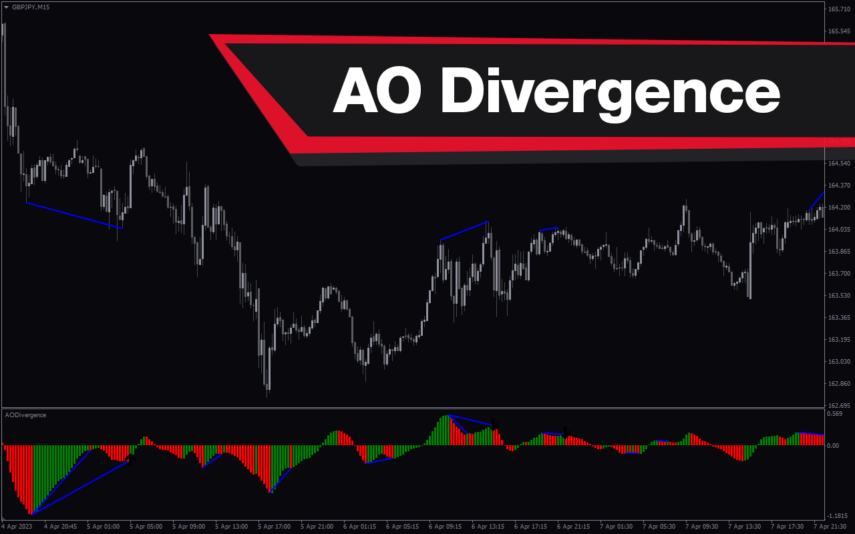
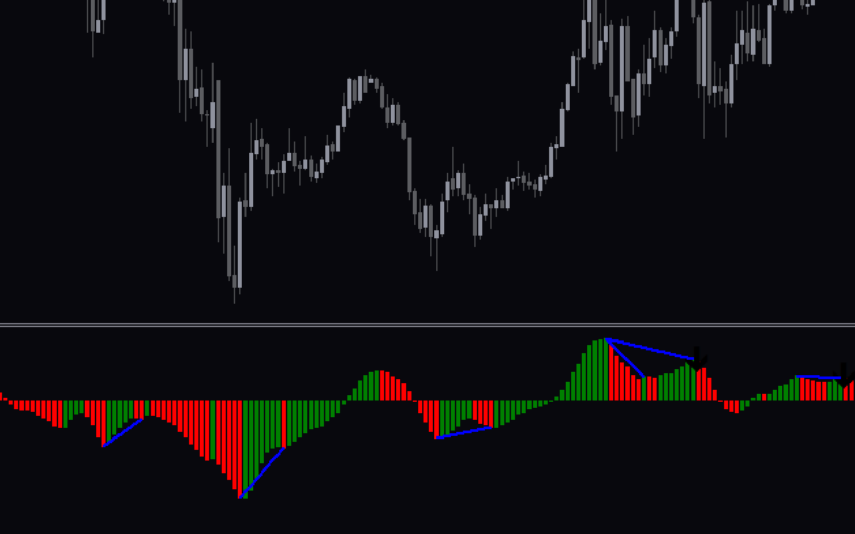
AO Divergence
The AO Divergence Indicator is a useful BE4 tool for forex traders who want to identify divergence patterns in the market. This new MT4 indicator is popular with traders due to its effectiveness in spotting divergence patterns and predicting potential price reversals. It works by analyzing the Awesome Oscillator (AO) and highlighting divergence patterns that may indicate possible trend changes. The AO Divergence Indicator is easy to use and can be a valuable addition to any trader's toolbox.
Reviews
There are no reviews yet.