

The Scalp Trend Sentry Indicator is a popular and useful forex indicator for MT4 that is available for free. This indicator is designed to help traders identify and follow trends in the forex market, making it easier to enter and exit trades at the right time. The Scalp Trend Sentry Indicator works by analyzing price action and generating buy and sell signals based on the trend direction. It is ideal for short-term traders looking to capitalize on small price movements in the market. To use the Scalp Trend Sentry Indicator, simply install it on your MT4 platform and apply it to your preferred currency pairs. The indicator will then display buy and sell signals on your charts, helping you make more informed trading decisions. Overall, the Scalp Trend Sentry Indicator is a valuable tool for forex traders looking to improve their trading strategies and maximize profits.

MT4


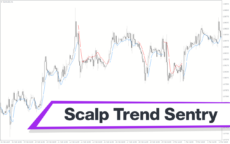
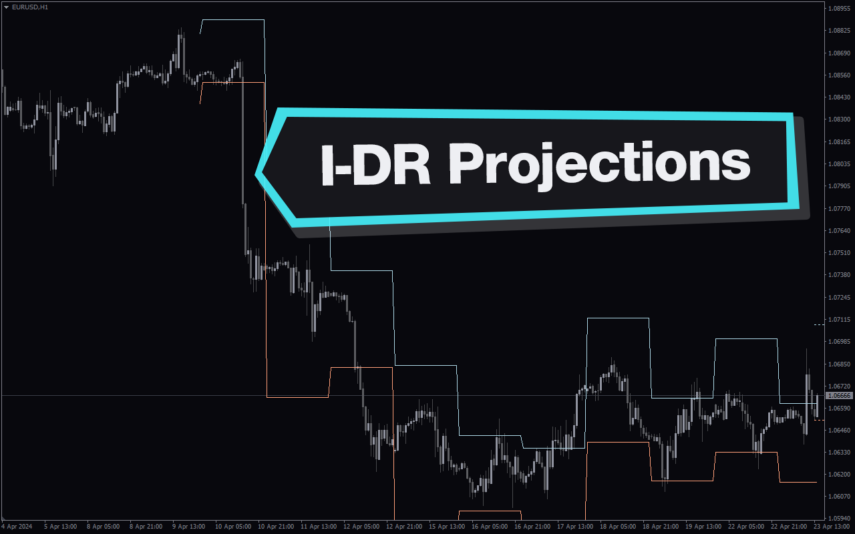
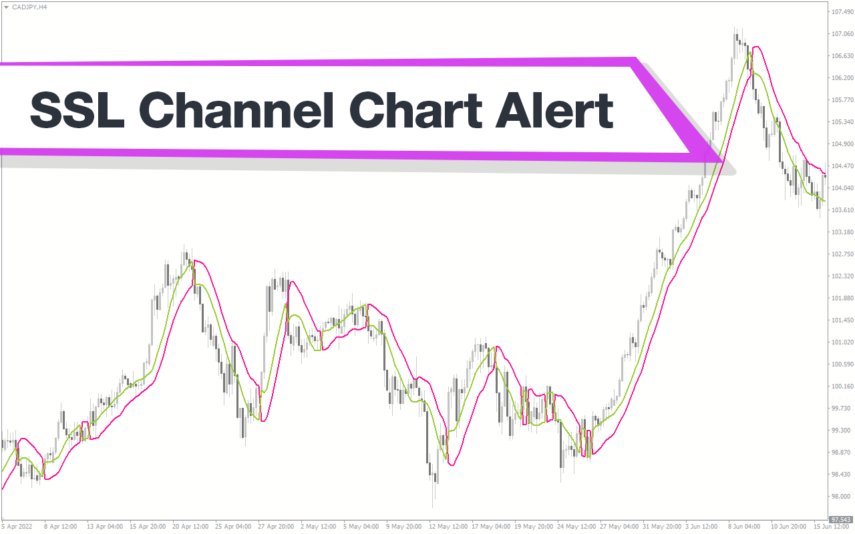
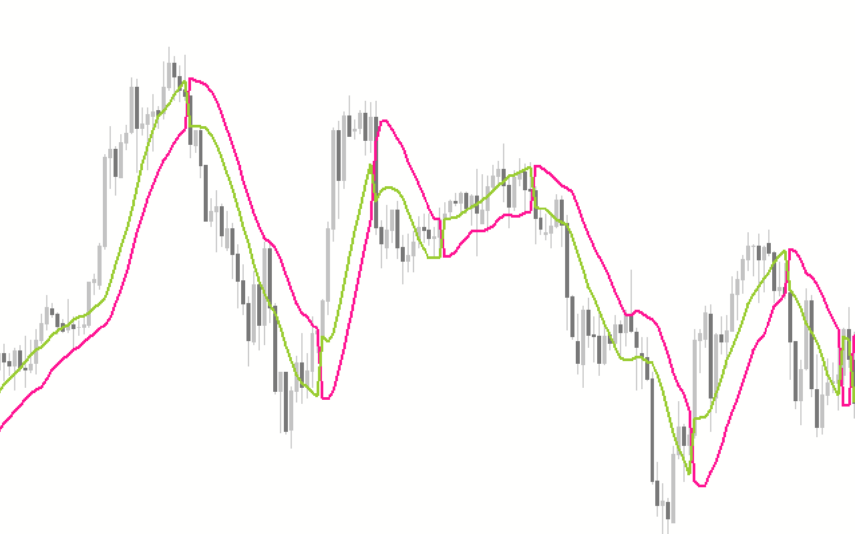
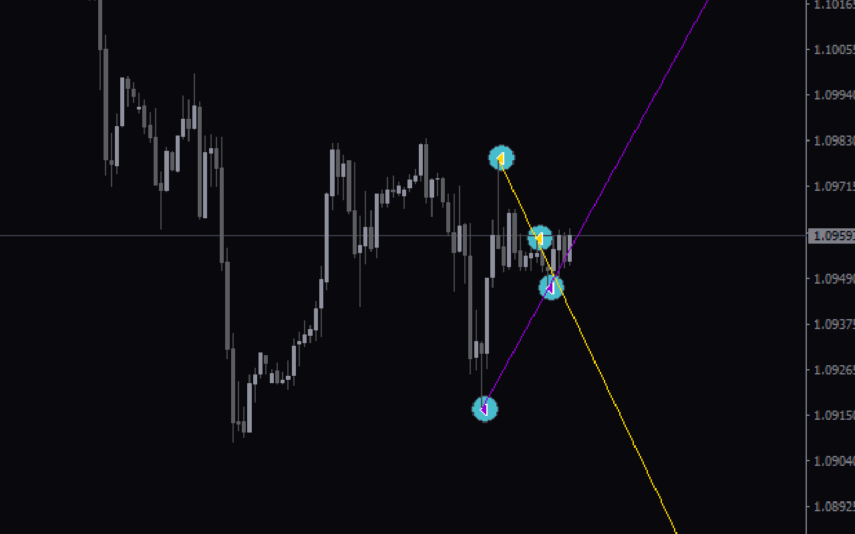
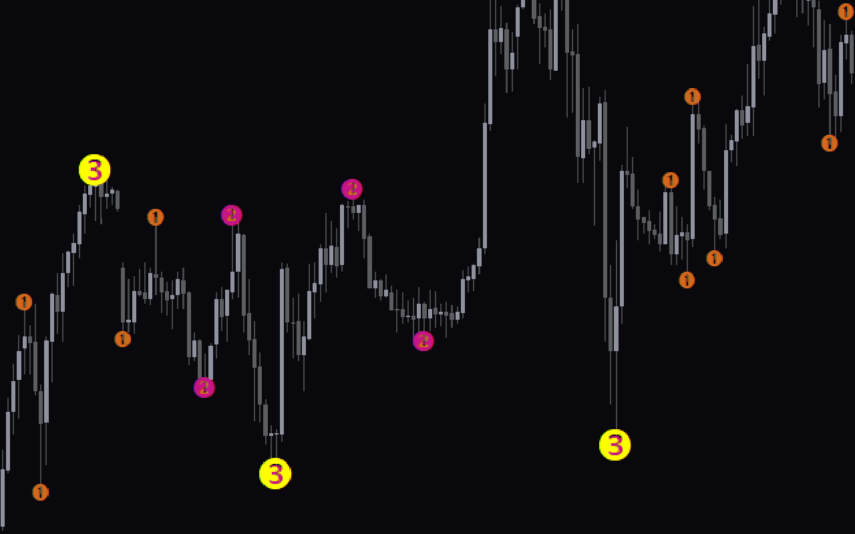
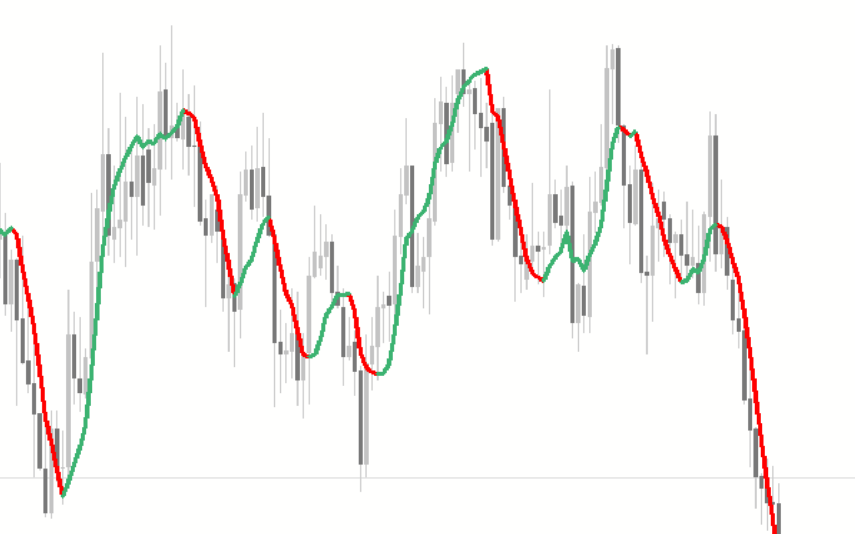
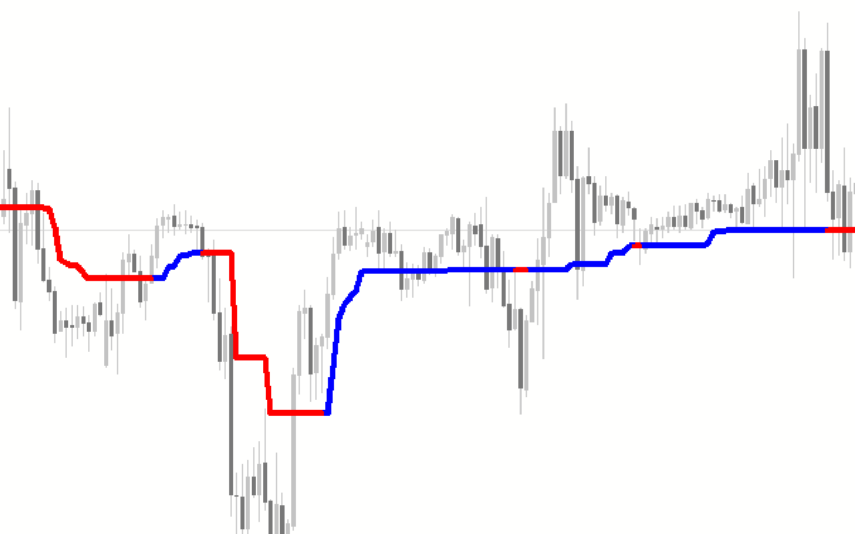
Scalp Trend Sentry
Scalp Trend Sentry indicator is a useful forex indicator for MT4 that is popular among traders for its accuracy in identifying trends. This free indicator works by analyzing market conditions and providing clear entry and exit signals for traders to follow. It is easy to use and can be a valuable tool for traders looking to scalp the forex markets efficiently.
| Indicator Type | |
|---|---|
| Trading Style | |
| Timeframe | , |
| Platform |
0
People watching this product now!
Downloads - 4
Description
Reviews (0)
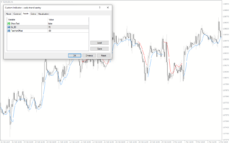
How to Install
Related products
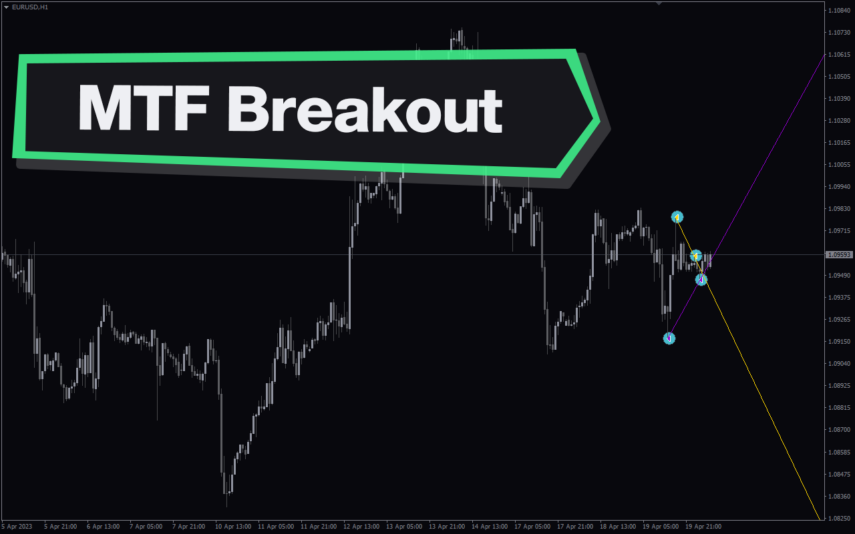
Multi Time Frame Breakout
The Multi-Time Frame Breakout indicator is a new and popular forex indicator that is available for free on the MT4 platform. This indicator helps traders identify breakout points by analyzing multiple timeframes at the same time. It works by plotting support and resistance levels based on the highest and lowest price levels over multiple time frames. This is a valuable tool for traders who use multiple timeframes in their analysis and want to improve their accuracy in identifying potential breakout points.
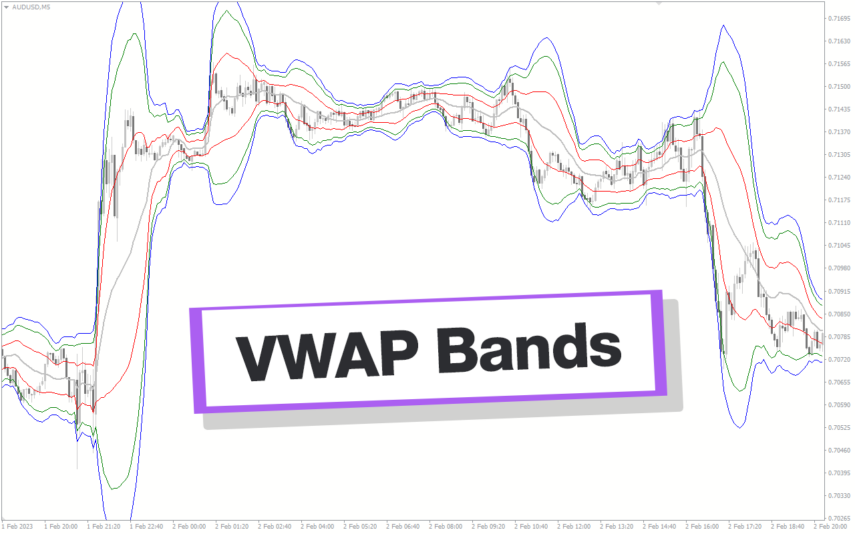
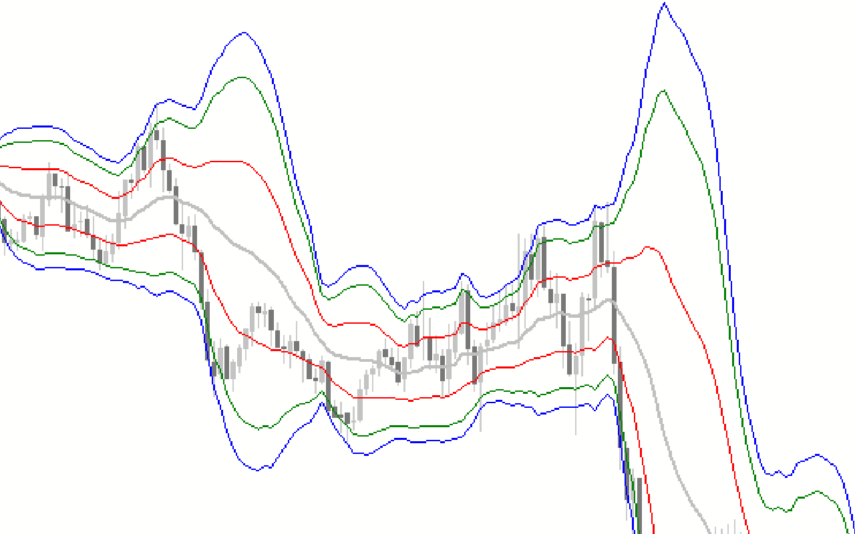
VWAP Bands
Discover the power of the VWAP Bands indicator, which emphasizes volume in its calculation. Gain insights into support and resistance levels, fair value, and trading opportunities. Suitable for all traders, this versatile Metatrader Indicator allows customization across various time frames with adjustable settings for better trading.
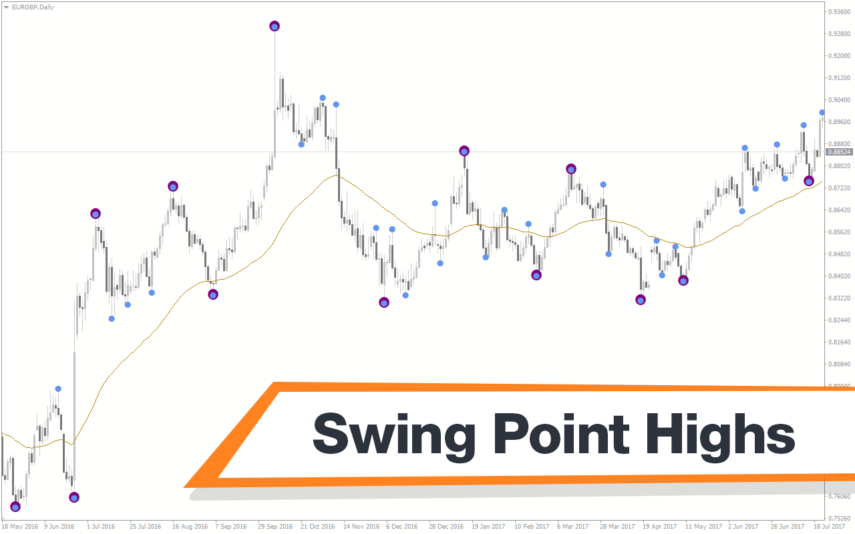
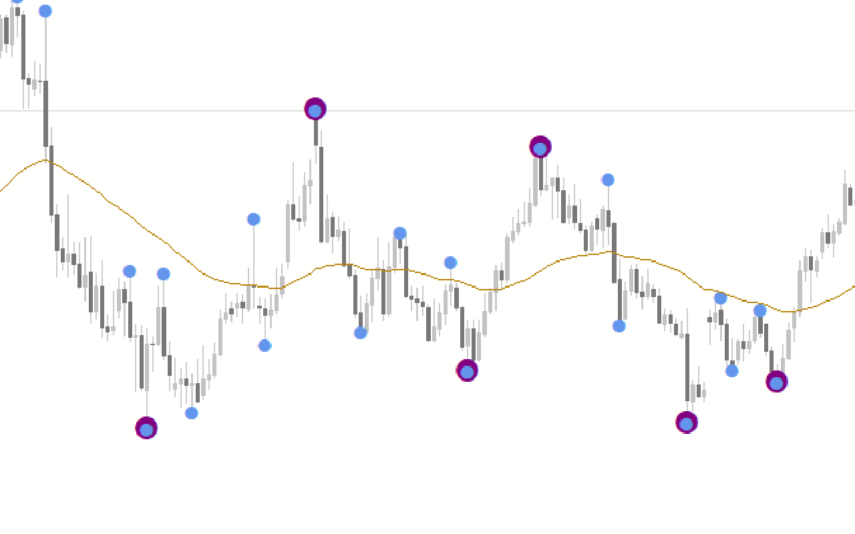
Swing Point Highs
The Swing Point Highs and Lows indicator is a new, popular and free MT4 technical analysis tool for forex traders. This indicator works by identifying swing points on a price chart and then drawing horizontal lines to indicate potential support and resistance levels. The swing point high and low indicator is a valuable tool for traders who want to identify key support and resistance levels and is suitable for both beginners and experienced traders.
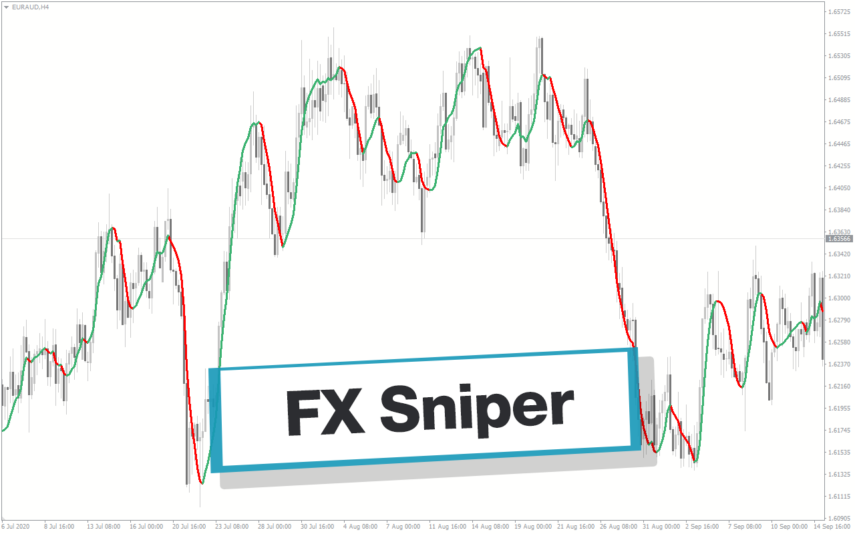
FX Sniper
The FX Sniper indicator is a new and popular forex indicator available for free on the MT4 platform. It uses advanced algorithms to identify trends and potential trading opportunities. The indicator is easy to use and gives clear signals on when to buy or sell based on market conditions. The FX Sniper indicator is suitable for traders of all levels, from beginners to experienced traders who want to improve their trading performance and profitability.
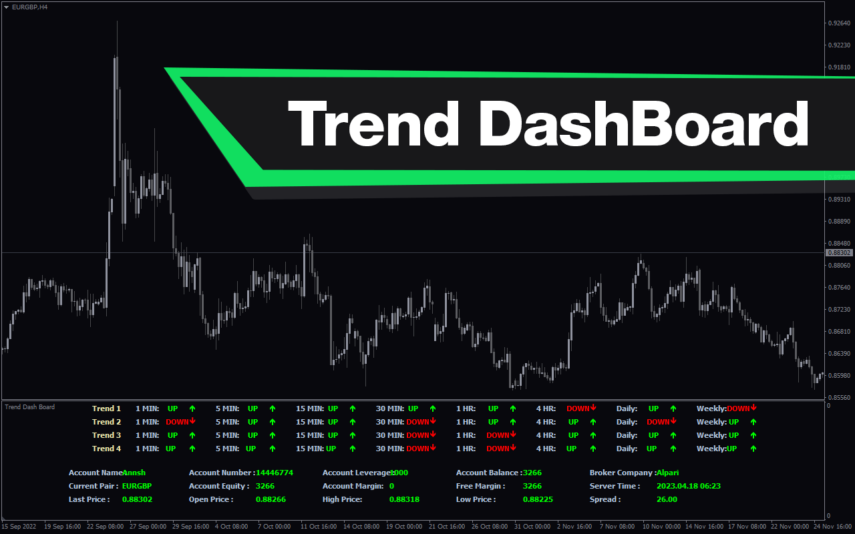
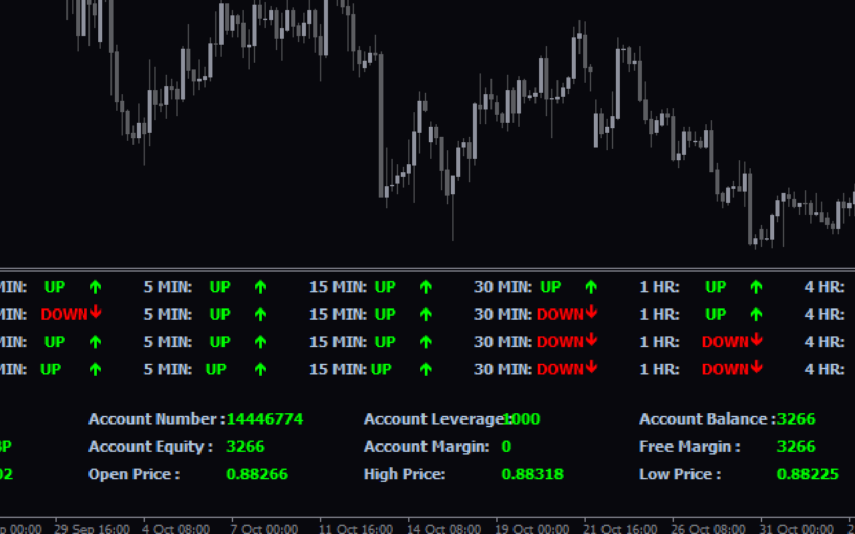
Trend DashBoard
The Trend Dashboard Indicator is a powerful MT4 tool for forex traders who want to keep track of multiple currency pairs and timeframes on one chart. The indicator uses a dashboard to display the trend direction and strength for different currency pairs and timeframes. It also includes an alert feature that can notify traders of potential trading opportunities. With this indicator, traders can save time and stay on top of market trends, allowing them to make informed trading decisions.
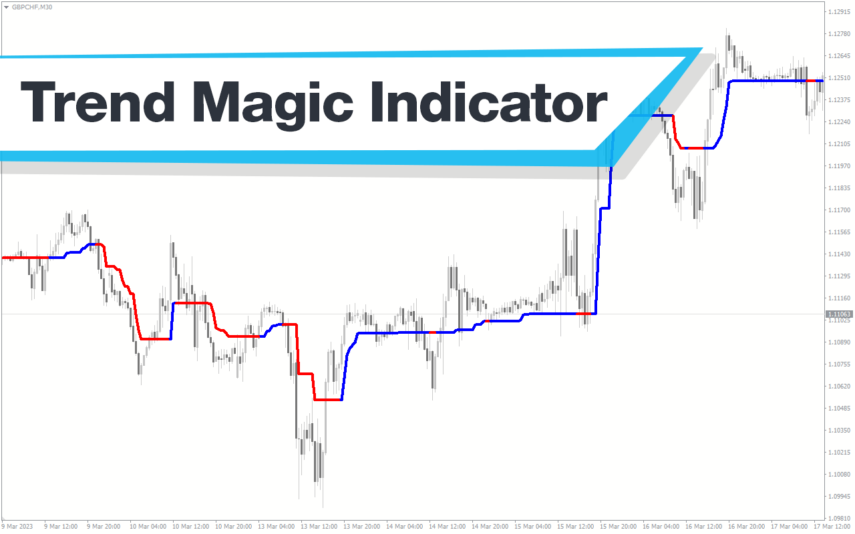
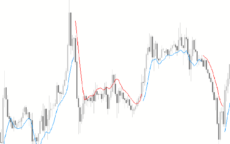
Trend Magic
The Trend Magic Indicator is a popular, free forex MT4 indicator that uses a combination of moving averages and filters to identify the trend direction and potential trade opportunities. The indicator appears as a line that changes color according to the current trend direction. The green color indicates a bullish trend, while the red color indicates a bearish trend. It is simple to use and can be a valuable tool for traders to identify potential entry and exit points in the market.

Reviews
There are no reviews yet.