
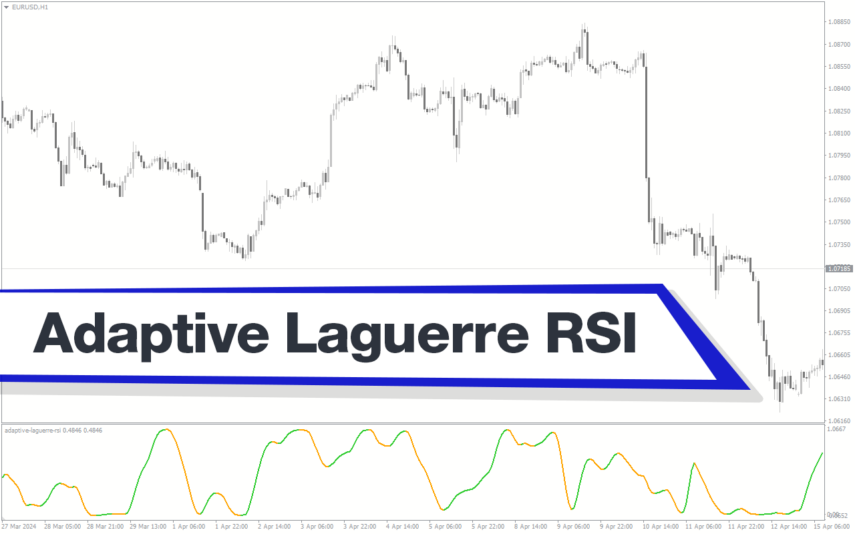
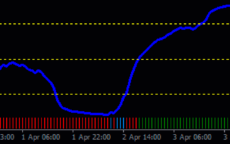
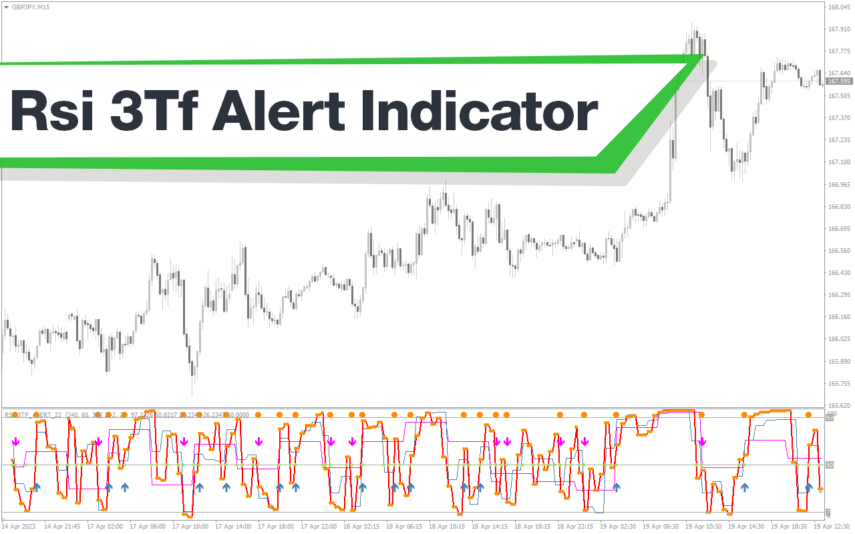
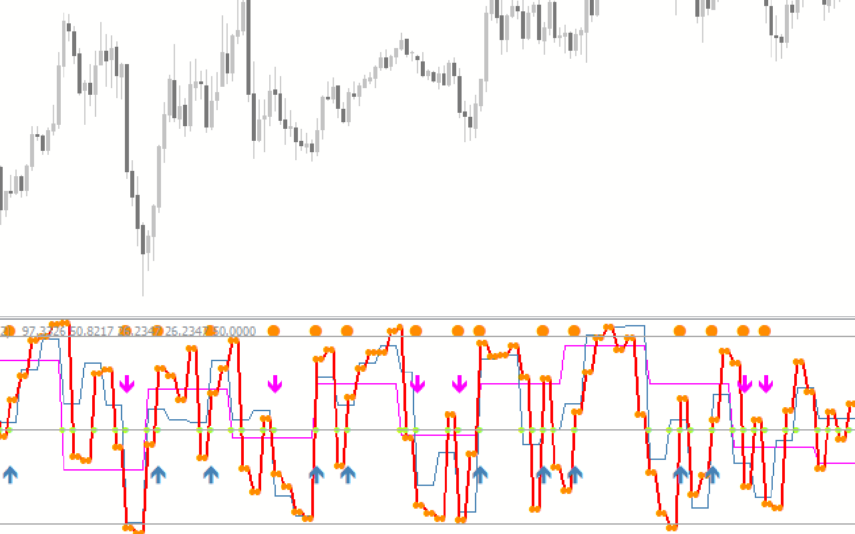
The RSIOMA indicator is a useful Forex indicator for MT4 that combines two popular indicators, the RSI (Relative Strength Index) and the Moving Average (MA). It is commonly used by traders to identify overbought or oversold conditions in the market. The RSIOMA indicator works by measuring the strength of a currency pair’s price movement relative to its recent performance. It then uses a combination of the RSI and MA to generate buy or sell signals. When the RSIOMA line crosses above the signal line, it indicates a potential buy signal, while a cross below the signal line suggests a sell signal. This indicator is free to use and can be easily added to your MT4 platform. By using the RSIOMA indicator, traders can make more informed decisions and potentially improve their trading performance in the Forex market.
MT4


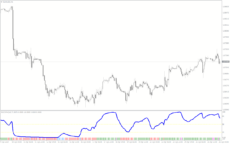
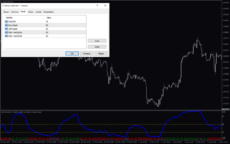
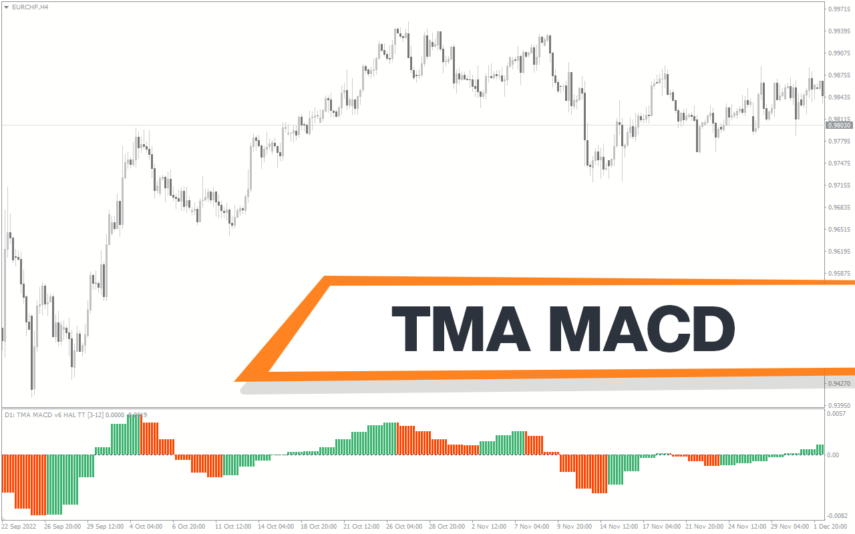
Rsioma
RSIOMA Indicator is a popular and useful forex indicator for MT4, available for free. It combines RSI (Relative Strength Index) and Moving Average to identify trends and possible reversals in the market. Traders can use it to gauge overbought and oversold conditions, as well as divergence signals. It is a versatile tool for technical analysis in forex trading.
| Indicator Type | |
|---|---|
| Trading Style | , |
| Timeframe | , |
| Platform |
0
People watching this product now!
Downloads -
Description
Reviews (0)
How to Install
Related products
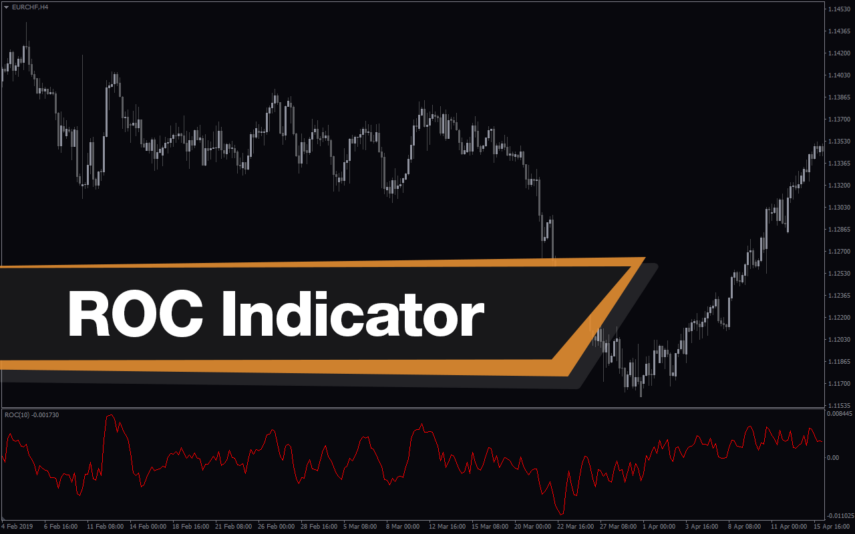
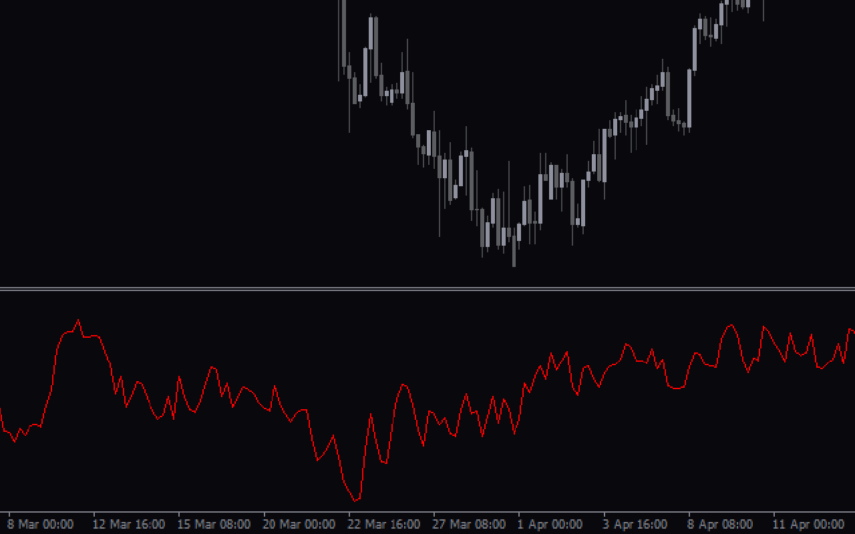
ROC Indicator
The ROC Indicator is a popular and useful Forex indicator for MT4 that is free to download. It is used to measure the rate of change in price movements over a given time period. The indicator is useful for traders as it can help identify when a price is overbought or oversold, and when a trend is reversing. The ROC Indicator is a popular and useful tool for traders who want to make informed decisions about their trading strategies.
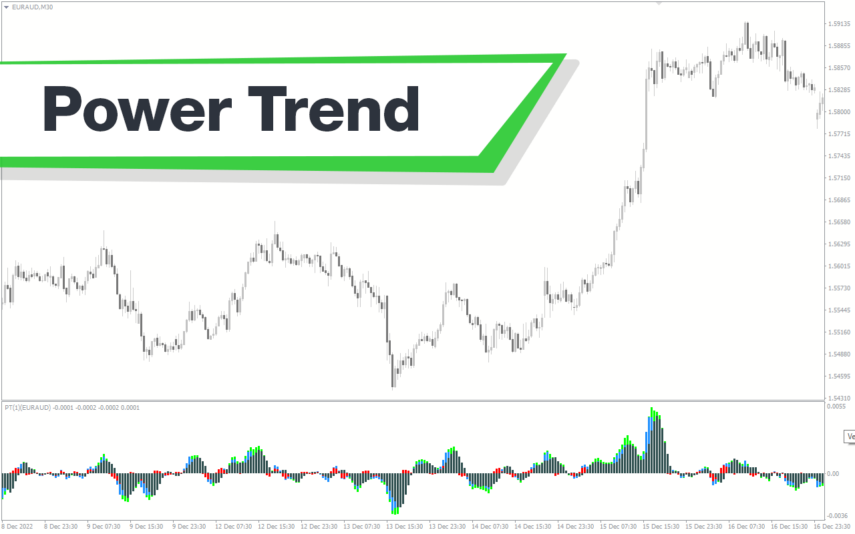
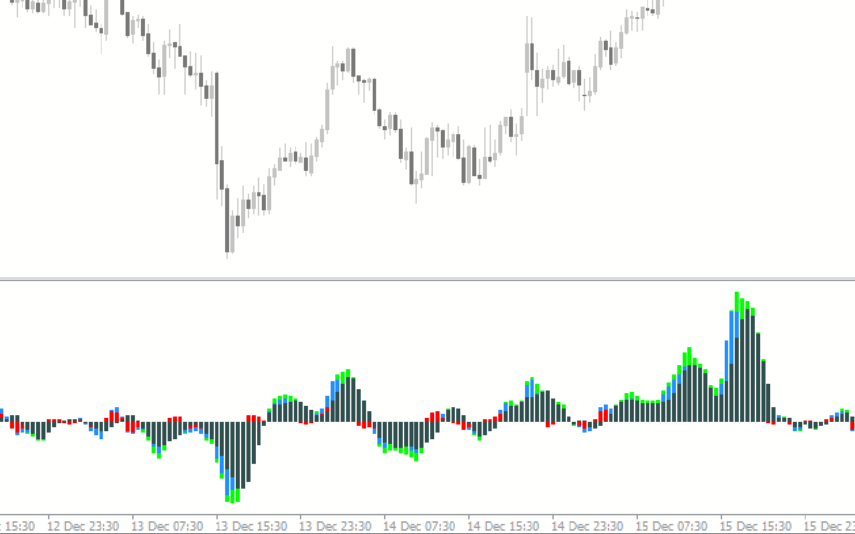
Power Trend
The Power Trend indicator for MT4 is a new and free popular forex technical analysis tool that helps traders identify trends, their direction, and strength visually in different colors. The colored histogram of the Power Trend indicator helps traders plan their trading strategies by providing insights into the trend's strength and maturity level. The indicator changes color to indicate weak or strong trends, allowing traders to maximize their profits and exit the trade at the right time. Download the Power Trend indicator for free and enhance your trading experience.
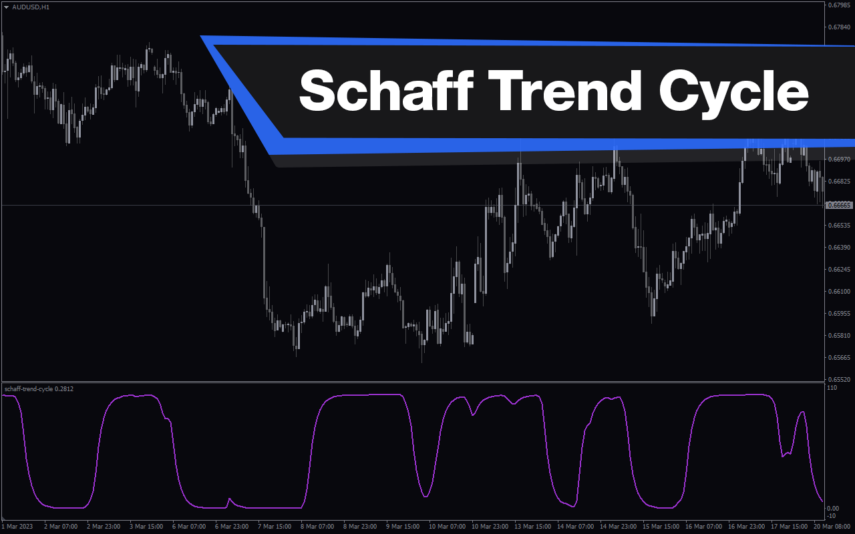
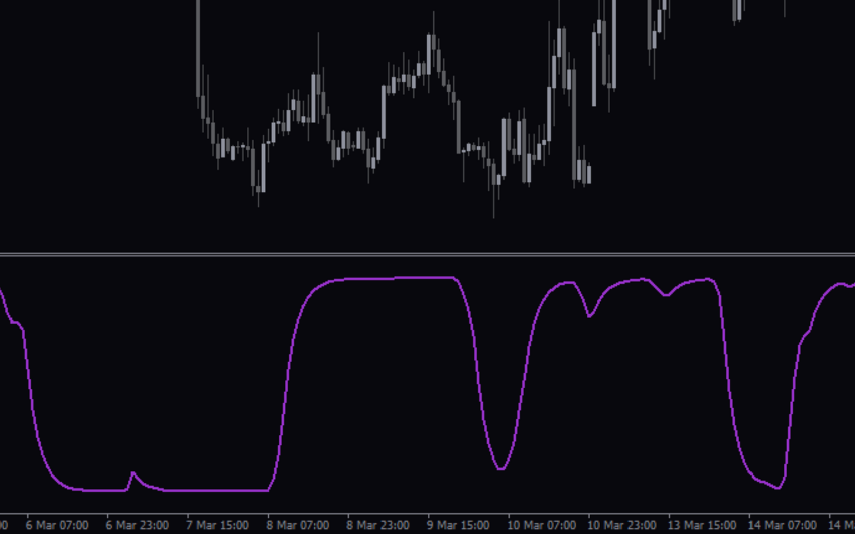
Schaff Trend Cycle
The Schaff Trend Cycle indicator is a popular forex indicator for MT4, which determines market trends with high accuracy. Its values range from 0 to 100, with values above 75 indicating overbought and values below 25 indicating oversold. Whether you are a beginner or an experienced trader, the Schaff Trend Cycle indicator will help you make better trading decisions and improve profitability.
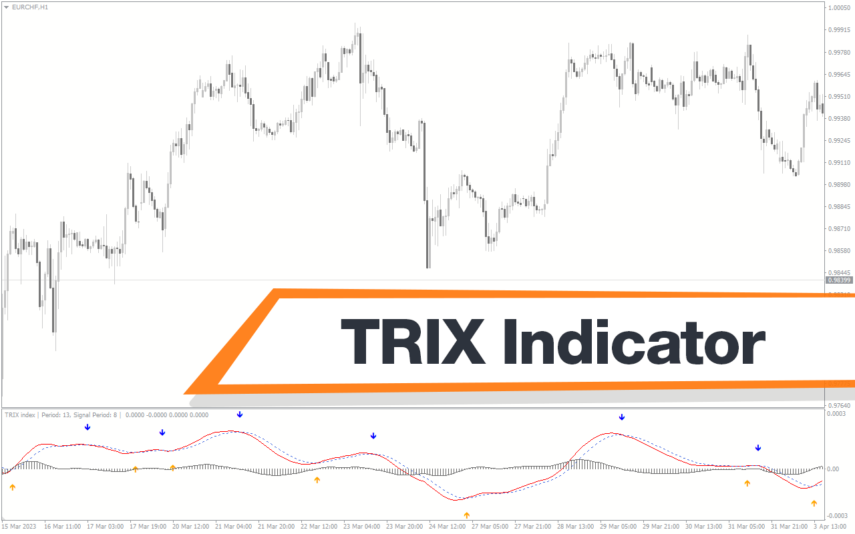
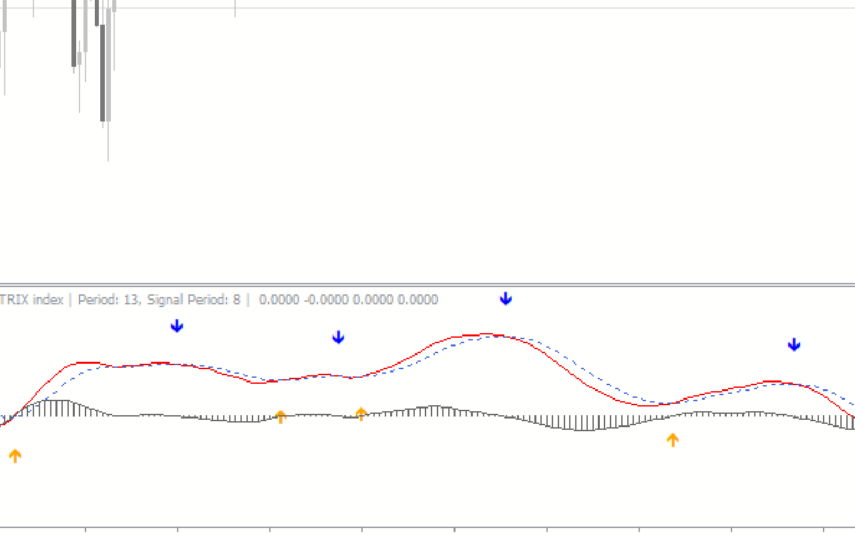
TRIX Indicator
The TRIX indicator is a new and popular technical analysis tool designed for the forex market wich available for free on the MT4 platform. TRIX uses triple exponential smoothing to identify trends and provide buy/sell signals based on crossovers and divergences. The indicator also helps traders identify overbought and oversold conditions, which can be used to make informed trading decisions. With its accuracy and simplicity, the TRIX indicator is quickly gaining popularity among forex traders.
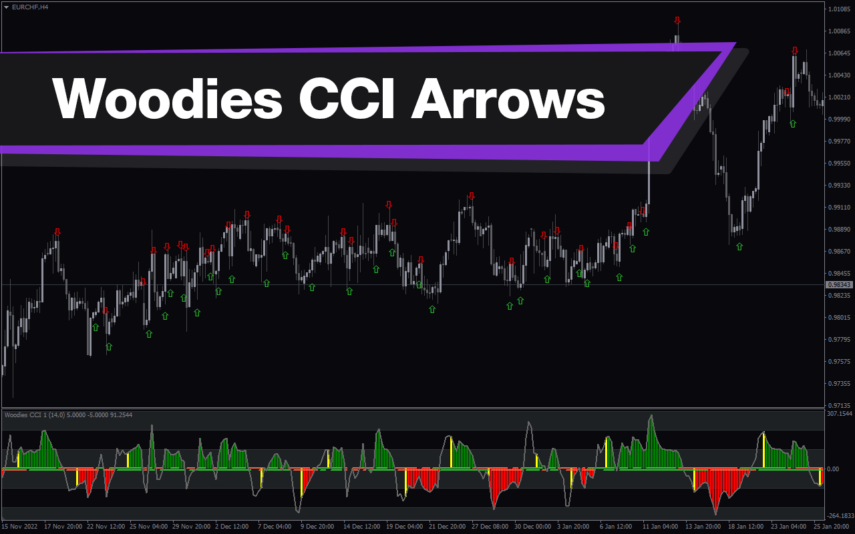
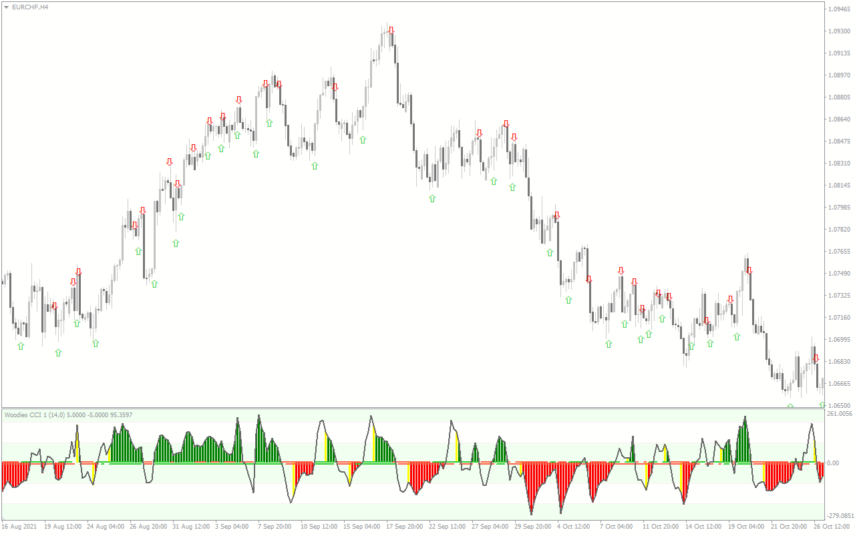
Woodies CCI Arrows Oscillator
The Woodies CCI Arrows Oscillator Indicator is a popular MT4 technical analysis tool used by forex traders to identify trends and potential entry and exit points wich based on the Woodies CCI system, which helps traders to identify when a trend is strong and when it may be weakening. The arrows on the indicator show when the price is moving in a particular direction, and the oscillator provides additional confirmation of the trend's strength. The Woodies CCI Arrows Oscillator Indicator is a valuable addition to any trader's toolkit, and it can help traders make better-informed trading decisions.
Reviews
There are no reviews yet.