
The RSI Candles Indicator for MT4 is a popular and free forex indicator that is useful for analyzing market trends. This technical indicator helps traders to identify overbought or oversold conditions in the market. The indicator is based on the Relative Strength Index (RSI) which is a momentum oscillator. It is designed to measure the speed and change of price movements. The indicator plots a series of green and red candles on a chart, each candle representing the RSI value at a certain time. When the RSI value is above 70, the candle is colored green, indicating that the market is overbought. Conversely, when the RSI value is below 30, the candle is colored red, indicating that the market is oversold. By using the RSI Candles Indicator, traders can identify potential entry and exit points in the market. The indicator is easy to use and can be used in combination with other technical indicators to gain a better understanding of the market. The indicator is available for free and can be downloaded from many online sources. It is a great tool for traders looking to analyze market trends and make informed trading decisions.

MT4


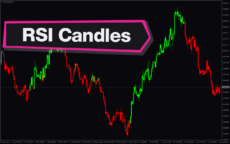
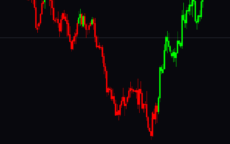
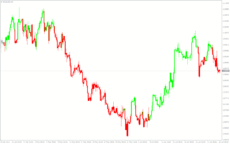
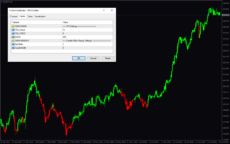
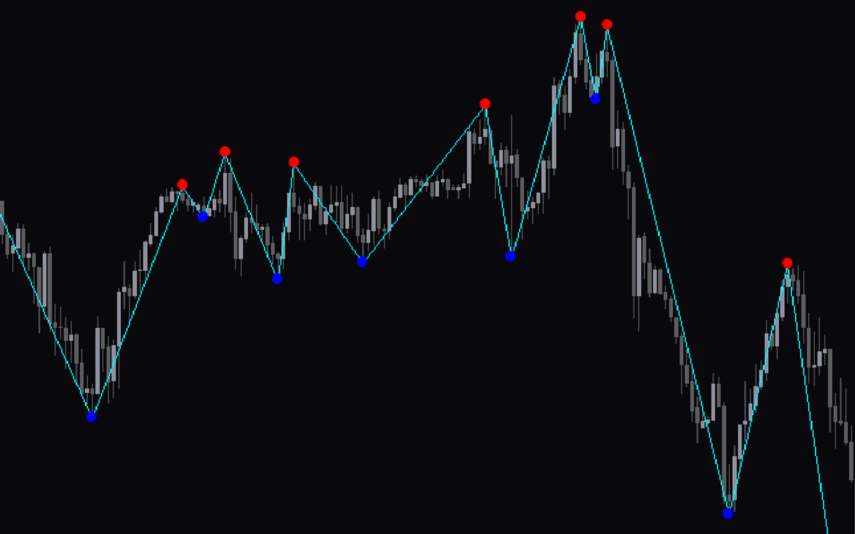
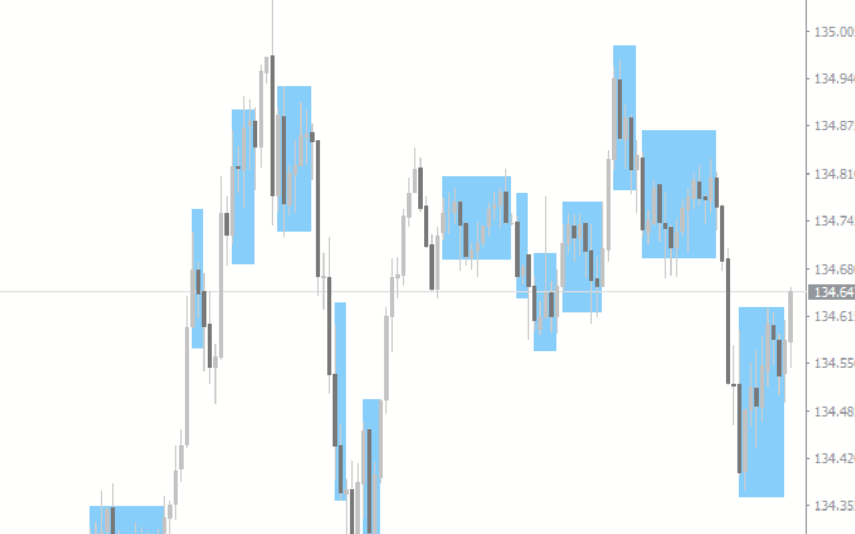
RSI Candles
The RSI Candles Indicator is a useful and popular free MT4 Forex indicator. The indicator works by plotting a blue or red candle on the chart depending on the Relative Strength Index (RSI) values. If the RSI values are over 70, a red candle is plotted. If the RSI values are below 30, a blue candle is plotted. The RSI Candles Indicator is a great tool for any trader looking for an effective and free way to analyze the market.
| Indicator Type | |
|---|---|
| Timeframe | |
| Platform | |
| Trading Style |
0
People watching this product now!
Downloads - 58
Description
Reviews (0)
How to Install
Related products
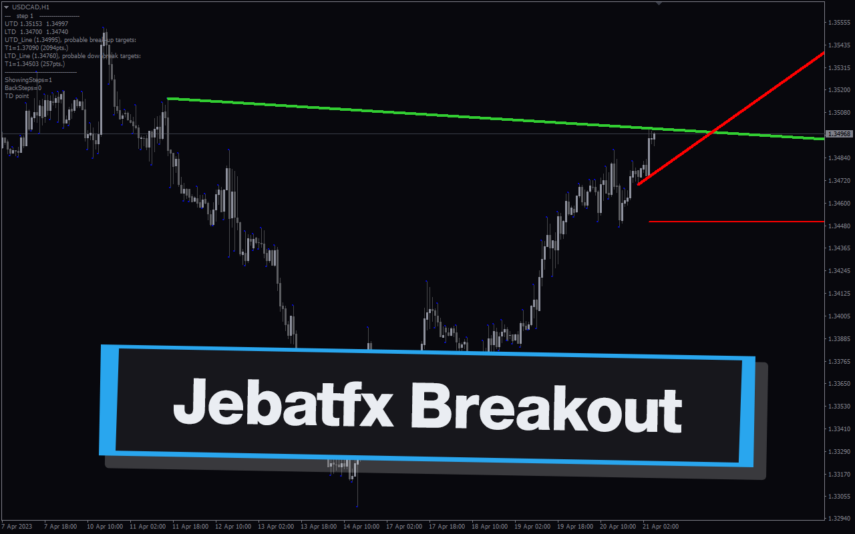
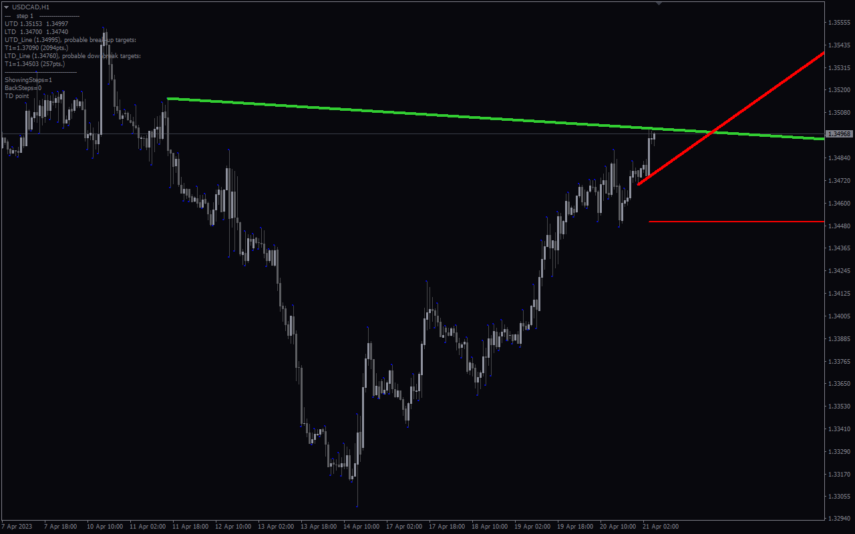
Jebatfx Breakout Trendline
The JebatFX Breakout Trendline Indicator is a new and popular forex indicator available for free on the MT4 platform. It is designed to identify breakout trendline opportunities by plotting trendlines and highlighting breakout signals. The indicator uses complex algorithms to analyze price movements and identify key support and resistance levels to generate trading signals. The JebatFX Breakout Trendline Indicator is user-friendly and easy to use, making it suitable for both novice and experienced traders.
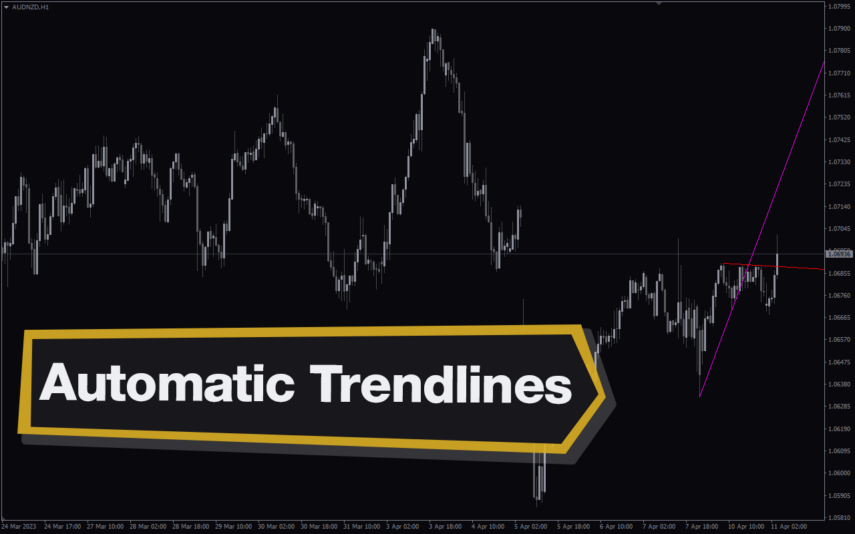

Automatic Trendlines
The Automatic Trendlines indicator is a new and popular free to use MT4 indicator designed to automatically draw trendlines on your chart, saving you time and effort. The indicator uses advanced algorithms to determine trendlines based on price movement and can be used on any currency pair or timeframe. The Automatic Trendlines indicator is a useful tool for traders who want to quickly and easily identify trends in their charts.

Reviews
There are no reviews yet.