
The RSI Bands Indicator is a useful tool for Forex traders that can be used to identify potential trading opportunities. It is a popular indicator among traders due to its ability to provide signals that can help traders make profitable trades. The RSI Bands Indicator is available for free on the MetaTrader 4 (MT4) platform. The RSI Bands Indicator is based on the Relative Strength Index (RSI) indicator. The RSI is a momentum indicator that measures the magnitude of recent price changes to evaluate overbought or oversold conditions in the price of a security. The RSI Bands Indicator takes the RSI and plots upper and lower bands around it. These bands are used to identify areas of potential support and resistance. When the price of a security reaches the upper band, it is considered overbought and a potential sell signal. Conversely, when the price reaches the lower band, it is considered oversold and a potential buy signal. The RSI Bands Indicator is easy to use and can help traders identify potential trading opportunities in the Forex market. It is a great tool for traders who are looking to identify potential buy and sell signals.
MT4


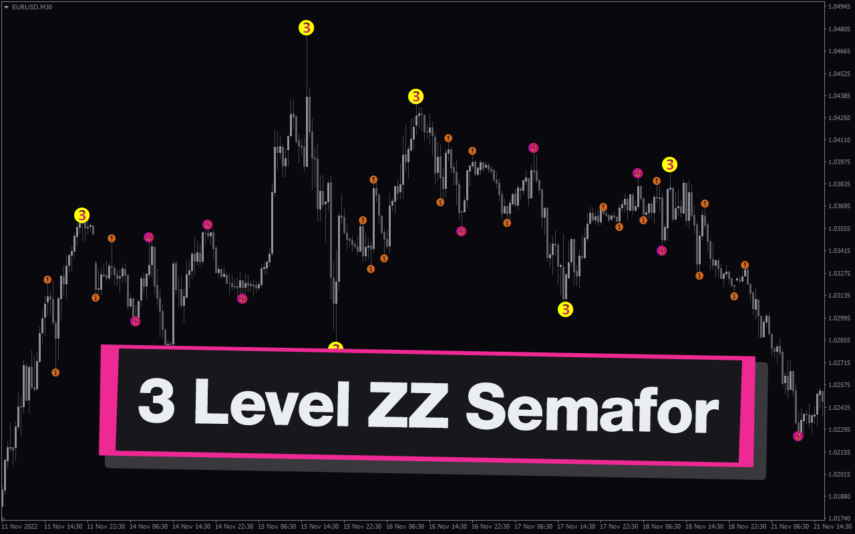
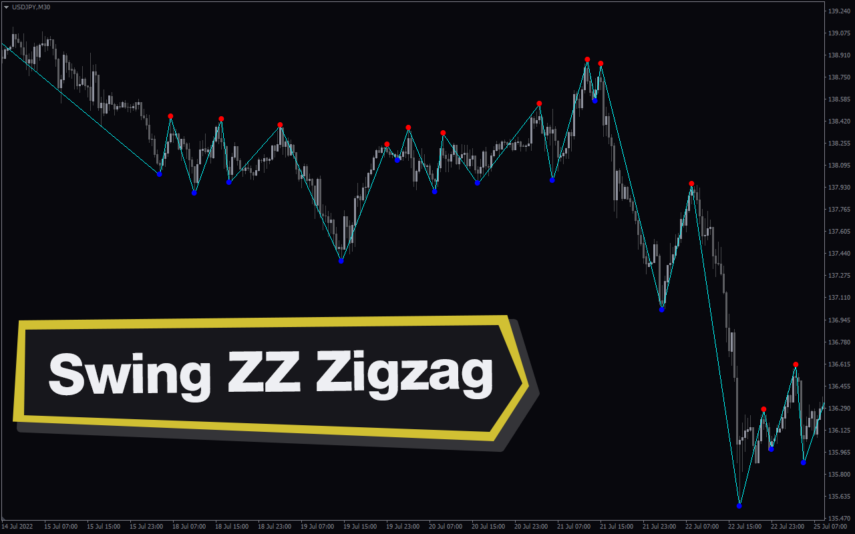
RSI Bands
The RSI Bands Indicator is a popular and free forex indicator for the MT4 trading platform. The indicator works by plotting two lines on the chart. The upper line is drawn by adding a certain percentage of the RSI, while the lower line is drawn by subtracting the same percentage. This indicator is a great tool for any trader looking to make informed trading decisions.
| Trading Style | , |
|---|---|
| Indicator Type | |
| Timeframe | , |
| Platform |
0
People watching this product now!
Downloads - 18
Description
Reviews (0)
How to Install
Related products
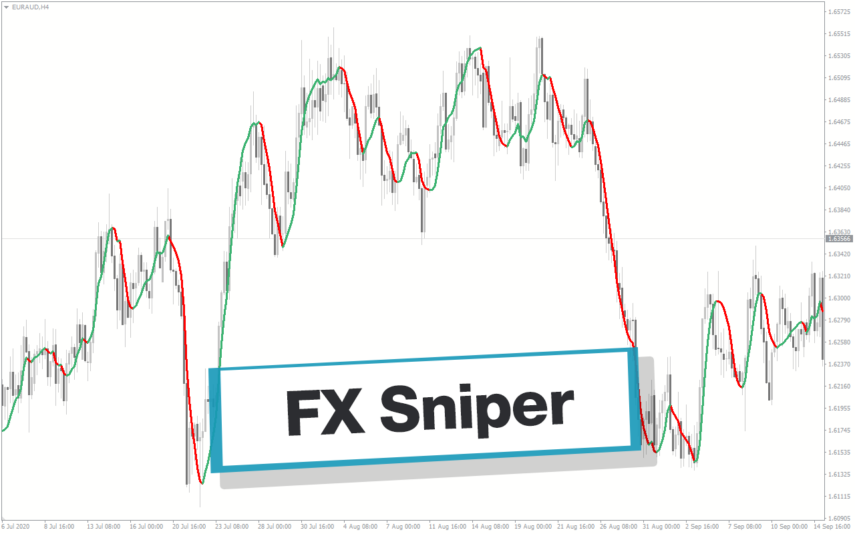
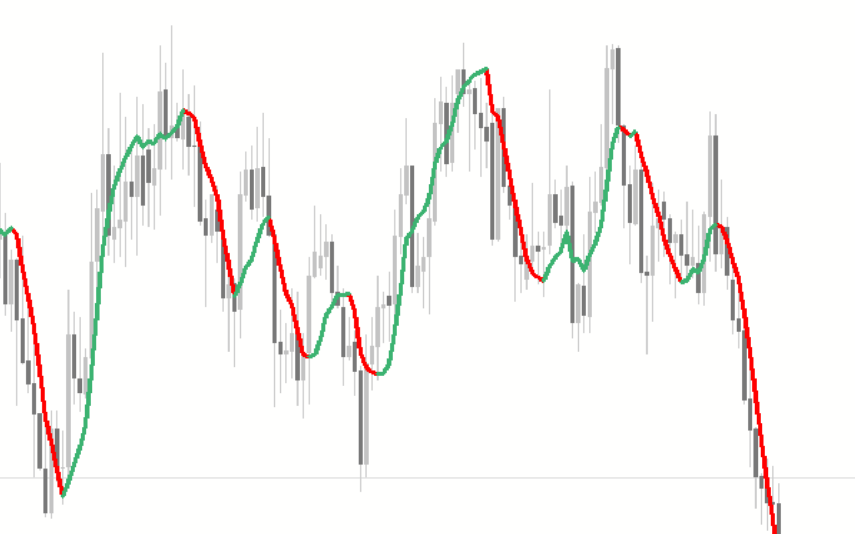
FX Sniper
The FX Sniper indicator is a new and popular forex indicator available for free on the MT4 platform. It uses advanced algorithms to identify trends and potential trading opportunities. The indicator is easy to use and gives clear signals on when to buy or sell based on market conditions. The FX Sniper indicator is suitable for traders of all levels, from beginners to experienced traders who want to improve their trading performance and profitability.
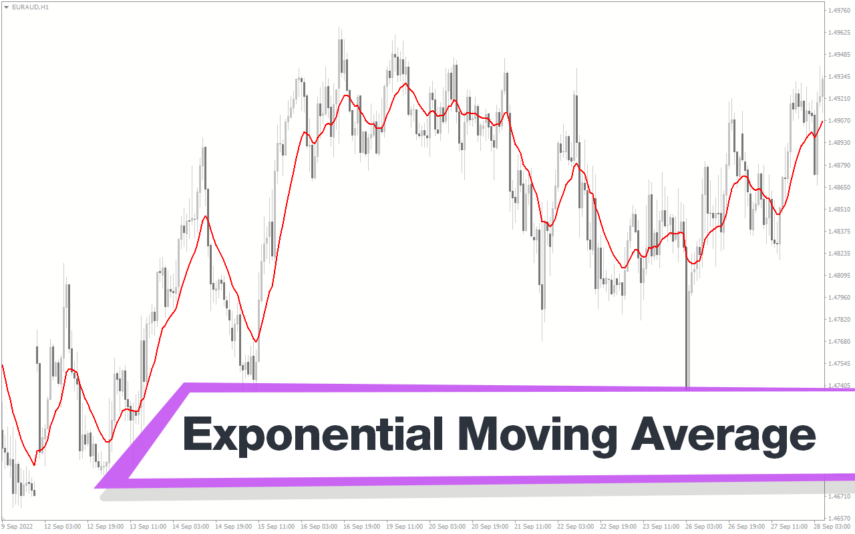
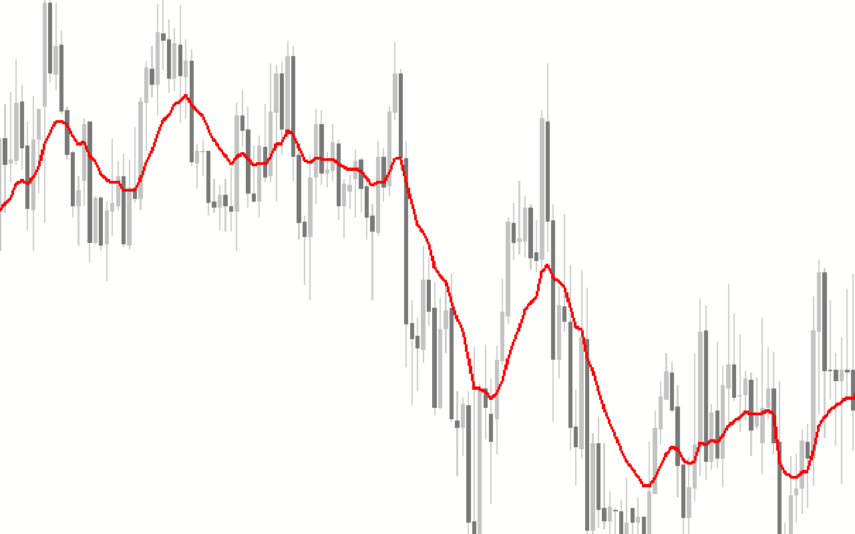
Exponential Moving Average
The EMA Indicator is a popular new forex tool for MT4 that is available for free download. It is a type of moving average that provides more weight to recent price changes, making it more responsive to current market conditions. The EMA indicator works by calculating the average price of an asset over a given period, with more emphasis placed on recent price action. This makes it a useful tool for traders looking to identify trends and changes in market direction.
Reviews
There are no reviews yet.