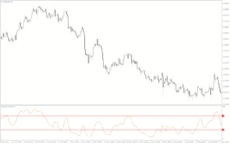
The Relative Momentum Index (RMI) indicator for MT4 is another variation of the regular RSI indicator. Unlike the RSI which compares the speed and change of price movement to measure momentum, the RMI measures the momentum of price movement using either the open, close, high, or low of the price over a specified period.
Therefore, the RMI indicator identifies the overbought and oversold market conditions better than the RSI. The indicator is recommended for scalpers, day/intraday, and swing traders for identifying optimal zones for trend reversal trading opportunities.
Features of the RMI Indicator for MT4
As noted above, the RMI uses the open, close, high, or low of the price to calculate the average price changes over a period. So, traders can set their preferred price (e.g., closing price) for the indicator. Besides, the indicator’s periods are also customizable.
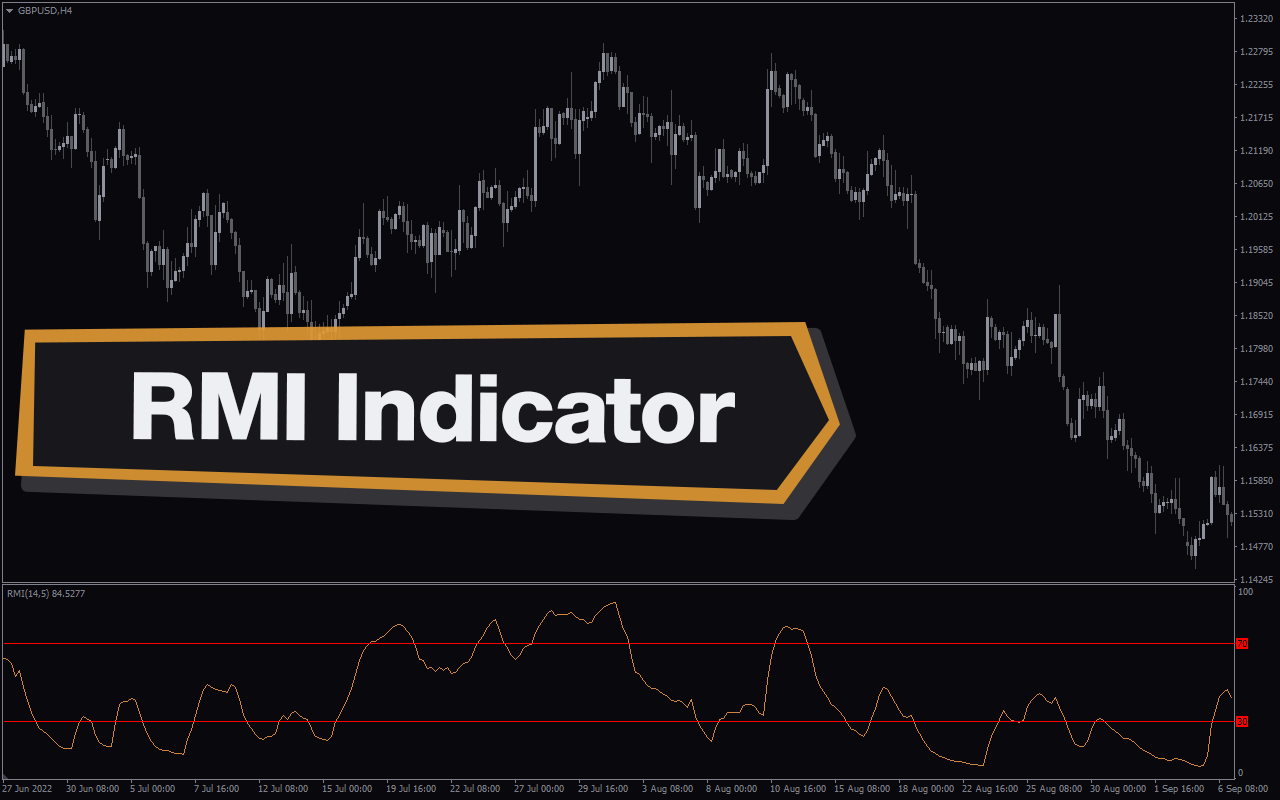
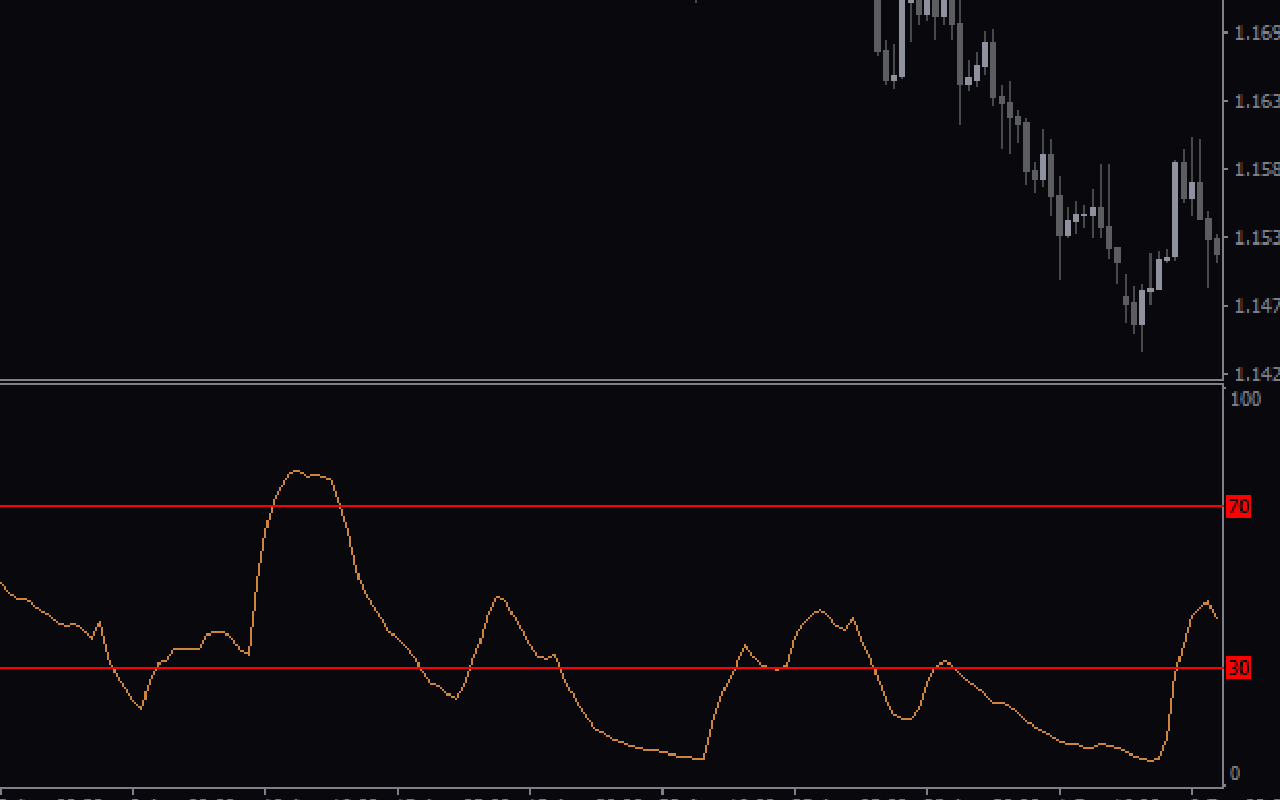
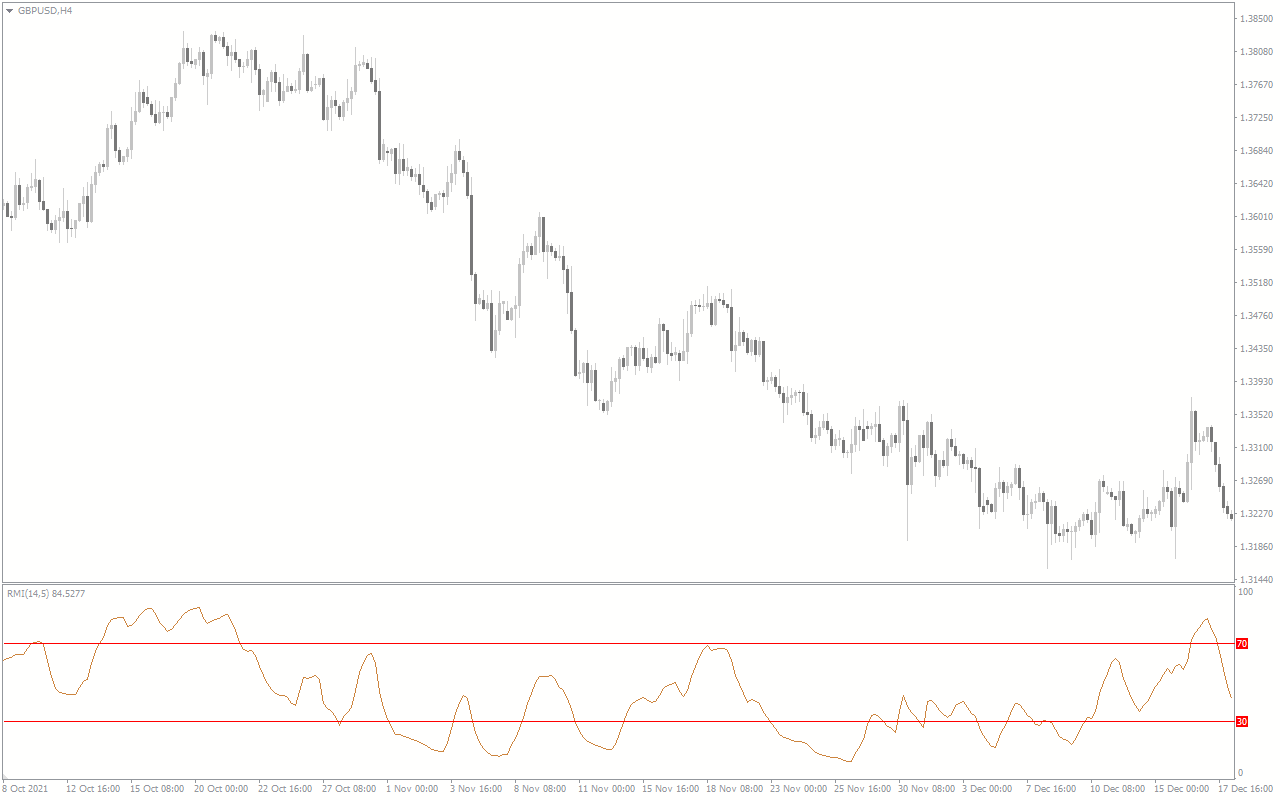
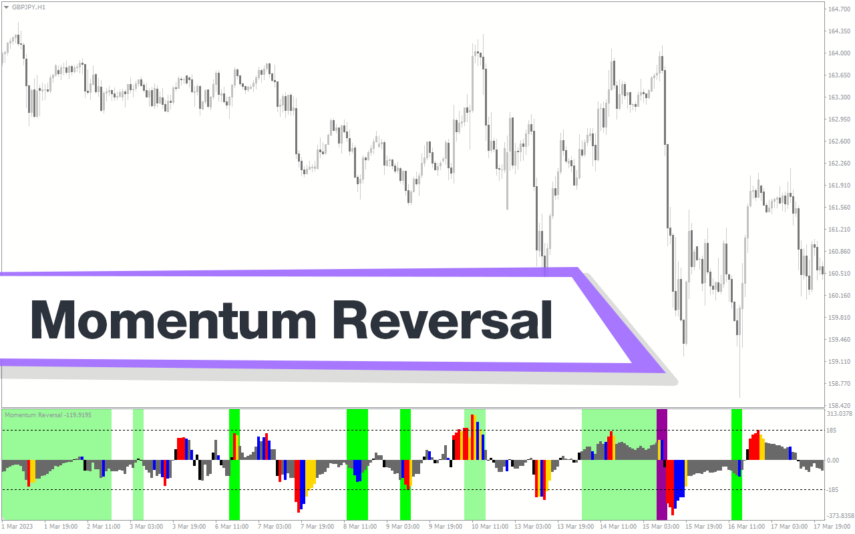
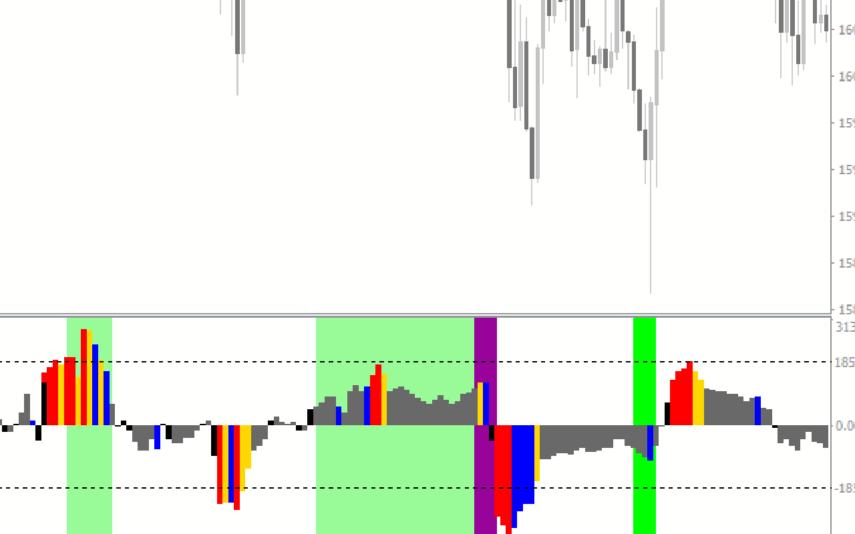
Furthermore, the indicator has horizontal lines at levels 70 and 30, representing overbought and oversold zones, respectively.
Benefits of Using the Indicator
- Enhances Signal Accuracy: The RMI indicator provides accurate overbought/oversold zones of the price, even in volatile markets compared to the RSI. This helps traders identify potential trend reversal trading opportunities when the price is at overbought or oversold levels.
- Reduces Whipsaws: The RMI indicator is notable for producing fewer signals compared to the regular RSI. Thus, the RMI delivers better trend reversal signals even in trending market conditions. However, this isn’t true for the RSI, which tends to give premature reversal signals when the market is in a strong bullish or bearish trend.
Indicator Settings Description
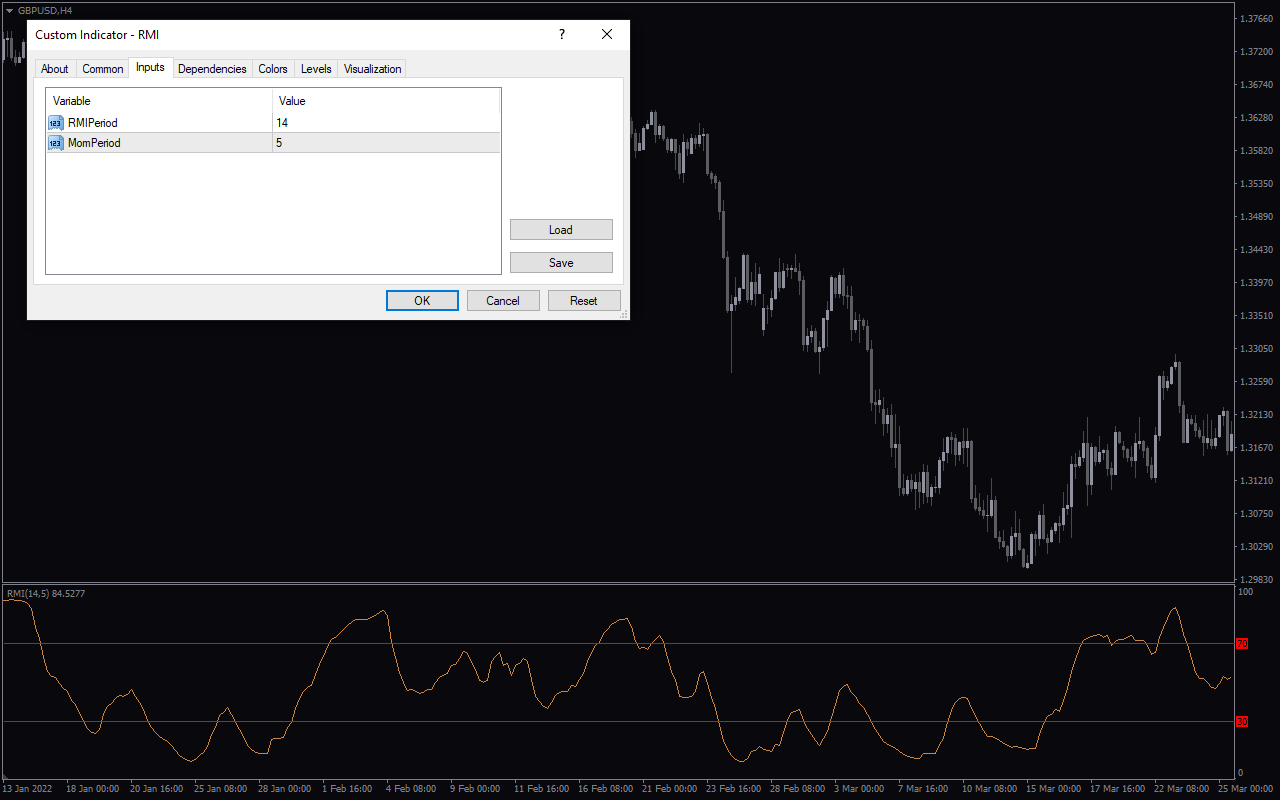
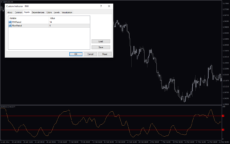
The indicator comes with the following customizable settings:
RMIPeriod: Determines the period of the RMI indicator.
MomPeriod: Determines the period to calculate the momentum component.

Reviews
There are no reviews yet.