
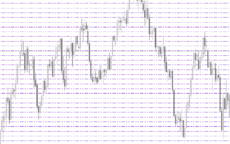
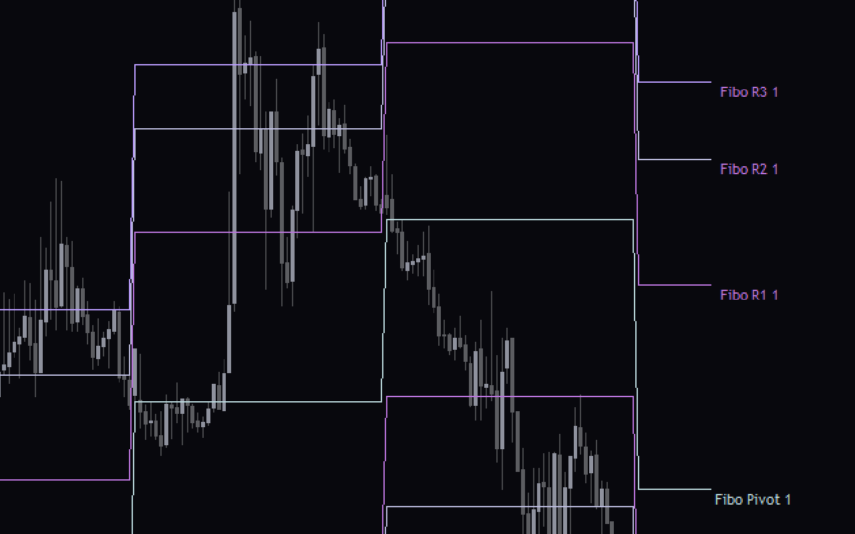
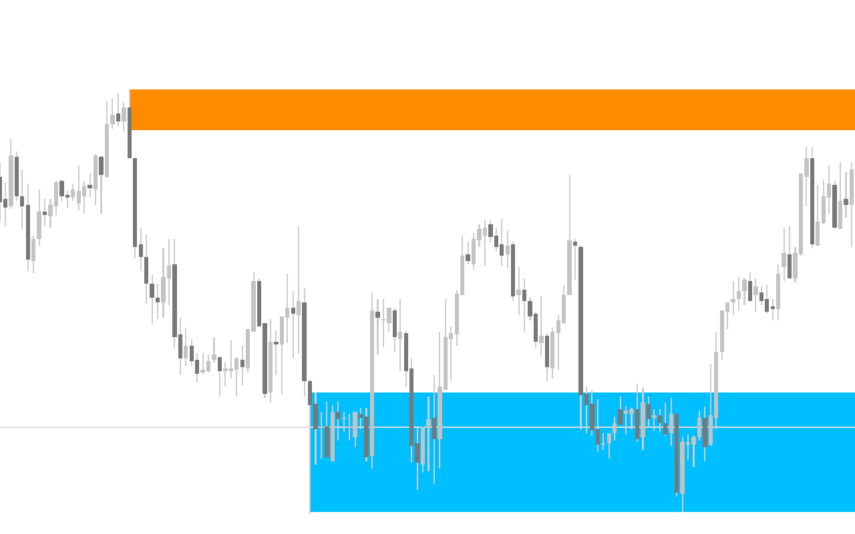
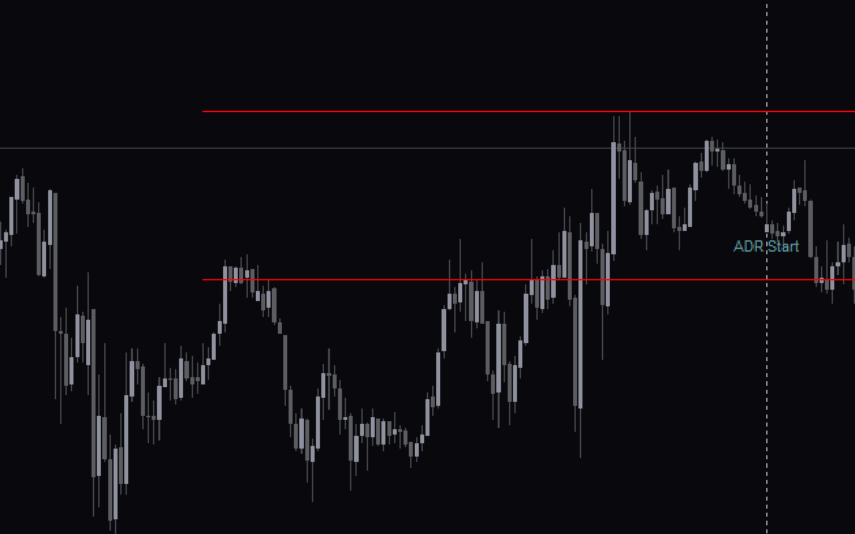
The Price Grid Indicator MT5 is a popular and useful free Forex indicator that helps traders analyze the markets. It is a powerful tool that helps traders to identify potential support and resistance levels, as well as potential entry and exit points. The Price Grid Indicator MT5 displays a grid of price points on the chart. The grid is composed of vertical and horizontal lines that represent the different price levels. The vertical lines represent support and resistance levels, while the horizontal lines represent entry and exit points. The indicator also displays a number of other features, such as the current market trend, the current market volatility, and the current market momentum. With its powerful features, the Price Grid Indicator MT5 is a great tool for any trader looking to analyze the markets.
MT5


Price Grid
The Price Grid Indicator MT5 is a useful and popular free Forex indicator. It is designed to help traders identify potential trading opportunities in the Forex market. The indicator works by displaying a grid of prices on the chart. The Price Grid Indicator MT5 is a great tool for traders of all experience levels.
| Trading Style | , , |
|---|---|
| Indicator Type | |
| Platform | |
| Timeframe |
0
People watching this product now!
Downloads - 19
Description
Reviews (0)
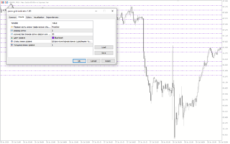
How to Install
Related products
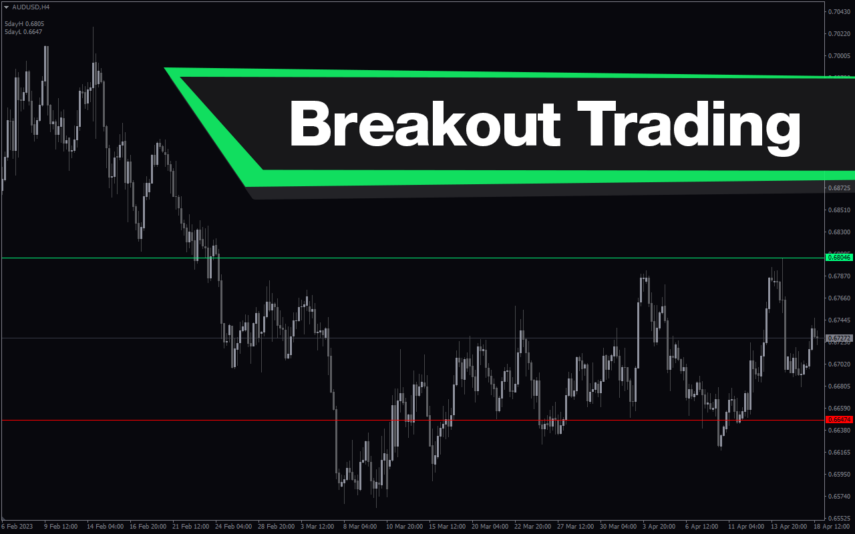
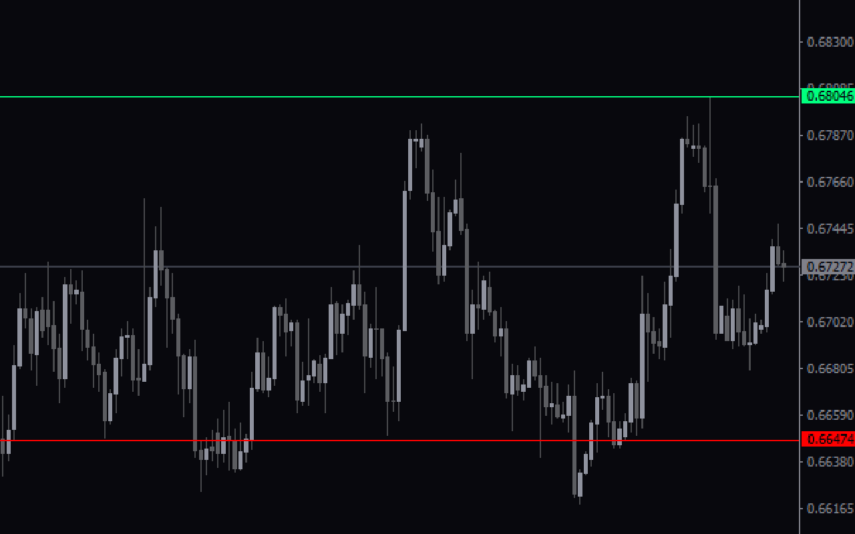
Breakout Trading
The Breakout Trading Indicator is a powerful MT4 tool designed for forex traders who want to catch breakouts in their trading strategy. The indicator scans for potential breakouts and alerts traders when a potential breakout is detected, making it easy to spot profitable trading opportunities. With an advanced algorithm, the indicator identifies key support and resistance levels, helping traders better understand market trends and make informed trading decisions.
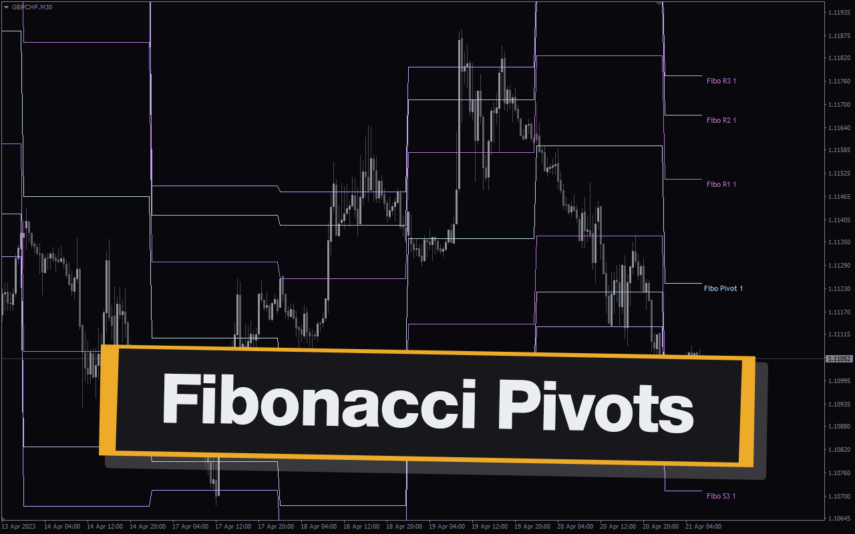
Fibonacci Pivots
The Fibonacci Pivots Indicator is a powerful MT4 tool for Forex traders looking to predict key levels of support and resistance.Using the Fibonacci sequence, the indicator calculates the pivot levels and displays them on the chart, making it easy to identify potential entry and exit points. The Fibonacci Pivots Indicator works best in trending markets and can be used on multiple timeframes, making it suitable for both short-term and long-term traders. With its clear and easy-to-use interface, this indicator is a valuable addition to any trader's toolbox.
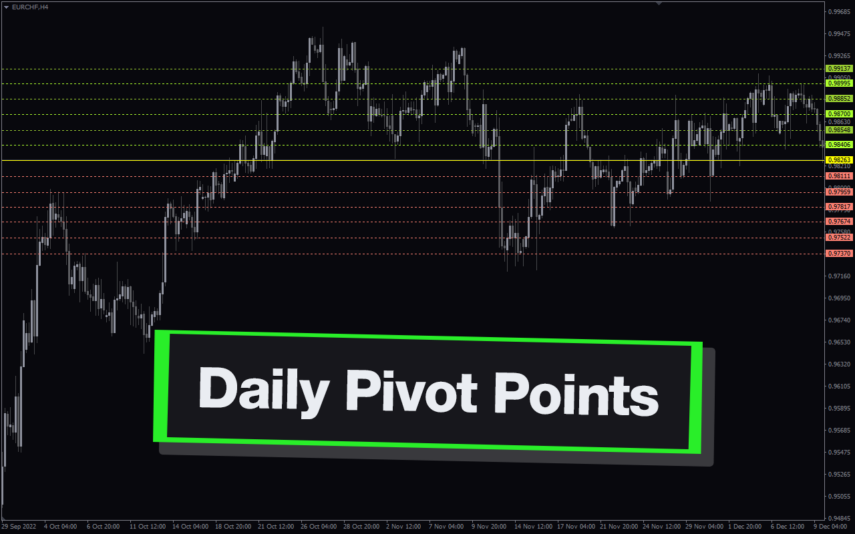
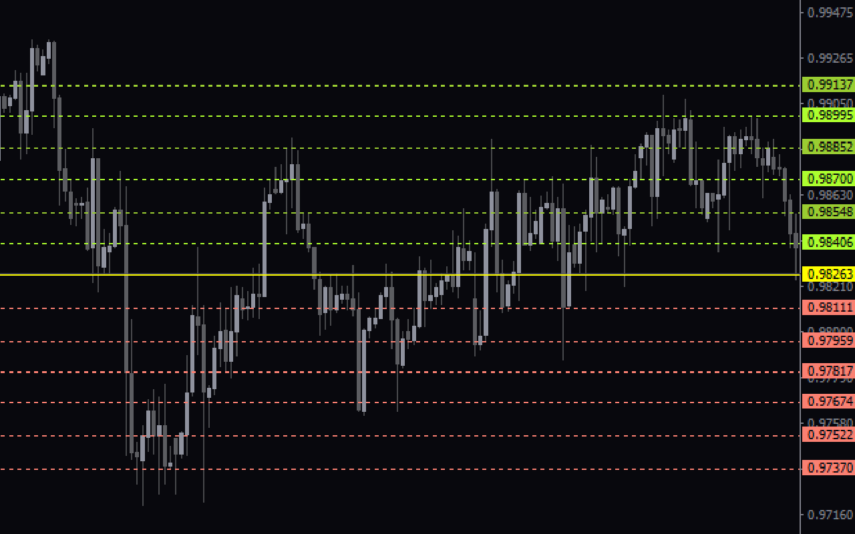
Daily Pivot Points
The Daily Pivot Points Indicator is a popular and free MT4 indicator that helps forex traders identify potential support and resistance levels based on the previous day's high, low, and close prices. The indicator calculates several levels of support and resistance, including the main pivot point, three resistance levels, and three support levels, which can be used to help traders identify potential entry and exit points for trades. This new and user-friendly indicator makes it easy for forex traders of all levels of experience to quickly and accurately identify potential pivot points, helping them to make more informed trading decisions.
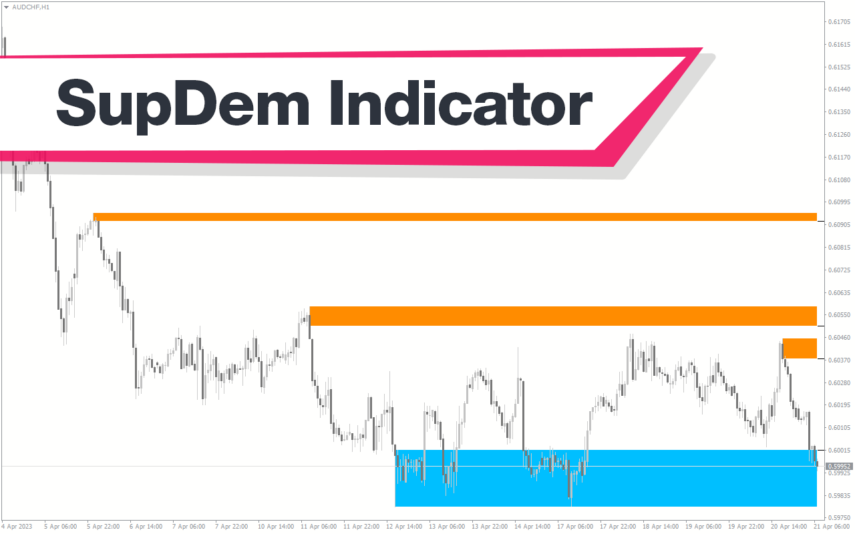
SupDem
The SupDem indicator is a new and popular Forex trading tool that is available for free on MT4. It is designed to determine support and resistance levels by analyzing the supply and demand zones on the chart. The indicator uses color-coded columns to highlight areas of strong support and resistance, allowing traders to easily identify potential trading opportunities. By accurately analyzing supply and demand zones, the SupDem indicator can help traders make more informed trading decisions.
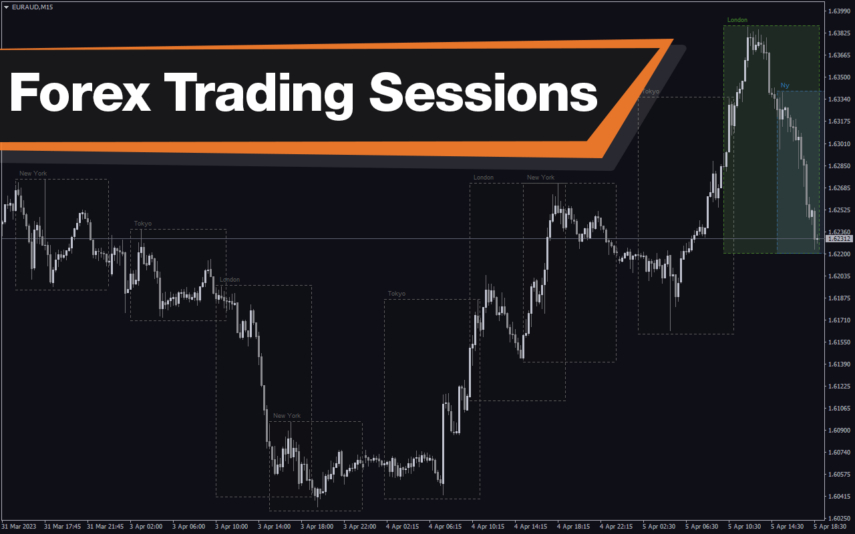
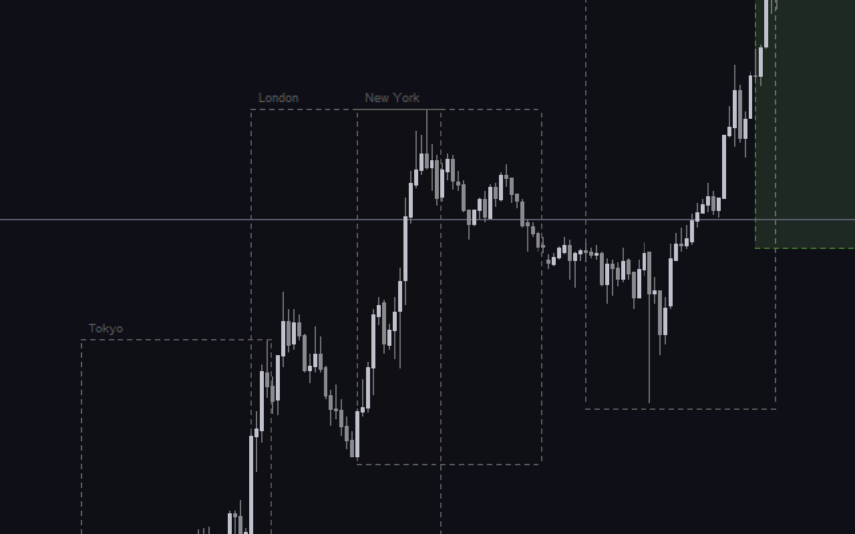
Forex Trading Sessions
The Forex Trading Sessions indicator is a new powerful and popular MT4 indicator designed to help traders identify active trading sessions in the forex market. This indicator shows the opening and closing times of various global financial centers including Tokyo, London and New York on a trading chart, highlighting active trading sessions with colored rectangles. The Forex Trading Sessions indicator is a useful tool for forex traders of all levels, from beginners to experienced traders, that provides important information about active forex trading sessions, helping to optimize trading strategies and increase profitability.
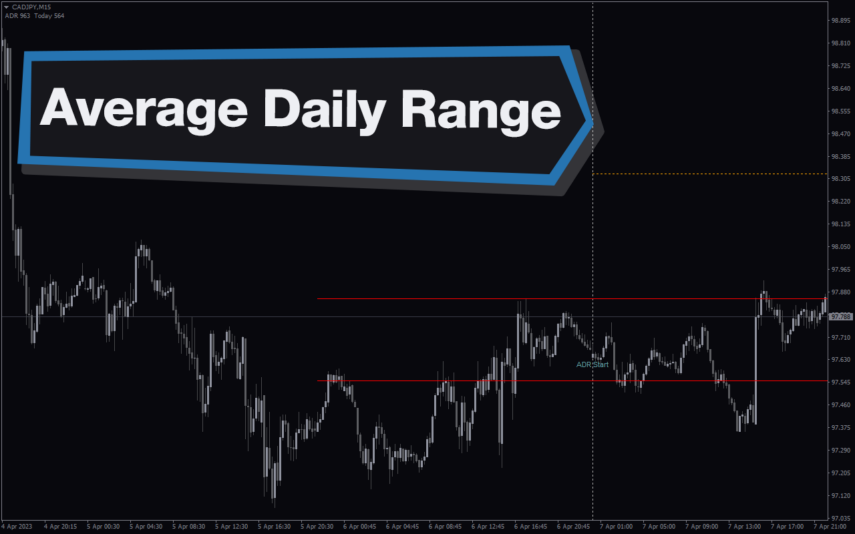
Average Daily Range
The ADR HighLow indicator is a new and popular forex indicator that traders can use for free on the MT4 platform. This indicator measures the average daily range (ADR) of a currency pair and displays the high and low of the day, and is also a great tool for setting stop loss and take profit levels. Use the best ADR indicator to identify potential support and resistance levels and use their trading strategy successfully.
Reviews
There are no reviews yet.