
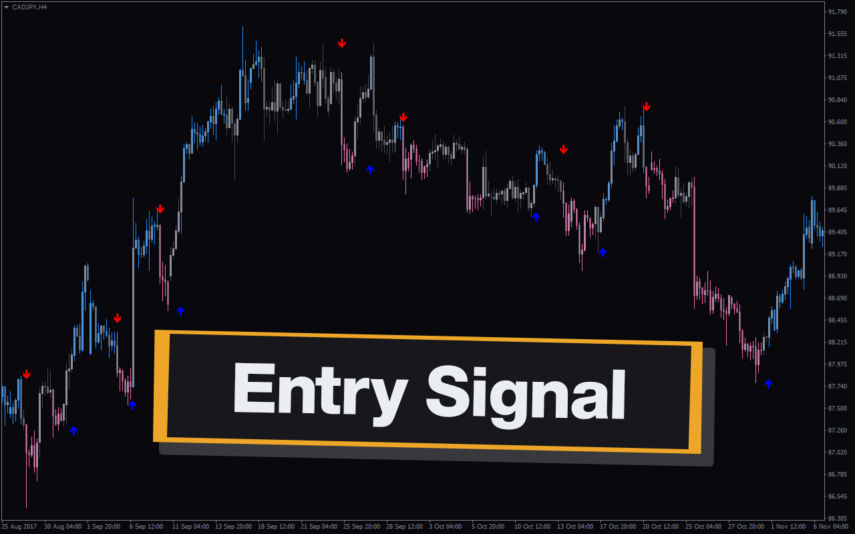
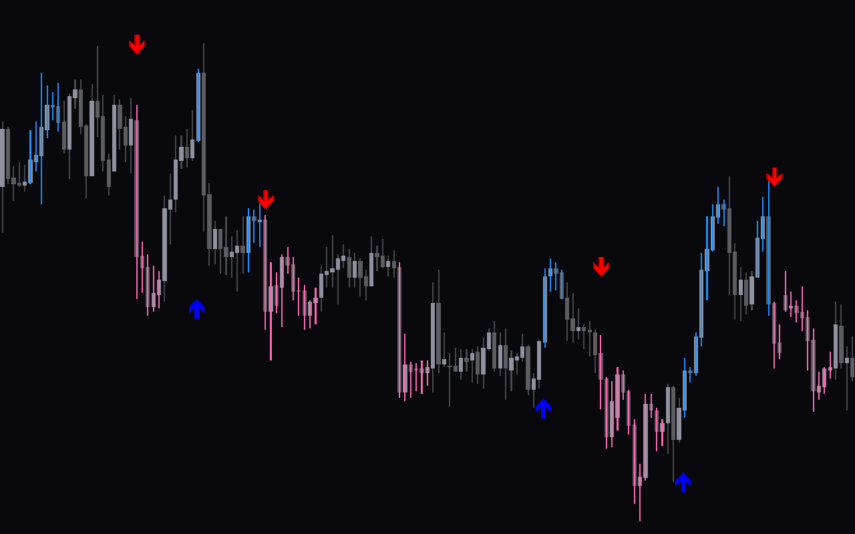
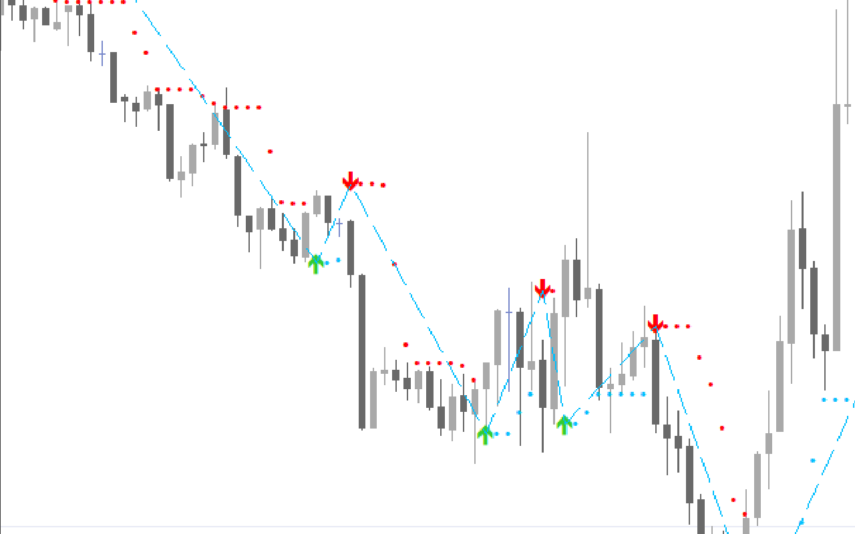
The Price Channel Stop Histogram MT4 is a popular and useful free Forex indicator that is used by many traders. It helps traders identify support and resistance levels on their charts and can be used to identify potential trading opportunities. The indicator works by plotting a histogram on the chart that shows the difference between the current price and the upper and lower channel levels. The histogram is color-coded to indicate if the price is above or below the channel levels. If the price is above the channel levels, then the histogram will be green, while if the price is below the channel levels, then the histogram will be red. The Price Channel Stop Histogram MT4 is a very useful tool for traders looking to identify entry and exit points in the market. It can be used to identify potential entry points when the price is above the channel levels, and potential exit points when the price is below the channel levels. Traders can also use the histogram to identify potential trend reversals when the price crosses the channel levels. The indicator can also be used to identify potential breakouts when the price moves outside of the channel levels.

MT4


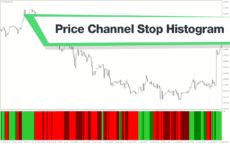
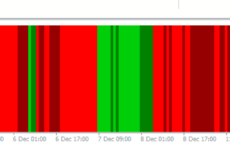
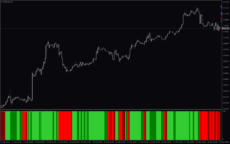
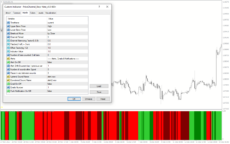
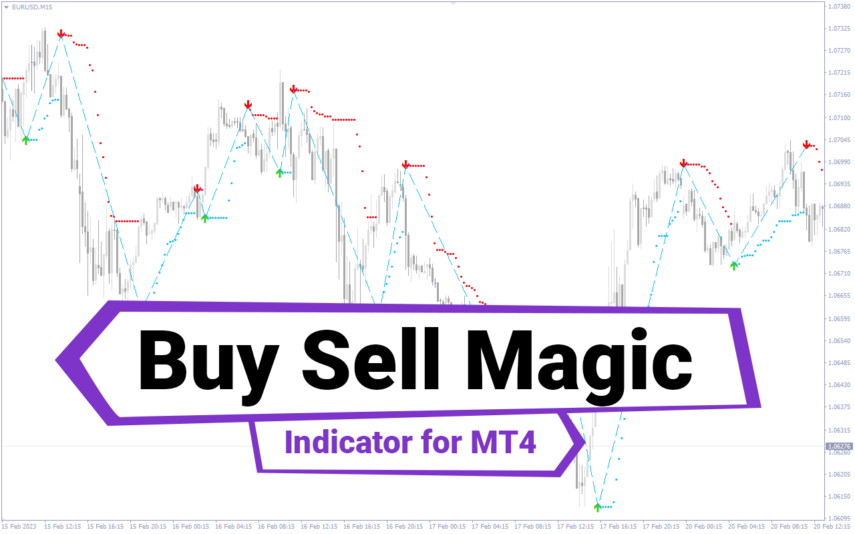
Price Channel Stop Histogram
The Price Channel Stop Histogram MT4 Forex Indicator is a popular and free tool used by many traders to help analyze the market. This indicator is useful for recognizing potential entry and exit points in the market. It helps traders identify when the market is entering an overbought or oversold state, allowing them to make informed decisions about their trades.
| Indicator Type | |
|---|---|
| Timeframe | |
| Trading Style | |
| Platform |
0
People watching this product now!
Downloads - 39
Description
Reviews (0)
How to Install
Related products
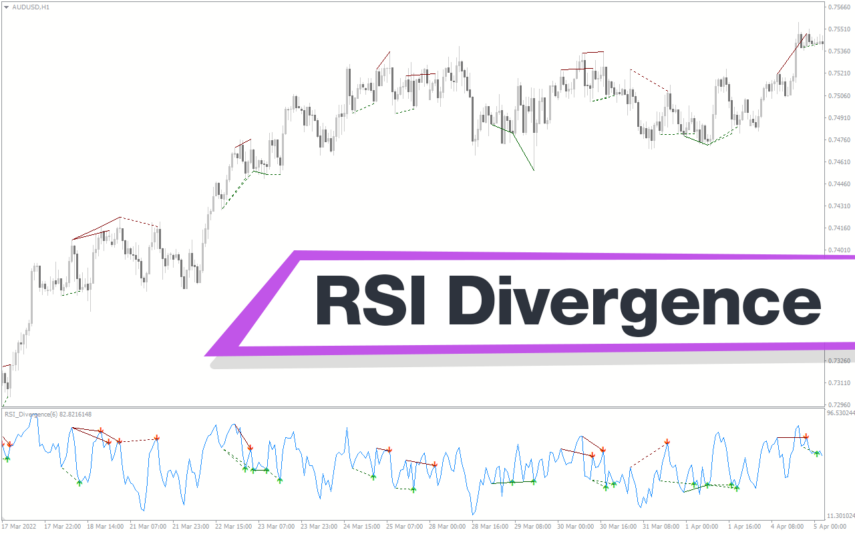
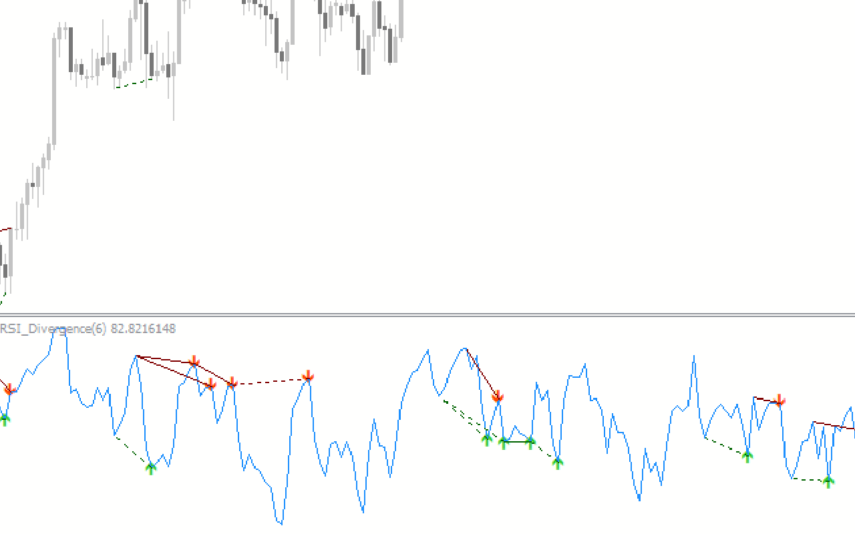
RSI Divergence
Enhance trading precision with the RSI Divergence indicator. Overcome signal challenges by leveraging divergence signals, which is vital for identifying potential market reversals. Customize settings, draw trendlines, and receive alerts for good trading decisions. Explore the power of the RSI Divergence indicator in assessing market conditions.
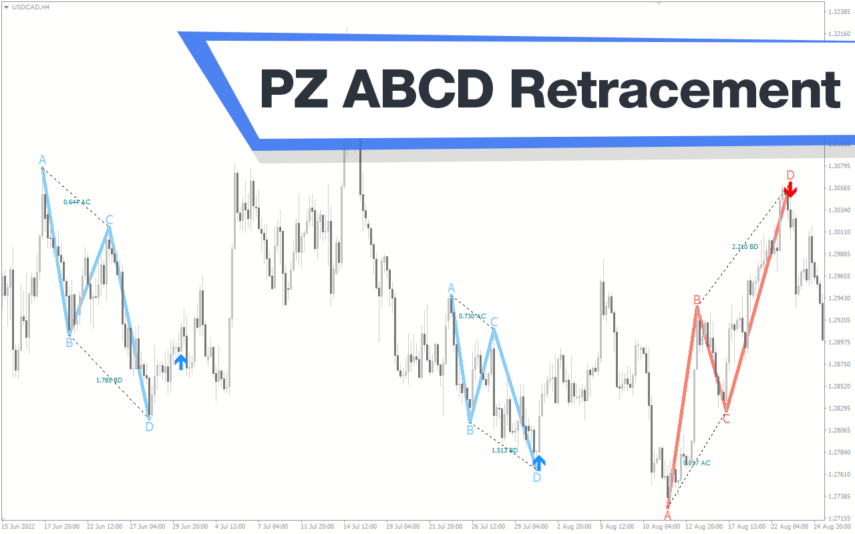
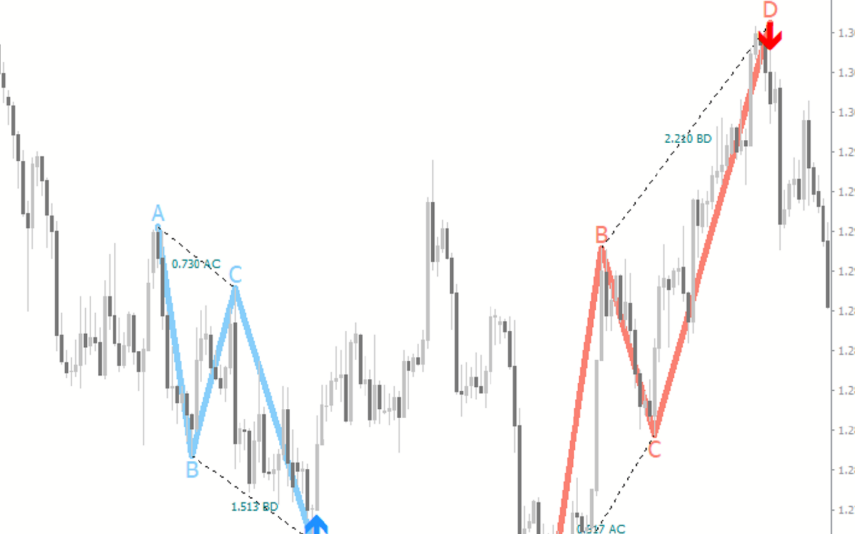
PZ ABCD Retracement
The PZ ABCD Retracement Indicator is a popular and free forex indicator for MT4 that helps traders identify potential trading opportunities by identifying the AB=CD harmonic pattern. The indicator automatically plots Fibonacci retracement levels to help traders identify entry and exit points. It works by scanning the market for the AB=CD pattern and drawing the necessary lines and levels. It can be used by both a novice and an experienced trader, making it a versatile tool for traders who want to improve their trading results.
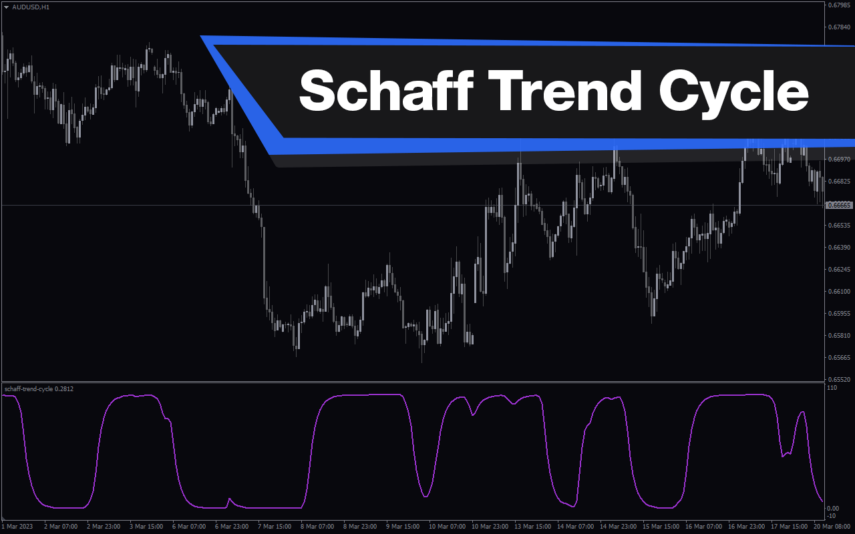
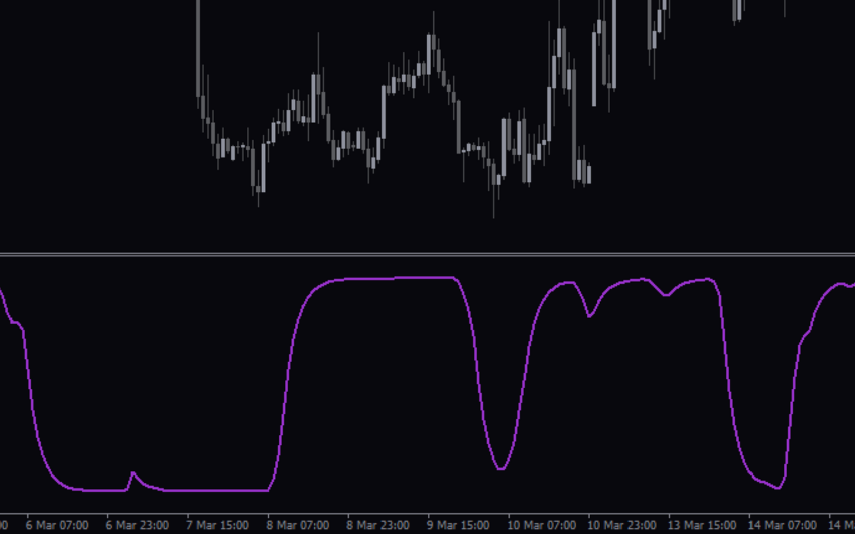
Schaff Trend Cycle
The Schaff Trend Cycle indicator is a popular forex indicator for MT4, which determines market trends with high accuracy. Its values range from 0 to 100, with values above 75 indicating overbought and values below 25 indicating oversold. Whether you are a beginner or an experienced trader, the Schaff Trend Cycle indicator will help you make better trading decisions and improve profitability.

Reviews
There are no reviews yet.