
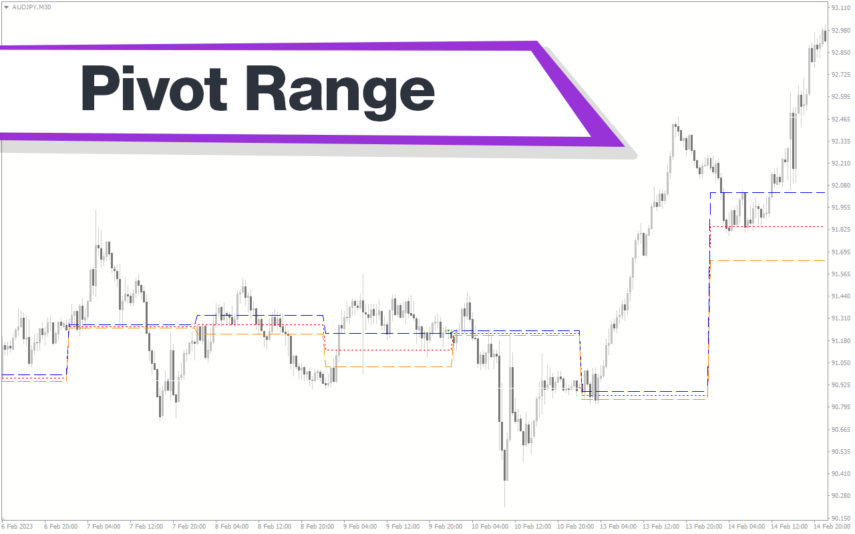
The Pivot Lines Timezone Indicator is a popular and free Forex indicator that is useful for traders of all levels. It is available for the MT4 trading platform and helps traders identify possible support and resistance levels in the market. The indicator is based on the calculation of the support and resistance levels using the previous day’s high, low, and close prices. The indicator is able to calculate the support and resistance levels according to different time zones, which makes it a great tool for traders who use different time frames. The Pivot Lines Timezone Indicator is a great tool for traders looking to take advantage of different time frames. By being able to identify the support and resistance levels based on different time zones, traders can get a better understanding of the market and make more informed trading decisions. The indicator is also free to use, making it a great tool for both experienced and novice traders.
MT4


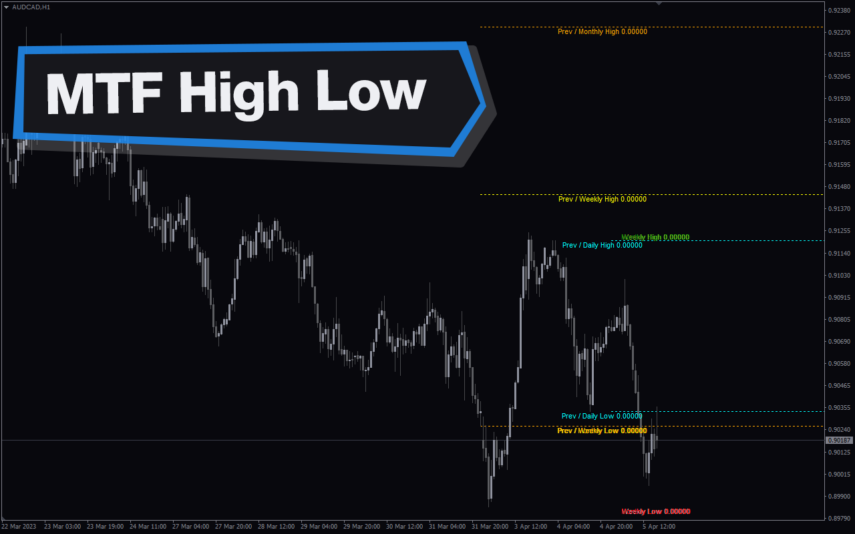
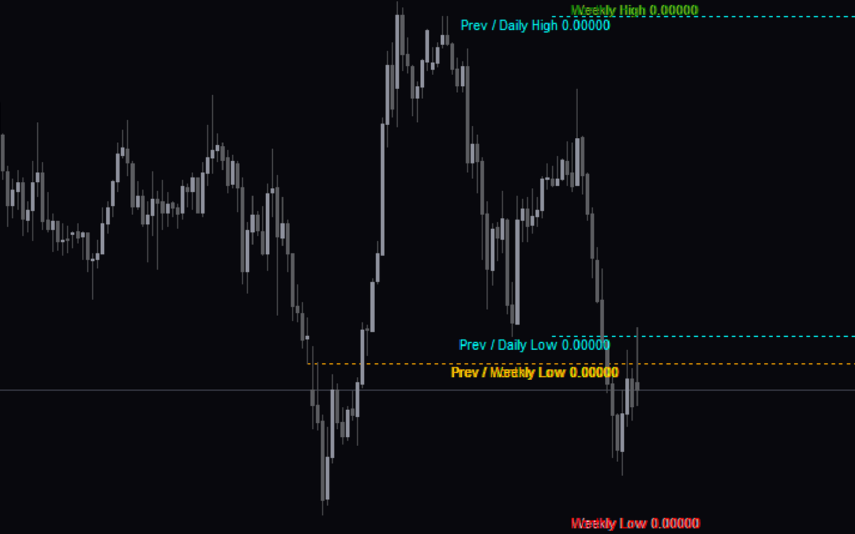
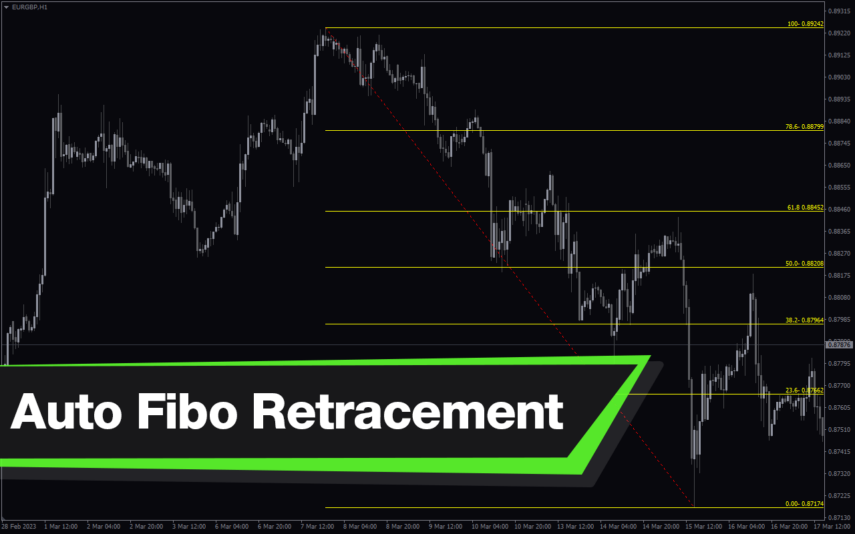
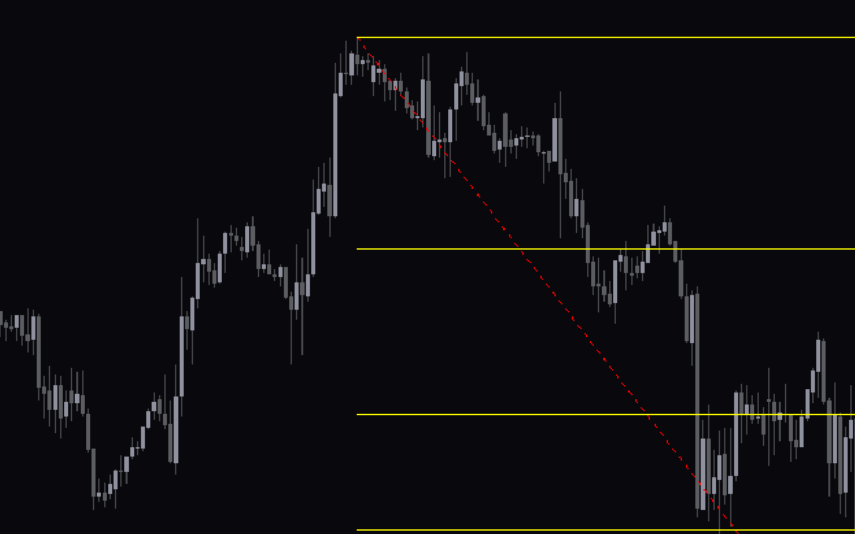
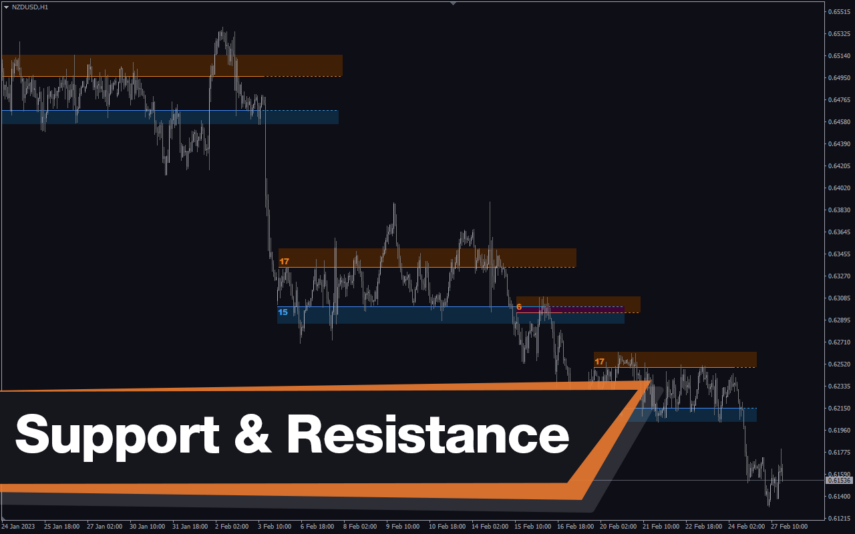
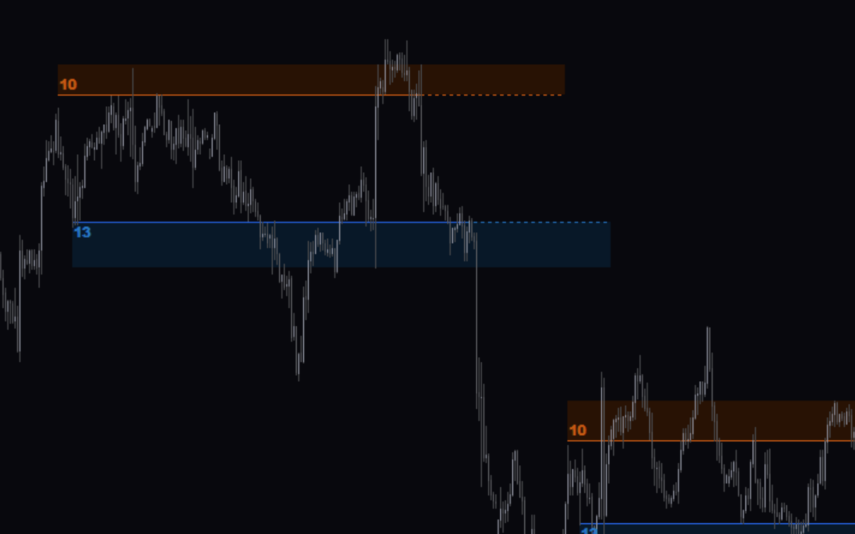
Pivot Lines Timezone
The Pivot Lines Timezone Indicator is a useful and popular free Forex indicator for MT4. This indicator helps traders identify potential support and resistance levels throughout the trading day. It does this by plotting a series of horizontal lines on the chart, each representing a different timezone. These lines are calculated using the previous day’s high, low, and close prices, and are used to identify levels of potential support and resistance. The Pivot Lines Timezone Indicator is a great tool for traders looking to gain an edge in the Forex market.
| Trading Style | , |
|---|---|
| Indicator Type | |
| Timeframe | , |
| Platform |
0
People watching this product now!
Downloads - 20
Description
Reviews (0)
How to Install
Related products
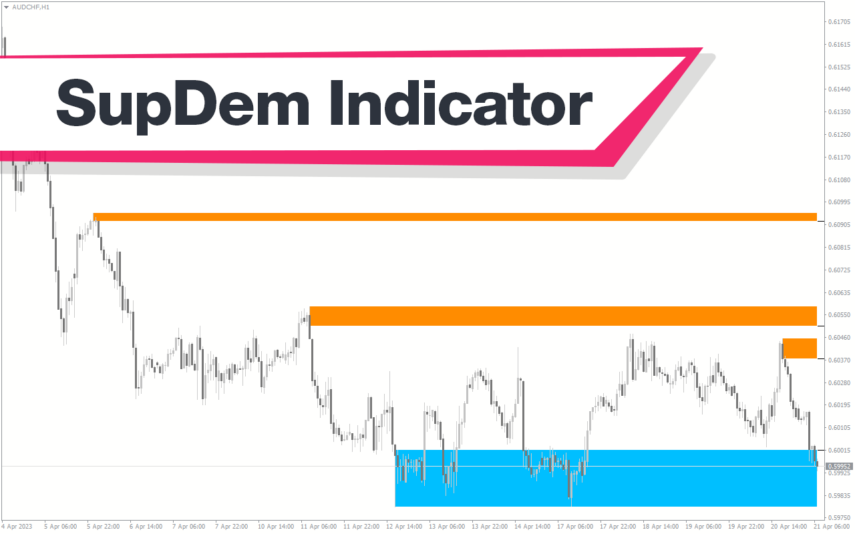
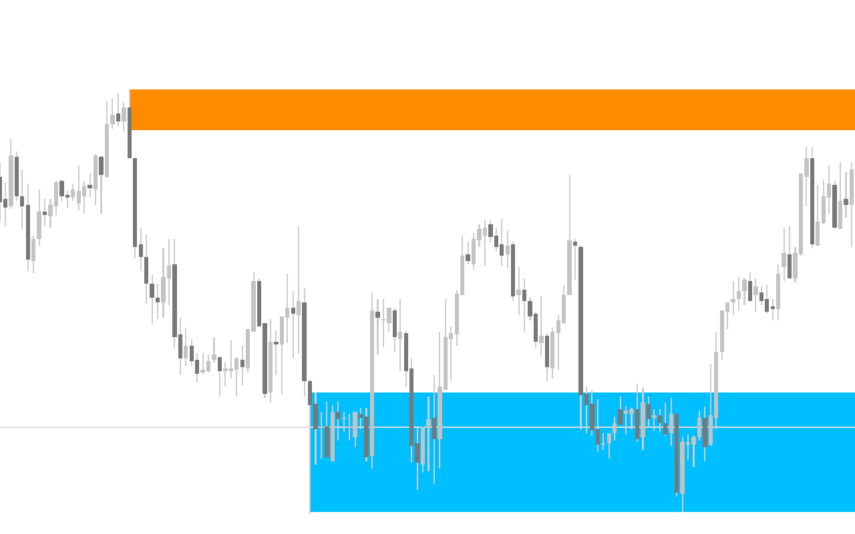
SupDem
The SupDem indicator is a new and popular Forex trading tool that is available for free on MT4. It is designed to determine support and resistance levels by analyzing the supply and demand zones on the chart. The indicator uses color-coded columns to highlight areas of strong support and resistance, allowing traders to easily identify potential trading opportunities. By accurately analyzing supply and demand zones, the SupDem indicator can help traders make more informed trading decisions.
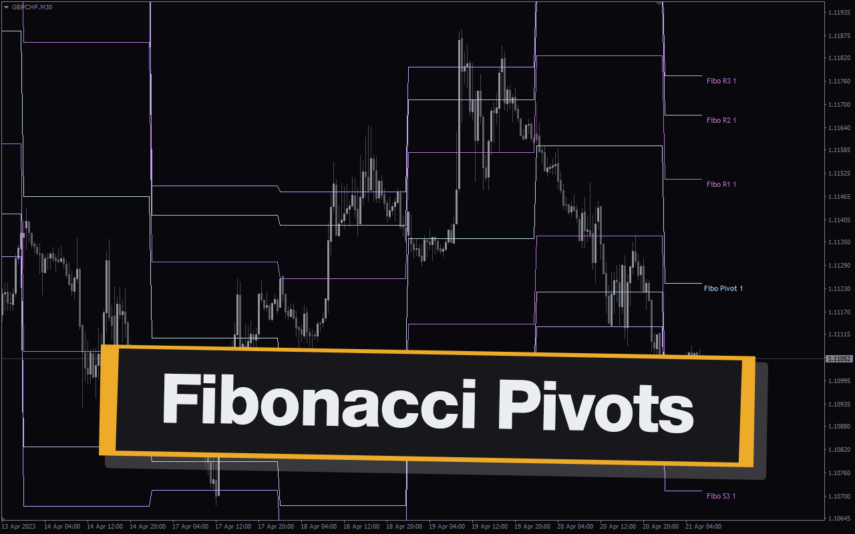
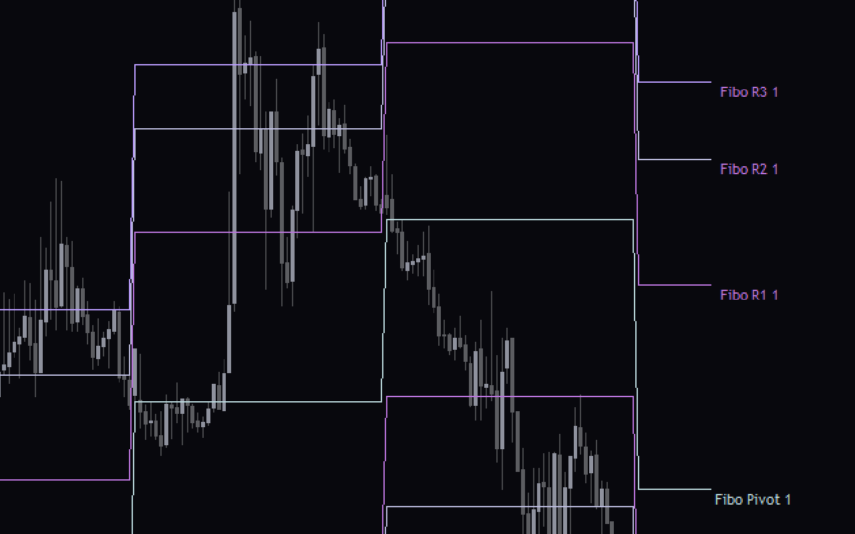
Fibonacci Pivots
The Fibonacci Pivots Indicator is a powerful MT4 tool for Forex traders looking to predict key levels of support and resistance.Using the Fibonacci sequence, the indicator calculates the pivot levels and displays them on the chart, making it easy to identify potential entry and exit points. The Fibonacci Pivots Indicator works best in trending markets and can be used on multiple timeframes, making it suitable for both short-term and long-term traders. With its clear and easy-to-use interface, this indicator is a valuable addition to any trader's toolbox.
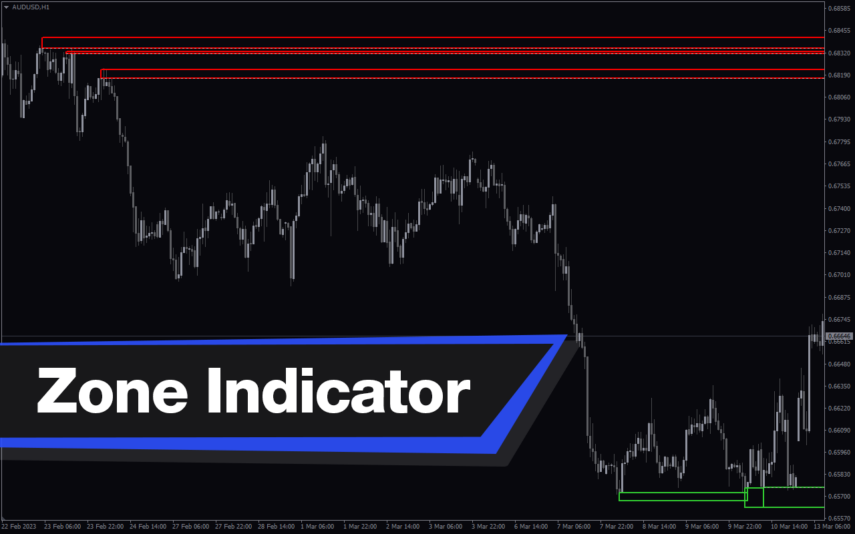
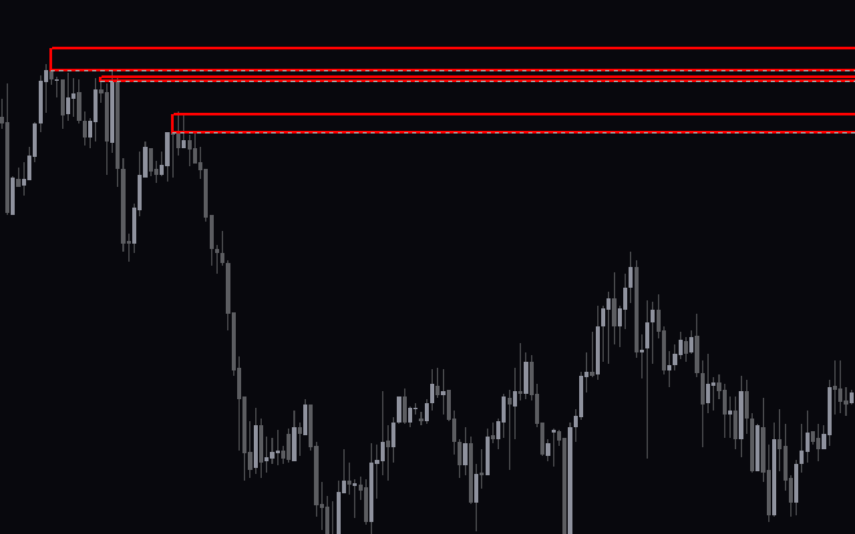
Zone Indicator
The Zone Indicator is a popular MT4 Forex trading tool that is new to the market and is available as a free download. This is essential for forex traders who rely on support and resistance strategies, trend traders and traders who want to anticipate price action. The Zone indicator automatically displays strong support or resistance levels on the chart.
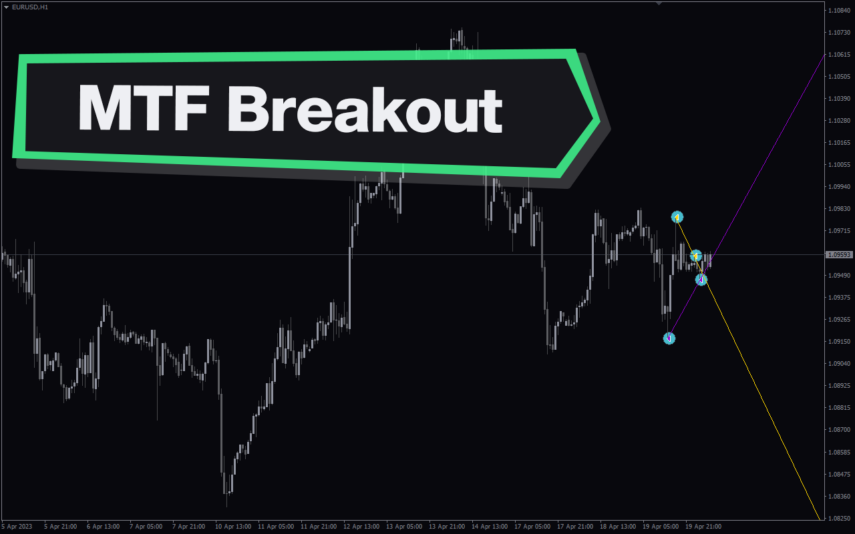
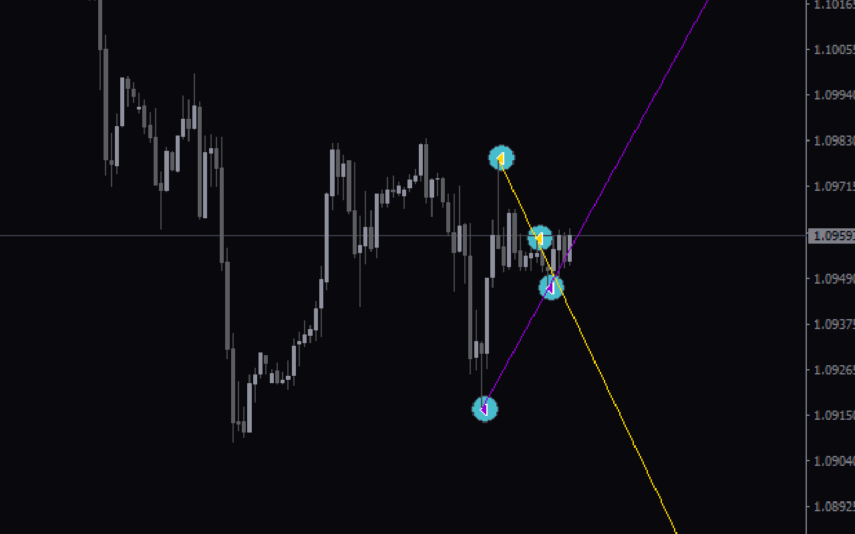
Multi Time Frame Breakout
The Multi-Time Frame Breakout indicator is a new and popular forex indicator that is available for free on the MT4 platform. This indicator helps traders identify breakout points by analyzing multiple timeframes at the same time. It works by plotting support and resistance levels based on the highest and lowest price levels over multiple time frames. This is a valuable tool for traders who use multiple timeframes in their analysis and want to improve their accuracy in identifying potential breakout points.
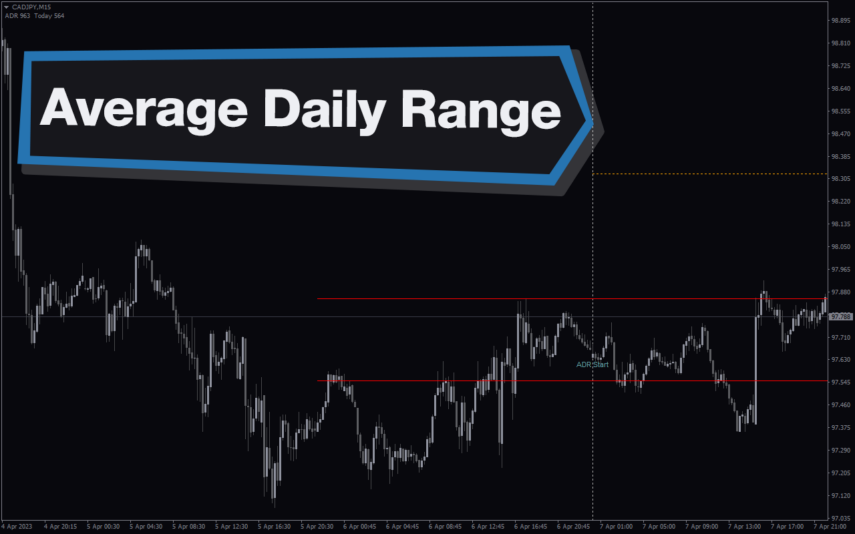
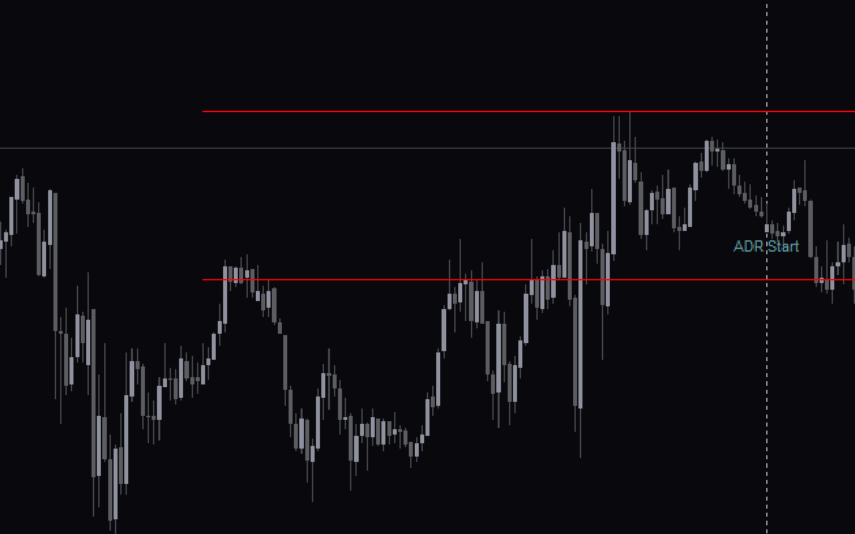
Average Daily Range
The ADR HighLow indicator is a new and popular forex indicator that traders can use for free on the MT4 platform. This indicator measures the average daily range (ADR) of a currency pair and displays the high and low of the day, and is also a great tool for setting stop loss and take profit levels. Use the best ADR indicator to identify potential support and resistance levels and use their trading strategy successfully.
Reviews
There are no reviews yet.