
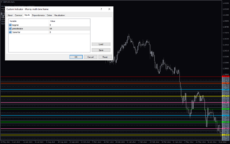
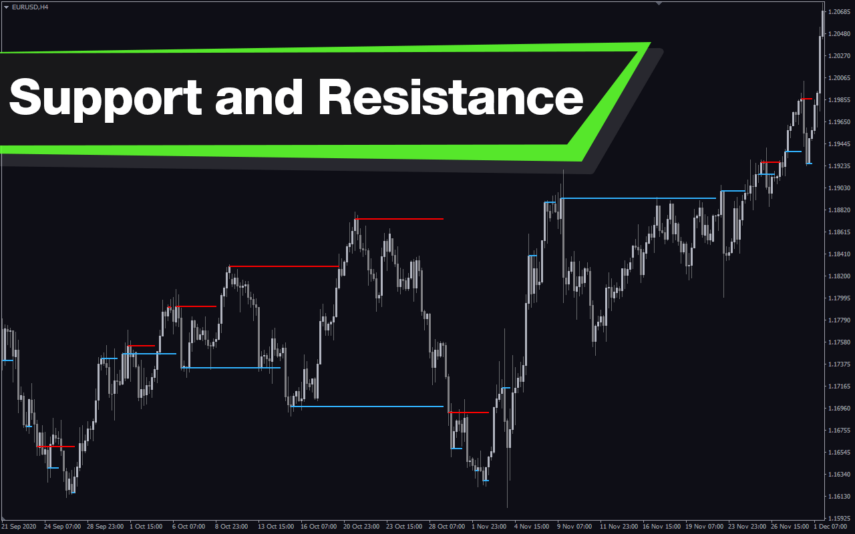
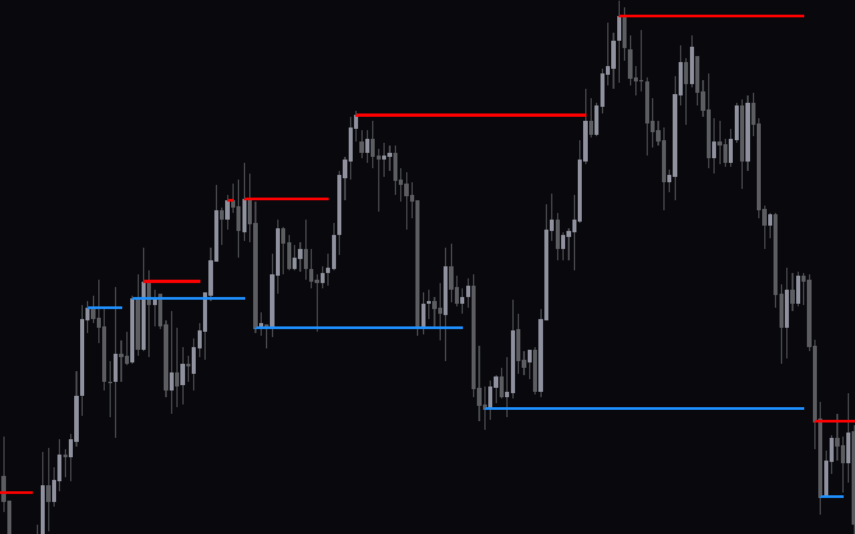
The Murrey Math Time Frame Indicator is a useful tool for Forex traders who use the popular MT4 platform. It is a free indicator that helps traders identify important support and resistance levels on different time frames. The indicator is based on the Murrey Math Lines, which are a set of 9 lines that divide the range of a price into 8 equal parts. It is a popular indicator among traders, as it provides an easy way to identify support and resistance levels. The Murrey Math Time Frame Indicator works by plotting the Murrey Math Lines on a chart. These lines are used to identify the support and resistance levels of a price. This indicator also allows traders to adjust the time frame of the chart, which allows them to analyze the price on different time frames. This helps traders identify important support and resistance levels that may not be visible on the main chart. The Murrey Math Time Frame Indicator can be used to identify key levels of support and resistance on any time frame. It is a useful tool for traders of all levels, as it can help them identify important levels of support and resistance. The indicator is free, so traders can use it without any cost.
MT4


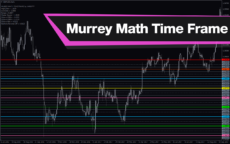
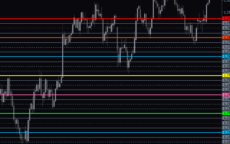
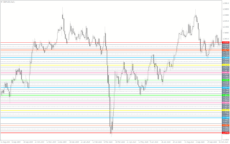
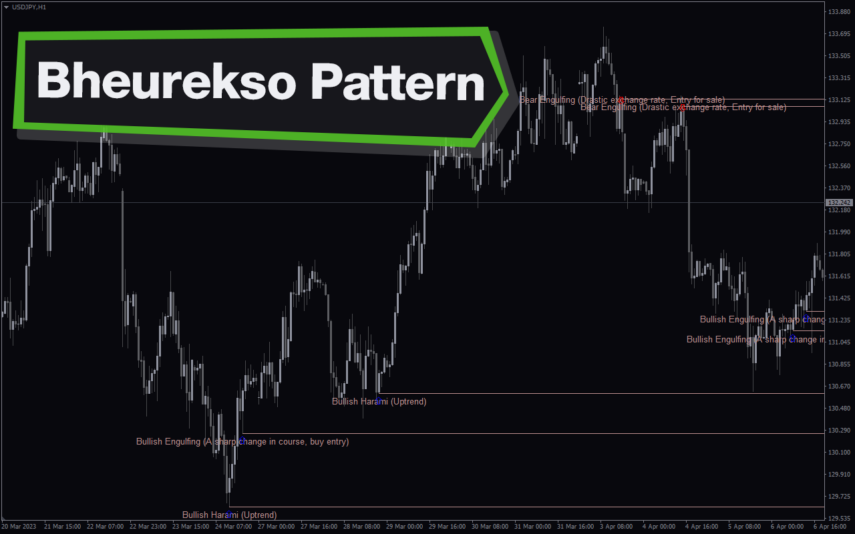
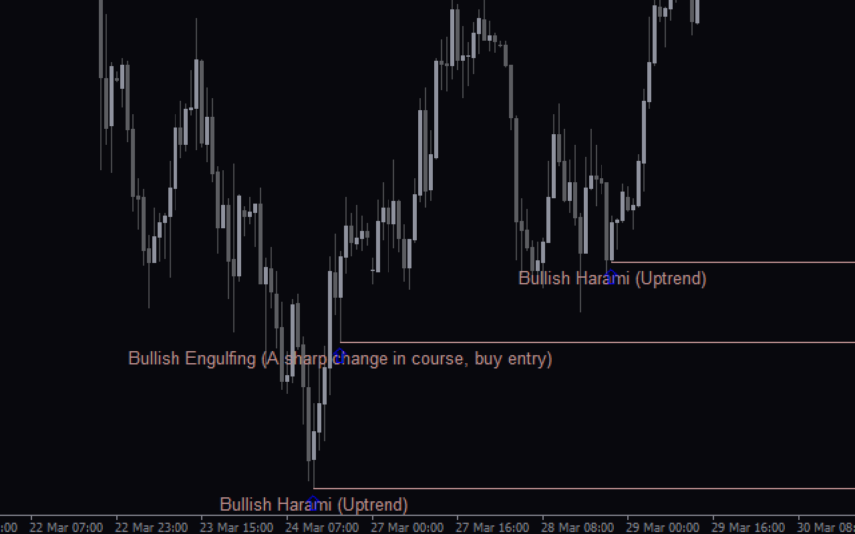
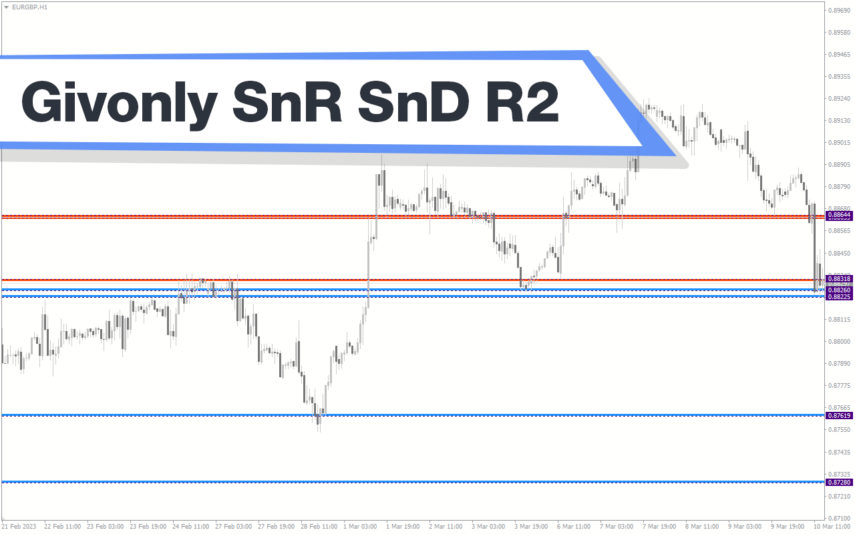
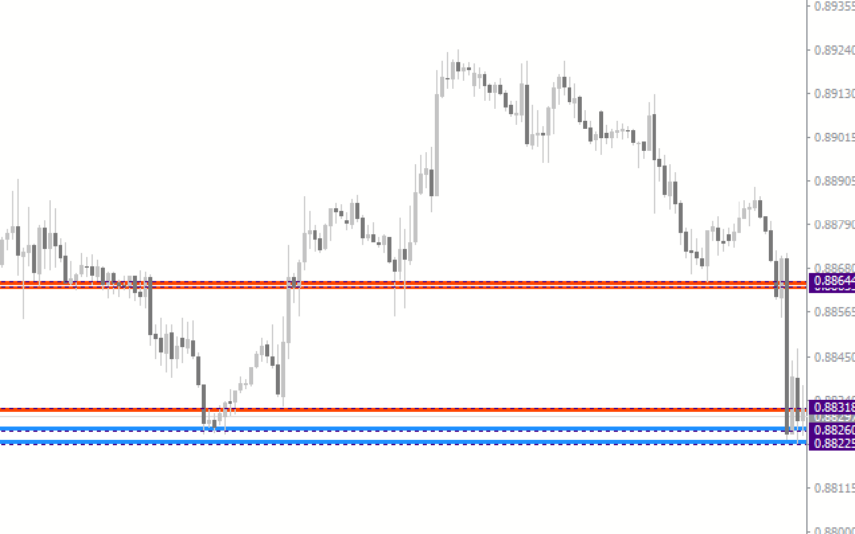
Murrey Math Time Frame
The Murrey Math Time Frame Indicator is a popular free Forex indicator for MetaTrader 4 (MT4) that helps traders identify potential trading opportunities in the Forex market. The indicator uses a mathematical formula to identify key support and resistance levels within a specified time frame, making it a useful tool for traders looking to capitalize on short-term market movements. The indicator displays the current trend of the market, as well as the buy and sell signals, in an easy to read graphical format. This makes it a valuable tool for traders looking to maximize their profits in the Forex market.
| Trading Style | , , |
|---|---|
| Indicator Type | , |
| Timeframe | |
| Platform |
0
People watching this product now!
Downloads - 20
Description
Reviews (0)
How to Install
Related products
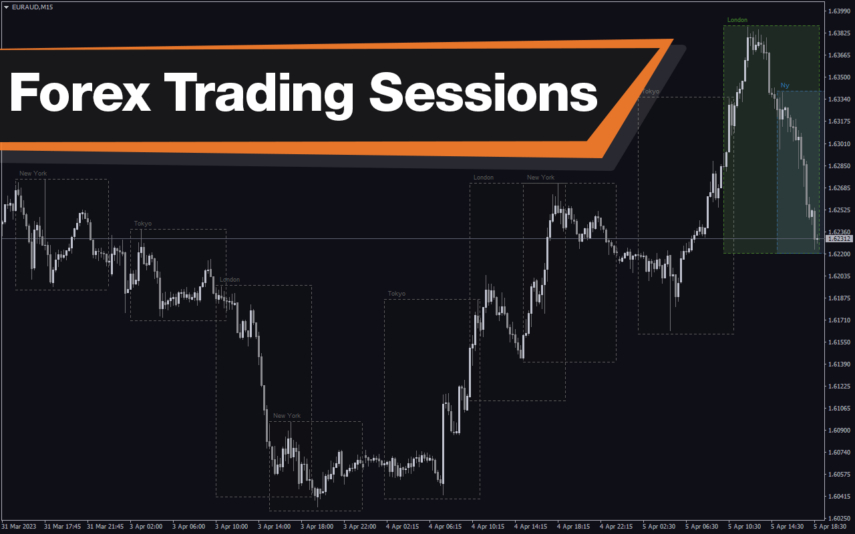
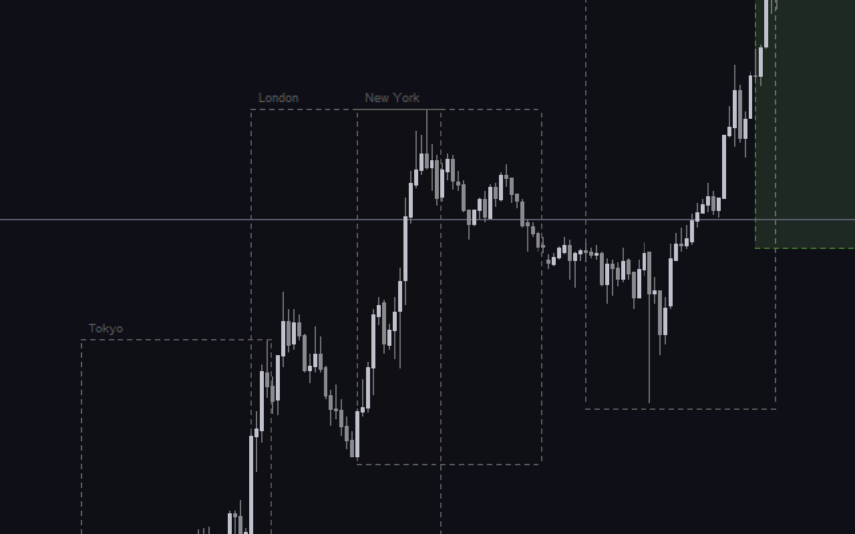
Forex Trading Sessions
The Forex Trading Sessions indicator is a new powerful and popular MT4 indicator designed to help traders identify active trading sessions in the forex market. This indicator shows the opening and closing times of various global financial centers including Tokyo, London and New York on a trading chart, highlighting active trading sessions with colored rectangles. The Forex Trading Sessions indicator is a useful tool for forex traders of all levels, from beginners to experienced traders, that provides important information about active forex trading sessions, helping to optimize trading strategies and increase profitability.
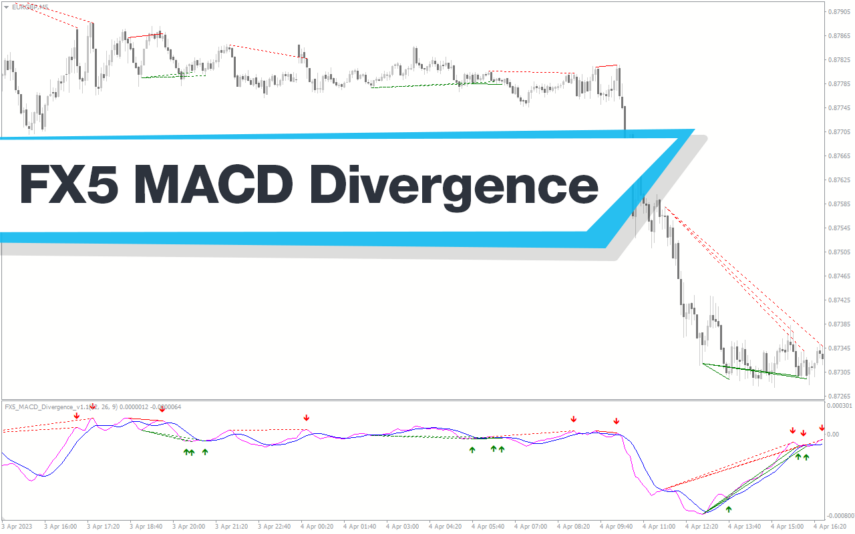
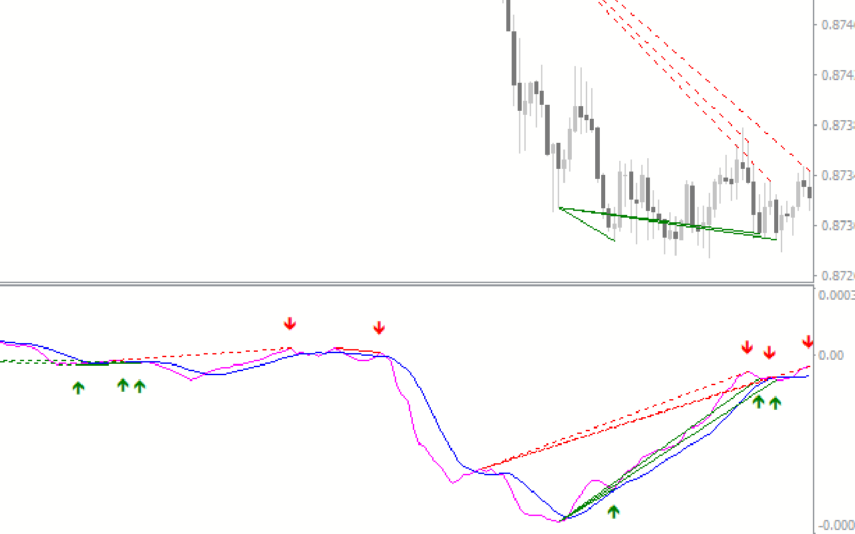
FX5 MACD Divergence
The MACD FX5 Divergence Indicator is a new and popular forex indicator that runs on the MT4 platform. This is a free indicator that traders can use to identify potential trend reversals and momentum shifts. The indicator is based on the Moving Average Convergence-Divergence (MACD) indicator, which measures the distance between two moving averages. It analyzes the divergence between the MACD indicator and price action and then generates buy or sell signals. Use this indicator to better understand market trends and take advantage of potential profit opportunities.
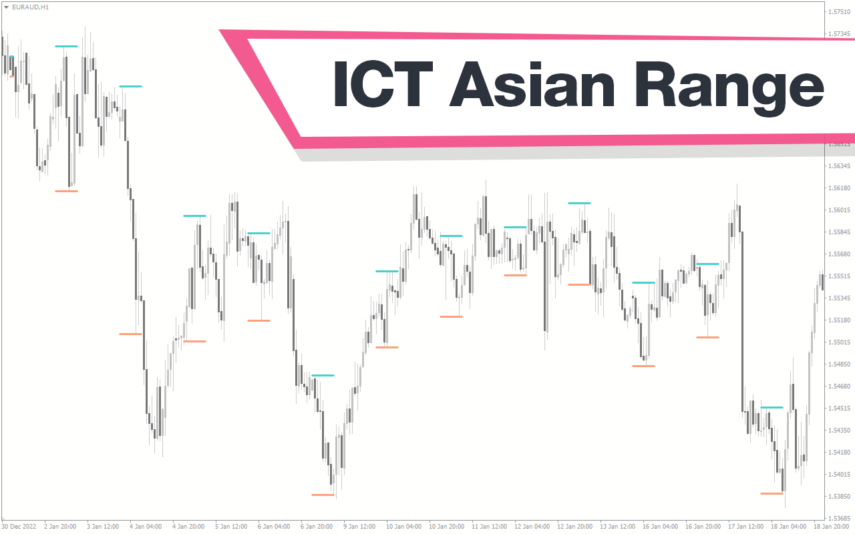
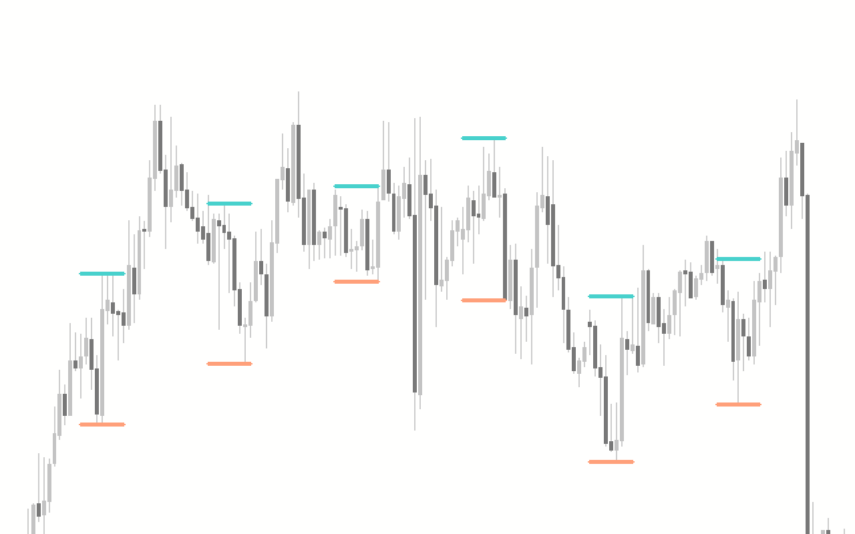
ICT Asian Range
Are you an ICT forex trader? Do you trade ICT Asian breakout strategy? Download this simple ICT Asian range MT4 indicator and improve your forex trading results. This allows traders to quickly identify support and resistance levels for the Asian session, which is a useful tool for traders looking to trade the Asian session.
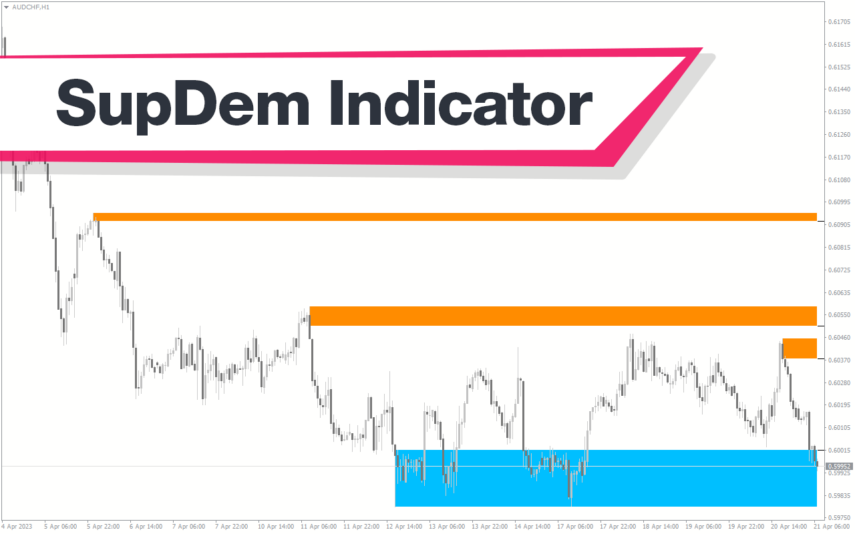
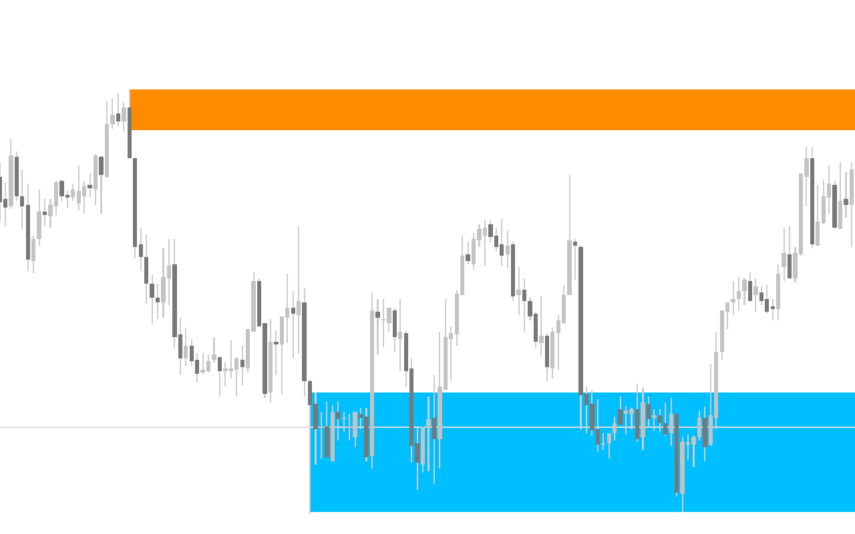
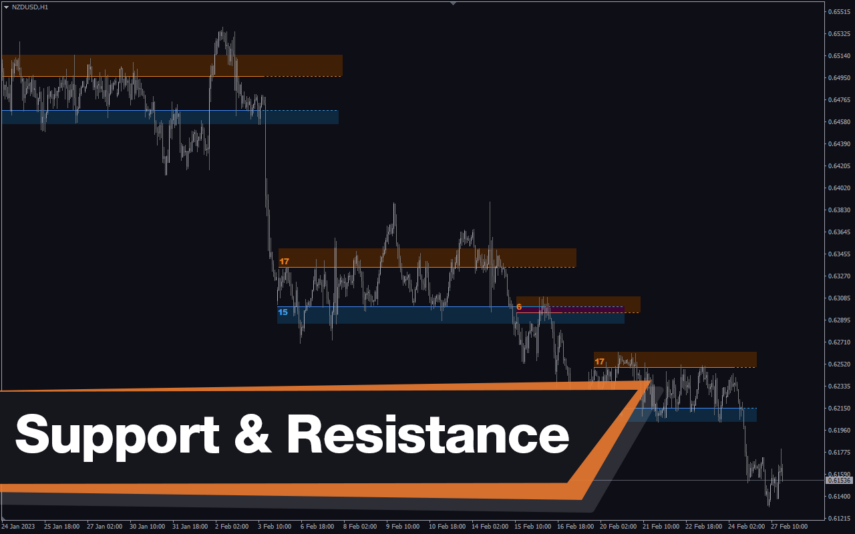
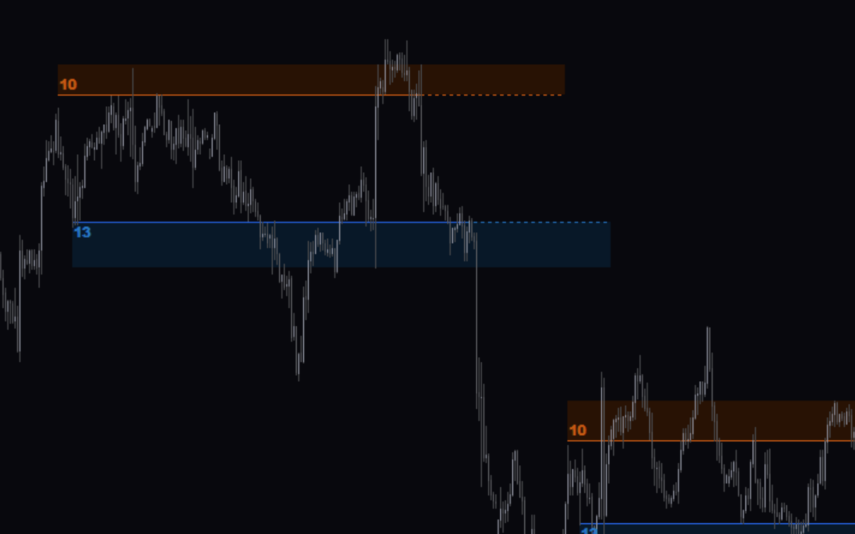
SupDem
The SupDem indicator is a new and popular Forex trading tool that is available for free on MT4. It is designed to determine support and resistance levels by analyzing the supply and demand zones on the chart. The indicator uses color-coded columns to highlight areas of strong support and resistance, allowing traders to easily identify potential trading opportunities. By accurately analyzing supply and demand zones, the SupDem indicator can help traders make more informed trading decisions.
Reviews
There are no reviews yet.